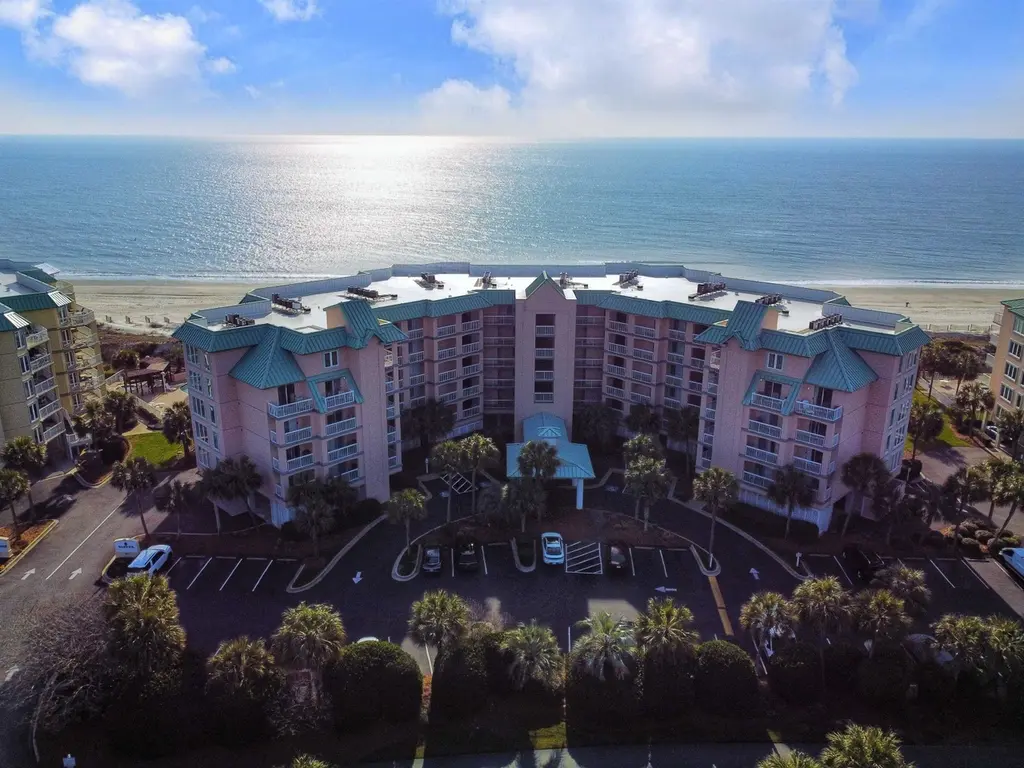
145 Warwick 506; Share 7 South Dunes Dr · Litchfield Beach, SC
Flood risk 10/10 · Severe
- FEMA flood zone
- AE
- Chance of flooding over 30 yrs
- 0.99%
- Est. flood insurance / yr
- $1,737 – $8,500
Fire risk 2/10 · Minimal
- Est. fire insurance / yr
- $783 – $1,453
Heat risk 9/10 · Severe
- Hot days now (above 106°F)
- 7 days/yr
- Hot days in 30 yrs
- 18 days/yr
Wind risk 9/10 · Severe
- Chance of severe wind over 30 yrs
- 99.0%
Air-quality risk 2/10 · Minimal
- Unhealthy air days now
- 0 days/yr
- Unhealthy air days in 30 yrs
- 1 days/yr
Risk factors via First Street. Map © Google.
Why this score? — see what drove the B- grade
The composite is a weighted blend of 9 inputs, each scored 0–100. Each bar is that input's sub-score; the figure is the points it added to the 100-point composite (weight × sub-score).
- Cash flow +30.0/30.0
- 1% rule +10.0/10.0
- DSCR +10.0/10.0
- ARV discount +7.5/15.0
- Condition / age +4.0/5.0
- Schools +2.7/10.0
- Rent growth +2.5/5.0
- Livability +2.5/5.0
- Appreciation +0.0/10.0
$105,000
🖨 Deal sheet (PDF) 📄 Offer letter ✓ Due diligence
Listing remarks MLS
Beautiful, direct, oceanfront interval. Nicely appointed and owners have 4 weeks a year. You will not get a more direct oceanview in LBTS.
Key facts
- Fully furnished
- Breakfast bar
- Custom tiled shower
Tags
Property features AI
Finance
- Financial info: Offered for sale
- HOA & community: Homeowners association with a monthly fee; Association amenities include beach rights, clubhouse, gated access, private membership, security, tennis courts, trash service, cable TV, maintenance of grounds; Association fee covers management, common areas, insurance, internet, legal/accounting, grounds maintenance, pool(s), recreation facilities, sewer, security, trash, and water
Exterior
- Parking: Covered parking
- Security: Gated community; Security service; Smoke detectors
- Utilities: Electricity available; Public water; Sewer available; High-speed internet available; Trash collection
- Home design: Planned Unit Development (PUD); Raised foundation; Resale property
- Exterior features: Balcony; Storage; Outdoor community pool; Located in a flood zone; Waterfront property; Outside city limits; Gated community
Interior
- Kitchen: Dishwasher; Disposal; Microwave; Range; Refrigerator; Stainless steel appliances; Solid surface counters; Breakfast bar
- Bathrooms: 3 full bathrooms
- Heating & cooling: Central heating (electric); Central air
- Interior features: Ceiling fans; Dual sinks; Separate shower; Window treatments; Breakfast bar; High-speed internet; Stainless steel appliances; Solid surface counters; Furnished
- Laundry & utility: Washer hookup; Washer; Dryer
Neighborhood map
What this means for you Summary
Snapshot
- This is a 3-bed/3.0-bath condo listed at $105k. Condition is rated good.
Deal economics
- At list price, monthly cash flow is $352 ($4k/yr) — positive.
- The deal already cash-flows at list — no discount required.
- Meets the 1% rule at list price ($2k rent vs $105k).
- Cap rate 15.2% vs local median 1.8% in Litchfield Beach — top-decile yield for the area; either an underpriced asset or a hidden risk that comps aren't pricing in. Stress-test before assuming the spread holds.
Location & tenants
- Location reads: area grade B — affects rentability + tenant quality, not the cash-flow math above.
- Georgetown 01 (town): math 26% / reading 38% proficiency, ranked #51 of 80 in SC (top 64%) — families likely to look elsewhere, expect single-tenant / working-renter base with shorter leases.
- Zoned schools: Waccamaw Elementary (math 67% / reading 62%, grade B, #56 of 597 statewide, top 10%, 519 students, 100% FRL); Waccamaw Intermediate (math 53% / reading 56%, grade B-, #24 of 229 statewide, top 11%, 420 students, 43% FRL); Waccamaw High (math 42% / reading 93%, grade B, #72 of 196 statewide, top 36%, 858 students, 35% FRL) — zoned schools at 59% FRL track the district average.
- Zoned-school proficiency averages 62% at this address vs 32% district-wide (+30 pts) — the actual schools serving this property are materially stronger than the Georgetown 01 average implies; a family-tenant draw the district grade alone would hide.
- Market conditions: 398 active listings in the ZIP; 5 comparable units currently listed for rent nearby; rentals at typical pace (median 25d on market — plan ~3-4 weeks tenant-placement turnaround); 323 units permitted in Georgetown County in 2024 (0 in 5+ unit buildings).
Forward outlook
- Local home prices are declining (-3.0%/yr); year-one equity from $726 of loan paydown is wiped out by about $3k of value loss. Plan a longer hold.
- At projected returns (-3.0% appreciation + 3.0% rent growth), your $29k cash investment doubles in ~8 years — after that, you're playing with house money.
Negotiation context
- Only 3 days on market — expect competitive offers; lowballing is unlikely to land.
- 25 sale attempts since 14y ago with the ask held roughly flat each time — persistent listings suggest the price (not the market) is what's stuck; bring a comps-based counter.
- Current owner paid $80k; 32% above their basis — modest negotiation headroom, anchor on the comps not their cost.
Risks & watch-outs
- Watch-outs: flood insurance adds $427/mo.
- Climate carrying-cost: in FEMA flood zone AE (mandatory federal flood insurance); severe wind risk, 99% chance of damaging wind over 30y; extreme-heat days projected 7→18/yr by 2055 (HVAC capex compounding) — expect insurance premiums to compound above CPI over the hold.
Questions for the listing agent
- What's the actual annual flood-insurance premium (NFIP or private), and is the property in a SFHA with mandatory coverage?
- What does the HOA fee cover, when was the last increase, and are there any pending special assessments or reserve-fund shortfalls?
- Any open or pending special assessments — roof, HVAC, plumbing, elevator, façade? What's the per-unit balance and payoff schedule, and is the seller paying it off at close or rolling it to the buyer?
- Is there a deadline driving the sale (1031 exchange, divorce, estate, relocation)? That informs how much negotiation room exists.
- What's the average days-on-market for RENTAL listings here right now (not sales)? A rising rental-DOM trend means longer vacancies and softer asking-rent achievability than the comps imply.
- What's the recent tenant-quality profile in this submarket — average credit score on applications, eviction rate, late-payment / NSF rate, and stable-employment percentage? A property-management company in the area should have these aggregated.
- How much new apartment / multifamily construction is in the pipeline within 1–3 miles? Heavy new supply (>2% of stock underway) typically softens rents 12–24 months out; light construction supports rent growth.
Investment metrics
- 1% rule
- 2.21% ✓
- Cap rate
- 15.19%
- Cash-on-cash
- 31.78%
- DSCR
- 2.41
- GRM
- 3.8
CMA / ARV
No comps found within radius.
Projected returns pro-forma
-3.0% appreciation · 3.0% rent growth · sell at horizon
- IRR
- 5.2%
- Equity multiple
- 1.20×
- Total profit
- $5,914
- Equity at exit
- $15,656
- IRR
- 14.9%
- Equity multiple
- 2.23×
- Total profit
- $36,067
- Equity at exit
- $9,078
Cash invested: $29,400 (down + closing). Projections, not guarantees.
Landlord ↔ Tenant lean methodology
- Overall (STATE)
- 90 Strongly Landlord-Friendly
- State South Carolina
- 90 Strongly Landlord-Friendly · R+6
- County
- — inherits STATE
- City
- — inherits STATE
ZIP-level market 29585
- Home prices YoY
- -29.0%
- Active inventory
- 398
- Price-to-rent
- 3.8×
Monthly cashflow live
- Estimated rent
- $2,326 high interval (Pro) →
- Mortgage (P&I)
- −$551
- Tax est. 1.5%
- −$131 /mo · $1,575/yr
- Insurance
- −$44
- Flood insurance flood zone
- −$427 /mo · $5,118/yr
- HOA
- −$333
- Vacancy / Maint / Mgmt
- −$488
- Net cashflow
- $352
Break-even live
Sensitivity live
| Price | -10% $425 | -5% $388 | +0% $352 | +5% $316 | +10% $280 |
|---|---|---|---|---|---|
| Rent | -10% $168 | -5% $260 | +0% $352 | +5% $444 | +10% $536 |
| Rate | -1.0pp $405 | -0.5pp $379 | base $352 | +0.5pp $325 | +1.0pp $297 |
UW: 25.0% down · 7.5% · 30yr · 1.5% tax · 5.0% vac · 8.0% maint · 8.0% mgmt
Financing live
Cash to close
- Down payment
- $26,250
- Closing costs
- $3,150
- Reserves months
- —
- Total cash needed
- —
Loan-product check · same deal, 3 products live
Conventional
25% down · 7.5% · 30yr
- Down + closing
- —
- Monthly P&I
- —
- Monthly cashflow
- —
- DSCR
- —
- Eligible?
- —
Personal DTI + credit; lowest rate.
DSCR
20% down · 8.5% · 30yr
- Down + closing
- —
- Monthly P&I
- —
- Monthly cashflow
- —
- DSCR
- —
- Eligible?
- —
No personal income docs; deal must DSCR.
Hard money
10% down · 12.0% · 12mo
- Down + closing
- —
- Monthly P&I
- —
- Monthly cashflow
- —
- DSCR
- —
- Eligible?
- —
Short-term bridge; refi at stabilization.
Rent comps 5 comps
| Address | Beds | Baths | Sqft | Rent | $/sqft | DOM | Units | Dist |
|---|---|---|---|---|---|---|---|---|
| 5 Ashcraft Cir Pawleys Island, SC | 2.0–3.0 | 2.0 | 1074 | $2,167 | $2.02 | 15d | 10 | 0.69mi |
| 84 Racquet Club Dr Unit WVC 14 Pawleys Island, SC | 3.0 | 2.0 | 1471 | $2,700 | $1.84 | 25d | 1 | 0.90mi |
| 344 Lumbee Cir Pawleys Island, SC | 3.0 | 3.0 | 1800 | $2,300 | $1.28 | 25d | 1 | 0.92mi |
| 105 Weatherboard Ct Pawleys Island, SC | 3.0 | 3.0 | 1480 | $2,500 | $1.69 | 25d | 1 | 1.18mi |
| 736 Algonquin Dr Unit Pawleys Pavilion 736H Pawleys Island, SC | 3.0 | 2.0 | 1250 | $1,700 | $1.36 | 25d | 1 | 1.44mi |
HOA detail condo
- Monthly dues
- $333 · $3,996/yr
- Assessments
- None detected in remarks — confirm with the listing agent.
Listing history 3 events
-
2026-06-14statusdays on market $105,000 Pending 3 DOM
-
2026-06-10remarks 687-char remark
-
2026-06-10$105,000 Active 1 DOM
ⓘ Source: listings_history table (triggers on properties + properties_extension) + one-shot
backfill from property_details.listing_events for pre-trigger history.
Climate risk First Street
- Flood 10/10 Extreme FEMA zone AE · 99% chance over 30 yrs
- Wildfire 2/10 Low
- Heat 9/10 Extreme 7 d/yr ≥106°F today · 18 d/yr by 30 yrs out
- Wind 9/10 Extreme 99% chance of damaging wind over 30 yrs
- Air quality 2/10 Low 0 unhealthy d/yr today · 1 by 30 yrs out
Nearby sold comps map
Loading sold comps map…
Walkable amenities ~0.75 mi
Loading nearby amenities…
Taxation est. · year 1
- Rental income
- $27,908
- − Mortgage interest
- −$5,882
- − Property taxes
- −$1,575
- − Insurance
- −$5,644
- − Repairs & maintenance
- −$2,233
- − Management
- −$2,233
- − HOA
- −$3,996
- − Depreciation
- −$3,055
- Taxable income
- $3,292
- Est. tax owed @ 24.0%
- −$790
- After-tax cash flow
- $3,435/yr
For passive investors: Depreciation is non-cash, so a rental often shows a tax loss while cash-flowing — sheltering income. Rental losses are passive: they offset passive income freely, and up to $25,000/yr can offset ordinary (W-2) income if you actively participate and your MAGI is under $100k (phasing out to $0 by $150k); unused losses carry forward. On sale, claimed depreciation is recaptured at up to 25%, and gains may owe capital-gains tax (a 1031 exchange can defer both). Figures are a year-1 estimate at your 24.0% rate — not tax advice; consult a CPA.
Condition & rehab AI · 12 photos
This oceanfront condo is in excellent condition with a good condition score of 80. It is move-in ready with minimal repairs and maintenance needed.
Value-add opportunities
- Both Painting exterior and interior walls — Enhances curb appeal and interior aesthetics
- Both Reorganizing furniture for better flow — Improves functionality and aesthetics
- Both Updating window treatments — Enhances curb appeal and interior aesthetics
Renovation cost estimate screening
Value-add ROI direction
- Both Painting exterior and interior walls — Enhances curb appeal and interior aesthetics ↑
- Both Reorganizing furniture for better flow — Improves functionality and aesthetics ↑
- Both Updating window treatments — Enhances curb appeal and interior aesthetics ↑
ⓘ Cost ranges are severity-bucket heuristics (US national rule-of-thumb). Get contractor quotes + a written scope before underwriting a rehab budget.
Schools (NCES district)
- District
- Georgetown 01
- NCES district ID
- 4502280
- Math proficiency
- 26% ▼ -11.00%
- Reading proficiency
- 38% ▼ -5.00%
- Median HH income
- $43,045
- Composite
- 27.15/100
- National rank
- #7030
- State rank
- #51 of 80 in SC
Livability — Litchfield Beach
No livability data for this city. (Only ~50 U.S. cities are tracked.)
Census & demographics
- Census place
- Litchfield Beach, SC
- Population (ZIP)
- 17,346
Population outlook (Georgetown County) Hauer SSP2
- Today (2025)
- 63,275 people
- By 2030
- 63,630 · +0.6%
- By 2040
- 63,130 · -0.2%
- By 2050
- 61,904 · -2.2%
- By 2075
- 59,305 · -6.3%
- By 2100
- 53,852 · -14.9%
Race, ethnicity, and origin ACS 2023
- Neighborhood character
- Predominantly White (86%)
- Race & ethnicity
- White 86% Black 7% Two or more races 4% Hispanic / Latino 3%
- Common ancestry
- Slovak 4% Romanian 3% Italian 3%
- Foreign-born
- 2% · Canada
- Languages at home
- 98% English-only · Spanish 1%
Political lean MEDSL · Georgetown
- 2024 margin
- R (+19.5) · D 39.6% · R 59.1% · Other 1.2%
- 2008→2024 swing
- -14.2pp toward R · 2008: -5.2pp · 2024: -19.5pp
- All cycles
- 2024: R+19.5 2020: R+12.7 2016: R+13.0 2012: R+7.6 2008: R+5.2
Not yet ingested
- Civics
- —
Market trends
- HPI YoY
- ▼ -86.24%
- Current HPI
- 211.3537
- Rent YoY
- —
- Metro
- —
- State GDP YoY
- ▲ 4.51%
- F500 in state
- 2
Industry mix (Fortune 500 HQ in SC)
| Industry | F500 HQs | Revenue |
|---|---|---|
| Packaging | 1 | $7B |
|
||
Price history
+32.1% since first listed57 events — show timeline
- 2026-06-09 Listed $105,000 CCAR
- 2023-08-09 Sold (MLS) $79,500 CCAR
- 2023-06-17 Contingent — CCAR
- 2023-06-14 Listed $79,500 CCAR
- 2023-02-24 Sold (MLS) $70,000 CCAR
- 2023-02-13 Contingent — CCAR
- 2023-02-01 Listed $70,000 CCAR
- 2022-03-21 Sold (MLS) $92,000 CCAR
- 2022-02-22 Contingent — CCAR
- 2021-12-02 Sold (MLS) $55,000 CCAR
- 2021-11-08 Listed $92,000 CCAR
- 2021-05-17 Contingent — CCAR
- 2021-05-10 Sold (MLS) $56,500 CCAR
- 2021-04-13 Contingent — CCAR
- 2021-04-05 Relisted — CCAR
- 2021-04-03 Listing Removed — CCAR
- 2021-04-02 Relisted — CCAR
- 2021-04-02 Listing Removed — CCAR
- 2021-01-09 Relisted — CCAR
- 2021-01-08 Listing Removed — CCAR
- 2021-01-08 Relisted — CCAR
- 2021-01-08 Listing Removed — CCAR
- 2020-09-11 Relisted — CCAR
- 2020-09-10 Listing Removed — CCAR
- 2020-08-12 Listing Removed — CCAR
- 2020-08-07 Sold (MLS) $57,500 CCAR
- 2020-07-15 Contingent — CCAR
- 2020-07-14 Listing Removed — CCAR
- 2020-01-06 Listing Removed — CCAR
- 2019-12-23 Listed $49,500 CCAR
- 2019-11-18 Listed $59,000 CCAR
- 2019-11-18 Listed $59,000 CCAR
- 2019-11-18 Listed $59,000 CCAR
- 2019-11-12 Listing Removed — CCAR
- 2019-11-12 Listing Removed — CCAR
- 2019-11-12 Listing Removed — CCAR
- 2018-12-04 Listed $59,000 CCAR
- 2018-12-04 Listed $59,000 CCAR
- 2018-12-04 Listed $59,000 CCAR
- 2018-08-30 Listing Removed — CCAR
- 2018-01-26 Listed $220,000 CCAR
- 2017-04-22 Listing Removed — CCAR
- 2017-04-22 Listing Removed — CCAR
- 2015-02-12 Sold (MLS) $64,000 CCAR
- 2015-01-15 Sold (MLS) $62,500 CCAR
- 2014-11-24 Listing Removed — CCAR
- 2014-08-01 Sold (MLS) $60,000 CCAR
- 2014-04-02 Listed $64,500 CCAR
- 2014-02-11 Listing Removed — CCAR
- 2014-02-11 Listed $69,000 CCAR
- 2014-02-11 Listed $69,000 CCAR
- 2013-10-29 Listed $64,500 CCAR
- 2013-09-01 Listing Removed — CCAR
- 2012-09-01 Listed $85,000 CCAR
- 2012-07-23 Listed $63,500 CCAR
- 2012-07-23 Listed $85,000 CCAR
- 2012-06-01 Listed $79,500 CCAR
Cash-flow waterfall
monthlySold comps — $/sqft
last 12 mo · ≤1 miLoading sold comps…