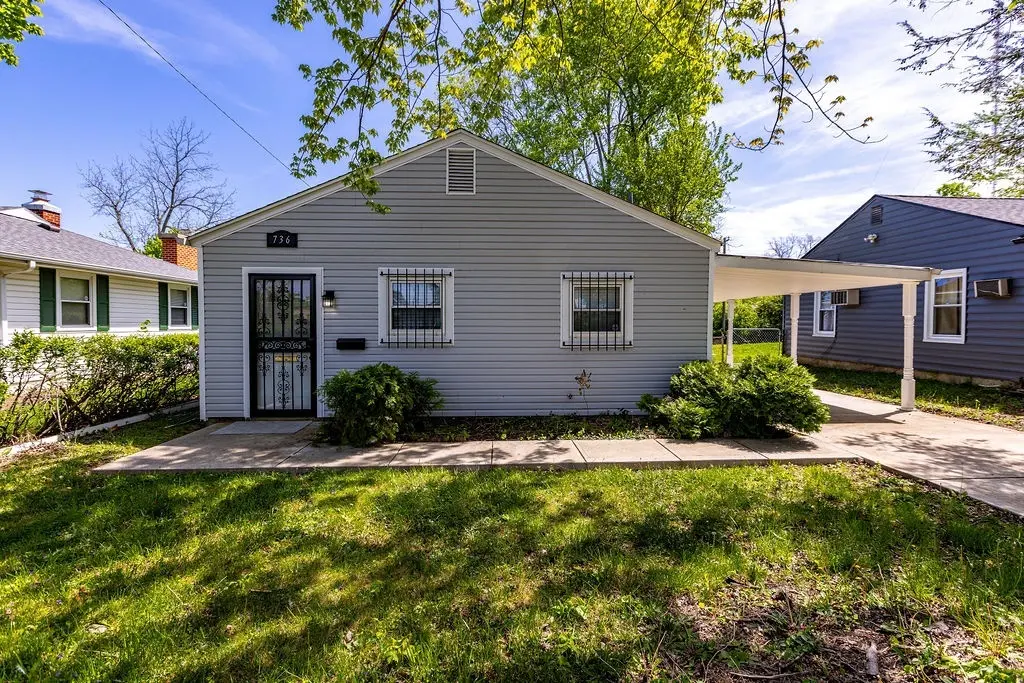
736 Oakleaf Dr · Dayton, OH
Flood risk 1/10 · Minimal
- FEMA flood zone
- X (unshaded)
- Chance of flooding over 30 yrs
- 0.0%
- Est. flood insurance / yr
- $507 – $1,088
Fire risk 1/10 · Minimal
- Est. fire insurance / yr
- $713 – $1,323
Heat risk 3/10 · Minor
- Hot days now (above 104°F)
- 7 days/yr
- Hot days in 30 yrs
- 17 days/yr
Wind risk 2/10 · Minimal
- Chance of severe wind over 30 yrs
- 1.0%
Air-quality risk 2/10 · Minimal
- Unhealthy air days now
- 1 days/yr
- Unhealthy air days in 30 yrs
- 1 days/yr
Risk factors via First Street. Map © Google.
Why this score? — see what drove the D+ grade
The composite is a weighted blend of 9 inputs, each scored 0–100. Each bar is that input's sub-score; the figure is the points it added to the 100-point composite (weight × sub-score).
- Cash flow +20.5/30.0
- ARV discount +7.5/15.0
- DSCR +6.5/10.0
- 1% rule +4.5/10.0
- Rent growth +3.5/5.0
- Livability +3.2/5.0
- Condition / age +2.5/5.0
- Schools +1.3/10.0
- Appreciation +0.0/10.0
$100,000
🖨 Deal sheet (PDF) 📄 Offer letter ✓ Due diligence
Listing remarks MLS
HUD owned, Sold AS-IS. HUD case no. 411-371337. Nice 2 bedroom ranch with vinyl windows and a newer furnace. Would be perfect for the first time homeowner or investor. Great home for the price. EQUAL HOUSING OPPORTUNITY
Key facts
- Driveway
- Modern appliances
- Double basin sink
Tags
Neighborhood map
What this means for you Summary
Snapshot
- This is a 2-bed/1.0-bath single-family listed at $100k.
Deal economics
- At list price, monthly cash flow is $131 ($2k/yr) — positive.
- The deal already cash-flows at list — no discount required.
- To meet the 1% rule (rent ≥ 1% of price), the offer needs to be $95k (5.2% below list).
- Recommended offer: $95k (5.2% below list) — sets the bar for 1% rule.
Location & tenants
- Location reads 65/100 on livability (#716 in OH) — a middle-class / working-renter tenant base. Strengths: cost of living A+, housing A+, health & safety A; Watch: schools C-, amenities C-, crime F.
- Dayton City (urban): math 12% / reading 21% proficiency, ranked #641 of 656 in OH (top 98%) — low school quality limits family demand, transient renter base, plan for 1-2y turnover; 74% free/reduced lunch — lower-income household profile, screen leases tightly.
- Market conditions: Rents rising fast (+4.1%/yr); 135 active listings in the ZIP; 21 comparable units currently listed for rent nearby; rentals at typical pace (median 22d on market — plan ~3-4 weeks tenant-placement turnaround); 48% of comp listings sitting > 30 days — soft ceiling on asking rent; lower-income renter base — watch delinquency; 907 units permitted in Montgomery County in 2024 (416 in 5+ unit buildings).
- This rent runs 31% of the median local income ($37k/yr) — at the standard rent-burdened threshold; future hikes will face affordability resistance.
Forward outlook
- Local home prices are declining (-3.0%/yr); year-one equity from $691 of loan paydown is wiped out by about $3k of value loss. Plan a longer hold.
- Montgomery County population projected at -10% by 2050 — secular population decline; favor cash flow + early exit over multi-decade hold.
Negotiation context
- Only 2 days on market — expect competitive offers; lowballing is unlikely to land.
- 3 sale attempts since 14y ago with the ask held roughly flat each time — persistent listings suggest the price (not the market) is what's stuck; bring a comps-based counter.
- Current owner paid $8k; list at $100k implies a 1174% gain — meaningful room to come down on a strong offer.
Risks & watch-outs
- Watch-outs: built in 1952 — expect roof / HVAC / electrical / plumbing capex.
Questions for the listing agent
- Built in 1952 — when were the roof, HVAC, electrical panel, plumbing, and water heater last replaced?
- Is there a deadline driving the sale (1031 exchange, divorce, estate, relocation)? That informs how much negotiation room exists.
- Crime grade is F in this area — have there been break-ins, vandalism, or insurance claims at this property in the last 3 years? What carrier currently insures it and at what premium?
- The area grade is low — what's the realistic commute time and amenity access for the typical tenant pool here? Any planned neighborhood developments (good or bad) we should know about?
- What's the average days-on-market for RENTAL listings here right now (not sales)? A rising rental-DOM trend means longer vacancies and softer asking-rent achievability than the comps imply.
- What's the recent tenant-quality profile in this submarket — average credit score on applications, eviction rate, late-payment / NSF rate, and stable-employment percentage? A property-management company in the area should have these aggregated.
- How much new for-sale + rental construction is in the pipeline within 1–3 miles? Heavy new supply typically softens prices + rents 12–24 months out; constrained supply supports both.
Investment metrics
- 1% rule
- 0.95% ✗
- Cap rate
- 7.87%
- Cash-on-cash
- 5.62%
- DSCR
- 1.25
- GRM
- 8.8
CMA / ARV
- ARV (on-the-fly)
- $41,184
- Comps found
- 10
Show comp detail 10 sales within ~0.75 mi
| Address | Dist | Beds/Ba | Sqft | Sold | Price | $/sf | Match |
|---|---|---|---|---|---|---|---|
| 714 Oakleaf Dr | 0.04mi | 2/1.0 | 825 (+4%) | 11mo | $69,900 | $85 | 82 |
| 820 Ernroe Dr | 0.12mi | 3/1.0 (+1) | 864 (+9%) | 3mo | $45,000 | $52 | 71 |
| 737 Oakleaf Dr | 0.03mi | 2/1.0 | 887 (+12%) | 11mo | $41,000 | $46 | 69 |
| 3356 Forent Ave | 0.12mi | 3/1.0 (+1) | 864 (+9%) | 14mo | $69,900 | $81 | 62 |
| 2932 Sage Ave | 0.42mi | 2/1.0 | 884 (+12%) | 0mo | $46,000 | $52 | 61 |
| 2922 Revels Ave | 0.47mi | 2/1.0 | 884 (+12%) | 5mo | $40,000 | $45 | 55 |
| 3422 Haberer Ave | 0.37mi | 3/1.0 (+1) | 894 (+13%) | 7mo | $83,000 | $93 | 51 |
| 2823 Revels Ave | 0.56mi | 2/1.0 | 884 (+12%) | 13mo | $19,000 | $21 | 44 |
| 2900 Sage Ave | 0.47mi | 2/1.0 | 884 (+12%) | 21mo | $60,000 | $68 | 42 |
| 501 Fleetfoot Ave | 0.53mi | 1/1.0 (-1) | 732 (-8%) | 21mo | $35,000 | $48 | 40 |
Match score weights: distance 35% · size 25% · config 20% · recency 20%. Top-matched comps best support the ARV.
Projected returns pro-forma
-3.0% appreciation · 4.06% rent growth · sell at horizon
- IRR
- -6.6%
- Equity multiple
- 0.75×
- Total profit
- $-6,866
- Equity at exit
- $14,910
- IRR
- 4.2%
- Equity multiple
- 1.32×
- Total profit
- $8,927
- Equity at exit
- $8,646
Cash invested: $28,000 (down + closing). Projections, not guarantees.
Landlord ↔ Tenant lean methodology
- Overall (STATE)
- 73 Landlord-Friendly
- State Ohio
- 73 Landlord-Friendly · R+6
- County
- — inherits STATE
- City
- — inherits STATE
ZIP-level market 45417
- Home prices YoY
- -32.3%
- Rents YoY
- 4.1%
- Active inventory
- 135
- Price-to-rent
- 8.8×
Monthly cashflow live
- Estimated rent
- $948 high interval (Pro) →
- Mortgage (P&I)
- −$524
- Tax from tax record
- −$52 /mo · $620/yr
- Insurance
- −$42
- HOA
- −$0
- Vacancy / Maint / Mgmt
- −$199
- Net cashflow
- $131
Break-even live
Sensitivity live
| Price | -10% $188 | -5% $159 | +0% $131 | +5% $103 | +10% $74 |
|---|---|---|---|---|---|
| Rent | -10% $56 | -5% $94 | +0% $131 | +5% $168 | +10% $206 |
| Rate | -1.0pp $181 | -0.5pp $156 | base $131 | +0.5pp $105 | +1.0pp $79 |
UW: 25.0% down · 7.5% · 30yr · 1.5% tax · 5.0% vac · 8.0% maint · 8.0% mgmt
Financing live
Cash to close
- Down payment
- $25,000
- Closing costs
- $3,000
- Reserves months
- —
- Total cash needed
- —
Loan-product check · same deal, 3 products live
Conventional
25% down · 7.5% · 30yr
- Down + closing
- —
- Monthly P&I
- —
- Monthly cashflow
- —
- DSCR
- —
- Eligible?
- —
Personal DTI + credit; lowest rate.
DSCR
20% down · 8.5% · 30yr
- Down + closing
- —
- Monthly P&I
- —
- Monthly cashflow
- —
- DSCR
- —
- Eligible?
- —
No personal income docs; deal must DSCR.
Hard money
10% down · 12.0% · 12mo
- Down + closing
- —
- Monthly P&I
- —
- Monthly cashflow
- —
- DSCR
- —
- Eligible?
- —
Short-term bridge; refi at stabilization.
Rent comps 21 comps
| Address | Beds | Baths | Sqft | Rent | $/sqft | DOM | Units | Dist |
|---|---|---|---|---|---|---|---|---|
| 3939 Nicholas Rd Dayton, OH | 3.0 | 1.0 | 912 | $1,200 | $1.32 | 44d | 1 | 0.38mi |
| 500 Bowie Dr Unit 122 Dayton, OH | 2.0 | 1.0 | 850 | $910 | $1.07 | 44d | 1 | 0.39mi |
| 3964 Nicholas Rd Dayton, OH | 3.0 | 1.0 | 912 | $1,000 | $1.10 | 4d | 1 | 0.41mi |
| 342 Lookout Ave Dayton, OH | 2.0 | 1.0 | 800 | $750 | $0.94 | 3d | 1 | 0.48mi |
| 342 Lookout Ave Dayton, OH | 2.0 | 1.0 | 800 | $775 | $0.97 | 44d | 1 | 0.48mi |
| 2525 Lakeview Ave Unit 9 Dayton, OH | 1.0 | 1.0 | 920 | $700 | $0.76 | 44d | 1 | 0.79mi |
| 2525 Lakeview Ave Unit 2 Dayton, OH | 1.0 | 1.0 | 750 | $750 | $1.00 | 44d | 1 | 0.79mi |
| 2525 Lakeview Ave Unit 5 Dayton, OH | 1.0 | 1.0 | 750 | $750 | $1.00 | 4d | 1 | 0.79mi |
| 2525 Germantown St Unit A Dayton, OH | 1.0 | 1.0 | 650 | $700 | $1.08 | 44d | 1 | 0.81mi |
| 2525 Germantown St Unit C Dayton, OH | 1.0 | 1.0 | 750 | $750 | $1.00 | 44d | 1 | 0.81mi |
| 4109 Midway Ave Dayton, OH | 3.0 | 1.0 | 971 | $1,000 | $1.03 | 4d | 1 | 1.09mi |
| 2240 Lakeview Ave Dayton, OH | 3.0 | 1.0 | 1056 | $1,025 | $0.97 | 44d | 1 | 1.11mi |
| 126 Bluecrest Ave Dayton, OH | 2.0 | 1.0 | 840 | $1,000 | $1.19 | 15d | 1 | 1.16mi |
| 1272 Clement Ave Dayton, OH | 3.0 | 1.0 | 1025 | $1,350 | $1.32 | 3d | 1 | 1.24mi |
| 652 Dennison Ave Dayton, OH | 2.0 | 2.0 | 988 | $1,095 | $1.11 | 22d | 1 | 1.25mi |
| 137 Westwood Ave Dayton, OH | 2.0 | 1.0 | 784 | $900 | $1.15 | 4d | 1 | 1.26mi |
| 673 Randolph St Dayton, OH | 2.0 | 1.0 | 792 | $950 | $1.20 | 44d | 1 | 1.26mi |
| 70 Gramont Ave Dayton, OH | 3.0 | 1.5 | 966 | $1,300 | $1.35 | 3d | 1 | 1.36mi |
| 3627 Delphos Ave Dayton, OH | 1.0 | 1.0 | 525 | $625 | $1.19 | 15d | 1 | 1.38mi |
| 729 Cleverly Rd Dayton, OH | 2.0 | 1.0 | 626 | $950 | $1.52 | 44d | 1 | 1.47mi |
| 5090 Altrim Rd Dayton, OH | 3.0 | 1.0 | 925 | $1,245 | $1.35 | 3d | 1 | 1.48mi |
Listing history 10 events
-
2026-04-26status Pending
-
2026-04-20$100,000 Active
-
2013-08-06soldstatus $7,850 219-char remark
Show marketing remark (219 chars)
HUD owned, Sold AS-IS. HUD case no. 411-371337. Nice 2 bedroom ranch with vinyl windows and a newer furnace. Would be perfect for the first time homeowner or investor. Great home for the price. EQUAL HOUSING OPPORTUNITY
-
2013-08-06soldstatus $7,850 Closed 219-char remark
Show marketing remark (219 chars)
HUD owned, Sold AS-IS. HUD case no. 411-371337. Nice 2 bedroom ranch with vinyl windows and a newer furnace. Would be perfect for the first time homeowner or investor. Great home for the price. EQUAL HOUSING OPPORTUNITY
-
2013-06-25historical 219-char remark
Show marketing remark (219 chars)
HUD owned, Sold AS-IS. HUD case no. 411-371337. Nice 2 bedroom ranch with vinyl windows and a newer furnace. Would be perfect for the first time homeowner or investor. Great home for the price. EQUAL HOUSING OPPORTUNITY
-
2013-06-06historical
-
2013-06-05$7,500 219-char remark
Show marketing remark (219 chars)
HUD owned, Sold AS-IS. HUD case no. 411-371337. Nice 2 bedroom ranch with vinyl windows and a newer furnace. Would be perfect for the first time homeowner or investor. Great home for the price. EQUAL HOUSING OPPORTUNITY
-
2012-07-29$37,500
-
1998-08-06soldstatus $39,900
-
1993-06-28soldstatus $13,500
ⓘ Source: listings_history table (triggers on properties + properties_extension) + one-shot
backfill from property_details.listing_events for pre-trigger history.
Tax reassessment forecast OH · Partial reset (capped growth)
- Current annual tax
- $620 · $52/mo
- Projected year-2 tax
- $1,090 · $91/mo
- Expected delta
- +$470/yr (+$39/mo · 75.9%)
ⓘ Screening estimate from a state-policy table — verify with the county assessor before closing.
Climate risk First Street
- Flood 1/10 Low FEMA zone X (unshaded) · 0% chance over 30 yrs
- Wildfire 1/10 Low
- Heat 3/10 Moderate 7 d/yr ≥104°F today · 17 d/yr by 30 yrs out
- Wind 2/10 Low 100% chance of damaging wind over 30 yrs
- Air quality 2/10 Low 1 unhealthy d/yr today · 1 by 30 yrs out
Nearby sold comps map
Loading sold comps map…
Walkable amenities ~0.75 mi
Loading nearby amenities…
Taxation est. · year 1
- Rental income
- $11,374
- − Mortgage interest
- −$5,602
- − Property taxes
- −$620
- − Insurance
- −$500
- − Repairs & maintenance
- −$910
- − Management
- −$910
- − Depreciation
- −$2,909
- Taxable loss
- −$76
- Est. tax savings @ 24.0%
- +$18
- After-tax cash flow
- $1,591/yr
For passive investors: Depreciation is non-cash, so a rental often shows a tax loss while cash-flowing — sheltering income. Rental losses are passive: they offset passive income freely, and up to $25,000/yr can offset ordinary (W-2) income if you actively participate and your MAGI is under $100k (phasing out to $0 by $150k); unused losses carry forward. On sale, claimed depreciation is recaptured at up to 25%, and gains may owe capital-gains tax (a 1031 exchange can defer both). Figures are a year-1 estimate at your 24.0% rate — not tax advice; consult a CPA.
Schools (NCES district)
- District
- Dayton City
- NCES district ID
- 3904384
- Math proficiency
- 12% ▼ -12.00%
- Reading proficiency
- 21% ▼ -11.00%
- Median HH income
- $28,688
- Composite
- 12.94/100
- National rank
- #9579
- State rank
- #641 of 656 in OH
Livability — Dayton
- Score
- 65/100
- State rank
- #716
- US rank
- #12895
Category grades
Schools grade is shown separately in the Schools card above.
Census & demographics
- Census place
- Dayton, OH
- County
- Montgomery County · 459,541 people
- City population
- 164,387
- Metro
- Dayton-Kettering, OH
- Population (ZIP)
- 28,186
- Household income
- $36,945
- Rent vs Own
- Severe rent burden
- 1822.0
Population outlook (Montgomery County) Hauer SSP2
- Today (2025)
- 523,241 people
- By 2030
- 514,948 · -1.6%
- By 2040
- 493,378 · -5.7%
- By 2050
- 469,639 · -10.2%
- By 2075
- 418,360 · -20.0%
- By 2100
- 353,315 · -32.5%
Race, ethnicity, and origin ACS 2023
- Neighborhood character
- Predominantly Black (71%)
- Race & ethnicity
- Black 71% White 20% Two or more races 8% Hispanic / Latino 3%
- Common ancestry
- Romanian 0%
- Foreign-born
- 3% · Canada
- Languages at home
- 96% English-only · Spanish 2% French/Haitian/Cajun 1%
Political lean MEDSL · Montgomery
- 2024 margin
- Toss-up / Even · D 49.8% · R 49.3%
- 2008→2024 swing
- -5.8pp toward R · 2008: 6.2pp · 2024: 0.5pp
- All cycles
- 2024: D+0.5 2020: D+2.2 2016: R+1.2 2012: D+3.1 2008: D+6.2
Not yet ingested
- Civics
- —
Market trends
- HPI YoY
- ▼ -92.43%
- Current HPI
- 193.4175
- Rent YoY
- ▲ 4.06%
- Metro
- Dayton-Kettering, OH
- State GDP YoY
- ▲ 1.98%
- F500 in state
- 48
Industry mix (Fortune 500 HQ in OH)
| Industry | F500 HQs | Revenue |
|---|---|---|
| Insurance | 3 | $145B |
|
||
| Industrial Machinery | 3 | $49B |
|
||
| Financial Services | 3 | $24B |
|
||
| Consumer Goods | 2 | $93B |
|
||
| Aerospace / Defense | 2 | $47B |
|
||
| Utilities | 2 | $33B |
|
||
Price history
+640.7% since first listed10 events — show timeline
- 2026-04-26 Pending — Dayton MLS
- 2026-04-20 Listed $100,000 Dayton MLS
- 2013-08-06 Sold (MLS) $7,850 Dayton MLS
- 2013-08-06 Sold (MLS) $7,850 Dayton MLS
- 2013-06-25 Listing Removed — Dayton MLS
- 2013-06-06 Listing Removed — Dayton MLS
- 2013-06-05 Listed $7,500 Dayton MLS
- 2012-07-29 Listed $37,500 Dayton MLS
- 1998-08-06 Sold (Public Records) $39,900 Public Records
- 1993-06-28 Sold (Public Records) $13,500 Public Records
Property tax history
-1.6%/yrLatest (2025): $620 · -0.2% YoY. Source: county tax records.
Cash-flow waterfall
monthlySold comps — $/sqft
last 12 mo · ≤1 miLoading sold comps…