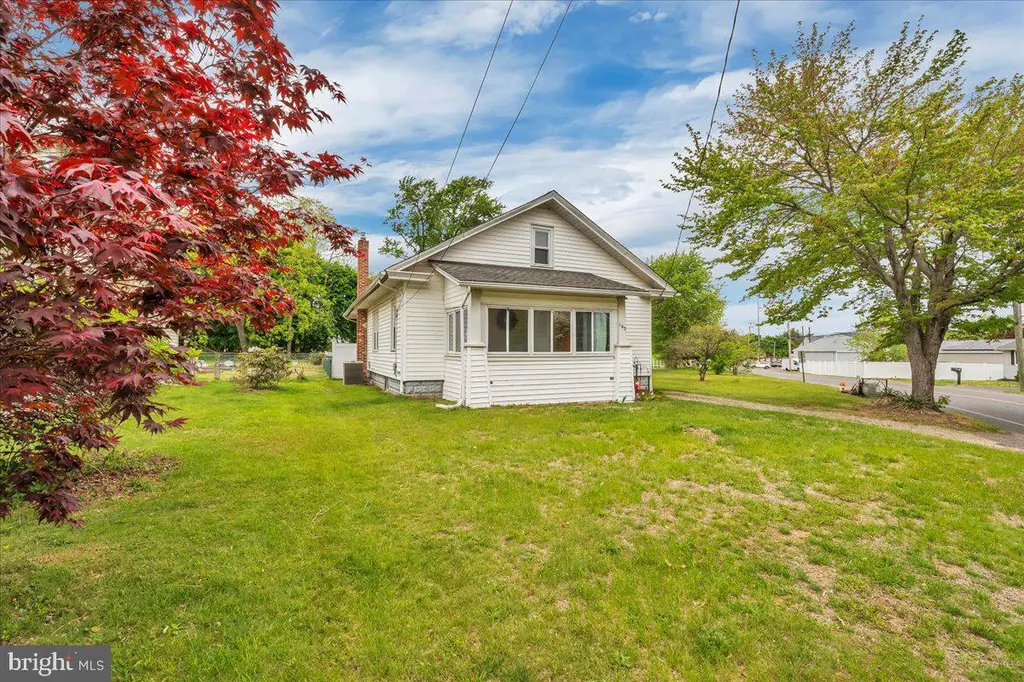
163 County House Rd · Mount Royal, NJ
Flood risk 1/10 · Minimal
- FEMA flood zone
- X (unshaded)
- Chance of flooding over 30 yrs
- 0.0%
- Est. flood insurance / yr
- $507 – $1,088
Fire risk 1/10 · Minimal
- Est. fire insurance / yr
- $526 – $976
Heat risk 7/10 · Major
- Hot days now (above 104°F)
- 7 days/yr
- Hot days in 30 yrs
- 15 days/yr
Wind risk 6/10 · Moderate
- Chance of severe wind over 30 yrs
- 27.0%
Air-quality risk 3/10 · Minor
- Unhealthy air days now
- 2 days/yr
- Unhealthy air days in 30 yrs
- 5 days/yr
Risk factors via First Street. Map © Google.
Why this score? — see what drove the C+ grade
The composite is a weighted blend of 9 inputs, each scored 0–100. Each bar is that input's sub-score; the figure is the points it added to the 100-point composite (weight × sub-score).
- ARV discount +15.0/15.0
- Cash flow +14.7/30.0
- Appreciation +10.0/10.0
- Schools +4.7/10.0
- DSCR +4.5/10.0
- 1% rule +4.2/10.0
- Rent growth +2.5/5.0
- Livability +2.5/5.0
- Condition / age +2.5/5.0
$299,000
🖨 Deal sheet (PDF) 📄 Offer letter ✓ Due diligence
Listing remarks MLS
Great Starter Home In Desirable East Greenwich. Home Is Set On 1/2 Acre Of Property. Walk Up Attic With Plenty Of Potential. House Is Being Sold Strictly As Is. House Is In Need Of Minor Cosmetics. However, The Seller Will Provide A Certificate Of Occupancy And A Termite Certification. Seller Will Spakle And Prime Walls And Remove Carpets Prior To Settlement. Please Do Not Park On Neighbors Property Across The Street!
Key facts
- 0.53 acre lot
- Built 1910
- Listed 10 days
Property features AI
Finance
- Other: Finished above-grade living area reported as 1,094 (assessor source)
- Financial info: No finance or investor-specific income/expense details provided
- HOA & community: No HOA information provided
Exterior
- Parking: Driveway parking
- Security: No security features provided
- Utilities: Public water; Public sewer (no septic); Natural gas hot water; Electric service (standard)
- Home design: Detached structure; Property in very good condition; Fee simple ownership
- Construction: Frame construction; Block foundation; Building not winterized; Built year reported by assessor
- Exterior features: Lot dimensions approximately 75 x 308; Above-grade and below-grade structures noted
Interior
- Kitchen: No kitchen appliance details provided
- Bedrooms: Three bedrooms on the main level
- Flooring: No flooring details provided
- Bathrooms: One full bathroom on the main level
- Heating & cooling: 90% efficient forced air heating; Central air conditioning
- Interior features: Unfinished basement
- Laundry & utility: Washer and dryer in unit (located in basement)
Neighborhood map
What this means for you Summary
Snapshot
- This is a 3-bed/1.0-bath single-family listed at $299k.
Deal economics
- At list price, monthly cash flow is $76 ($917/yr) — positive.
- The deal already cash-flows at list — no discount required.
- To meet the 1% rule (rent ≥ 1% of price), the offer needs to be $275k (8.0% below list).
- Recommended offer: $275k (8.0% below list) — sets the bar for 1% rule.
Location & tenants
- Location reads: area grade C — affects rentability + tenant quality, not the cash-flow math above.
- East Greenwich Township School District (suburban): math 38% / reading 59% proficiency, ranked #119 of 472 in NJ (top 25%) — families likely to look elsewhere, expect single-tenant / working-renter base with shorter leases; only 7% free/reduced lunch — higher-income household profile.
- Zoned schools: Samuel Mickle School (math 38% / reading 59%, grade D, #294 of 1,303 statewide, top 23%, 726 students, 6% FRL); Kingsway Regional Middle School (math 27% / reading 55%, grade F, #188 of 431 statewide, top 44%, 954 students, 11% FRL); Kingsway Regional High School (math 31% / reading 51%, grade F, #180 of 399 statewide, top 46%, 1,947 students, 10% FRL) — zoned schools at 9% FRL track the district average.
- Market conditions: 20 active listings in the ZIP; 1,047 units permitted in Gloucester County in 2024 (183 in 5+ unit buildings).
Forward outlook
- In year one you build about $32k of equity ($2k loan paydown + $30k appreciation (10.0% local appreciation)).
- Gloucester County population projected to shrink 5% by 2050 — rents likely to lag national; underwrite the cash flow, not the appreciation.
- At projected returns (10.0% appreciation + 3.0% rent growth), your $84k cash investment doubles in ~3 years — after that, you're playing with house money.
- By year 2, paydown + projected appreciation supports a ~$51k cash-out refi (75% LTV) — recoverable capital for the next deal without selling this one.
Negotiation context
- Only 10 days on market — expect competitive offers; lowballing is unlikely to land.
- 2 sale attempts since 22y ago with the ask held roughly flat each time — persistent listings suggest the price (not the market) is what's stuck; bring a comps-based counter.
- Current owner paid $142k; list at $299k implies a 110% gain — meaningful room to come down on a strong offer.
Risks & watch-outs
- Watch-outs: built in 1910 — expect roof / HVAC / electrical / plumbing capex.
- Climate carrying-cost: major wind risk, 27% chance of damaging wind over 30y; extreme-heat days projected 7→15/yr by 2055 (HVAC capex compounding) — expect insurance premiums to compound above CPI over the hold.
Questions for the listing agent
- Built in 1910 — when were the roof, HVAC, electrical panel, plumbing, and water heater last replaced?
- Is there a deadline driving the sale (1031 exchange, divorce, estate, relocation)? That informs how much negotiation room exists.
- What's the average days-on-market for RENTAL listings here right now (not sales)? A rising rental-DOM trend means longer vacancies and softer asking-rent achievability than the comps imply.
- What's the recent tenant-quality profile in this submarket — average credit score on applications, eviction rate, late-payment / NSF rate, and stable-employment percentage? A property-management company in the area should have these aggregated.
- How much new for-sale + rental construction is in the pipeline within 1–3 miles? Heavy new supply typically softens prices + rents 12–24 months out; constrained supply supports both.
Investment metrics
- 1% rule
- 0.92% ✗
- Cap rate
- 6.60%
- Cash-on-cash
- 1.09%
- DSCR
- 1.05
- GRM
- 9.1
CMA / ARV
- ARV (on-the-fly)
- $358,832
- Comps found
- 2
Show comp detail 2 sales within ~0.75 mi
| Address | Dist | Beds/Ba | Sqft | Sold | Price | $/sf | Match |
|---|---|---|---|---|---|---|---|
| 12 Mantua Rd | 0.09mi | 4/2.0 (+1) | 1,081 (-1%) | 23mo | $215,000 | $199 | 66 |
| 20 Somers Ave | 0.68mi | 3/1.5 | 1,250 (+14%) | 20mo | $410,000 | $328 | 26 |
Match score weights: distance 35% · size 25% · config 20% · recency 20%. Top-matched comps best support the ARV.
Projected returns pro-forma
10.0% appreciation · 3.0% rent growth · sell at horizon
- IRR
- 25.1%
- Equity multiple
- 3.00×
- Total profit
- $167,769
- Equity at exit
- $269,363
- IRR
- 22.1%
- Equity multiple
- 6.86×
- Total profit
- $490,346
- Equity at exit
- $580,891
Cash invested: $83,720 (down + closing). Projections, not guarantees.
Landlord ↔ Tenant lean methodology
- Overall (STATE)
- 21 Tenant-Leaning
- State New Jersey
- 21 Tenant-Leaning · D+6
- County
- — inherits STATE
- City
- — inherits STATE
ZIP-level market 08061
- Home prices YoY
- 4.5%
- Active inventory
- 20
- Price-to-rent
- 9.1×
Monthly cashflow live
- Estimated rent
- $2,752 medium interval (Pro) →
- Mortgage (P&I)
- −$1,568
- Tax from tax record
- −$405 /mo · $4,857/yr
- Insurance
- −$125
- HOA
- −$0
- Vacancy / Maint / Mgmt
- −$578
- Net cashflow
- $76
Break-even live
Sensitivity live
| Price | -10% $246 | -5% $161 | +0% $76 | +5% $-8 | +10% $-93 |
|---|---|---|---|---|---|
| Rent | -10% $-141 | -5% $-32 | +0% $76 | +5% $185 | +10% $294 |
| Rate | -1.0pp $227 | -0.5pp $152 | base $76 | +0.5pp $-1 | +1.0pp $-80 |
UW: 25.0% down · 7.5% · 30yr · 1.5% tax · 5.0% vac · 8.0% maint · 8.0% mgmt
Financing live
Cash to close
- Down payment
- $74,750
- Closing costs
- $8,970
- Reserves months
- —
- Total cash needed
- —
Loan-product check · same deal, 3 products live
Conventional
25% down · 7.5% · 30yr
- Down + closing
- —
- Monthly P&I
- —
- Monthly cashflow
- —
- DSCR
- —
- Eligible?
- —
Personal DTI + credit; lowest rate.
DSCR
20% down · 8.5% · 30yr
- Down + closing
- —
- Monthly P&I
- —
- Monthly cashflow
- —
- DSCR
- —
- Eligible?
- —
No personal income docs; deal must DSCR.
Hard money
10% down · 12.0% · 12mo
- Down + closing
- —
- Monthly P&I
- —
- Monthly cashflow
- —
- DSCR
- —
- Eligible?
- —
Short-term bridge; refi at stabilization.
Listing history 9 events
-
2026-05-15status Pending
-
2026-05-12historical Active Under Contract
-
2026-05-03$299,000 Active
-
2026-04-30historical $299,000
-
2015-06-04soldstatus $142,500
-
2004-08-13soldstatus $121,000
-
2004-08-05soldstatus $121,000 421-char remark
Show marketing remark (421 chars)
Great Starter Home In Desirable East Greenwich. Home Is Set On 1/2 Acre Of Property. Walk Up Attic With Plenty Of Potential. House Is Being Sold Strictly As Is. House Is In Need Of Minor Cosmetics. However, The Seller Will Provide A Certificate Of Occupancy And A Termite Certification. Seller Will Spakle And Prime Walls And Remove Carpets Prior To Settlement. Please Do Not Park On Neighbors Property Across The Street!
-
2004-07-10historical 421-char remark
Show marketing remark (421 chars)
Great Starter Home In Desirable East Greenwich. Home Is Set On 1/2 Acre Of Property. Walk Up Attic With Plenty Of Potential. House Is Being Sold Strictly As Is. House Is In Need Of Minor Cosmetics. However, The Seller Will Provide A Certificate Of Occupancy And A Termite Certification. Seller Will Spakle And Prime Walls And Remove Carpets Prior To Settlement. Please Do Not Park On Neighbors Property Across The Street!
-
2004-05-04$121,000 421-char remark
Show marketing remark (421 chars)
Great Starter Home In Desirable East Greenwich. Home Is Set On 1/2 Acre Of Property. Walk Up Attic With Plenty Of Potential. House Is Being Sold Strictly As Is. House Is In Need Of Minor Cosmetics. However, The Seller Will Provide A Certificate Of Occupancy And A Termite Certification. Seller Will Spakle And Prime Walls And Remove Carpets Prior To Settlement. Please Do Not Park On Neighbors Property Across The Street!
ⓘ Source: listings_history table (triggers on properties + properties_extension) + one-shot
backfill from property_details.listing_events for pre-trigger history.
Tax reassessment forecast NJ · Partial reset (capped growth)
- Current annual tax
- $4,857 · $405/mo
- Projected year-2 tax
- $6,151 · $513/mo
- Expected delta
- +$1,294/yr (+$108/mo · 26.6%)
ⓘ Screening estimate from a state-policy table — verify with the county assessor before closing.
Climate risk First Street
- Flood 1/10 Low FEMA zone X (unshaded) · 0% chance over 30 yrs
- Wildfire 1/10 Low
- Heat 7/10 Severe 7 d/yr ≥104°F today · 15 d/yr by 30 yrs out
- Wind 6/10 Major 27% chance of damaging wind over 30 yrs
- Air quality 3/10 Moderate 2 unhealthy d/yr today · 5 by 30 yrs out
Nearby sold comps map
Loading sold comps map…
Walkable amenities ~0.75 mi
Loading nearby amenities…
Taxation est. · year 1
- Rental income
- $33,018
- − Mortgage interest
- −$16,749
- − Property taxes
- −$4,857
- − Insurance
- −$1,495
- − Repairs & maintenance
- −$2,641
- − Management
- −$2,641
- − Depreciation
- −$8,698
- Taxable loss
- −$4,063
- Est. tax savings @ 24.0%
- +$975
- After-tax cash flow
- $1,892/yr
For passive investors: Depreciation is non-cash, so a rental often shows a tax loss while cash-flowing — sheltering income. Rental losses are passive: they offset passive income freely, and up to $25,000/yr can offset ordinary (W-2) income if you actively participate and your MAGI is under $100k (phasing out to $0 by $150k); unused losses carry forward. On sale, claimed depreciation is recaptured at up to 25%, and gains may owe capital-gains tax (a 1031 exchange can defer both). Figures are a year-1 estimate at your 24.0% rate — not tax advice; consult a CPA.
Schools (NCES district)
- District
- East Greenwich Township School District
- NCES district ID
- 3404140
- Math proficiency
- 38% ▼ -27.00%
- Reading proficiency
- 59% ▼ -12.00%
- Median HH income
- $106,820
- Composite
- 46.89/100
- National rank
- #2367
- State rank
- #119 of 472 in NJ
Livability — Mount Royal
No livability data for this city. (Only ~50 U.S. cities are tracked.)
Census & demographics
- Census place
- Mount Royal, NJ
- Population (ZIP)
- 4,411
Population outlook (Gloucester County) Hauer SSP2
- Today (2025)
- 298,895 people
- By 2030
- 299,031 · +0.0%
- By 2040
- 294,020 · -1.6%
- By 2050
- 284,188 · -4.9%
- By 2075
- 260,720 · -12.8%
- By 2100
- 229,565 · -23.2%
Race, ethnicity, and origin ACS 2023
- Neighborhood character
- Predominantly White (84%)
- Race & ethnicity
- White 84% Black 9% Two or more races 5% Hispanic / Latino 4% Asian 1%
- Common ancestry
- Romanian 7% English 2% Scotch-Irish 2%
- Foreign-born
- 8%
- Languages at home
- 84% English-only · Arabic 8% Spanish 3% Other Asian/Pacific 2%
Political lean MEDSL · Gloucester
- 2024 margin
- Toss-up / Even · D 47.8% · R 50.6% · Other 1.6%
- 2008→2024 swing
- -15.0pp toward R · 2008: 12.2pp · 2024: -2.8pp
- All cycles
- 2024: R+2.8 2020: D+1.9 2016: R+0.4 2012: D+10.5 2008: D+12.2
Not yet ingested
- Civics
- —
Market trends
- HPI YoY
- ▲ 12.30%
- Current HPI
- 283.4103
- Rent YoY
- —
- Metro
- —
- State GDP YoY
- ▲ 2.05%
- F500 in state
- 34
Industry mix (Fortune 500 HQ in NJ)
| Industry | F500 HQs | Revenue |
|---|---|---|
| Consumer Goods | 3 | $31B |
|
||
| Pharmaceuticals | 2 | $153B |
|
||
| Technology | 2 | $21B |
|
||
| Insurance | 2 | $20B |
|
||
| Healthcare | 2 | $19B |
|
||
| Financial Services | 1 | $70B |
|
||
Price history
+147.1% since first listed9 events — show timeline
- 2026-05-15 Pending — BRIGHT MLS
- 2026-05-12 Contingent — BRIGHT MLS
- 2026-05-03 Listed $299,000 BRIGHT MLS
- 2026-04-30 Coming Soon $299,000 BRIGHT MLS
- 2015-06-04 Sold (Public Records) $142,500 Public Records
- 2004-08-13 Sold (Public Records) $121,000 Public Records
- 2004-08-05 Sold (MLS) $121,000 BRIGHT MLS
- 2004-07-10 Listing Removed — BRIGHT MLS
- 2004-05-04 Listed $121,000 BRIGHT MLS
Property tax history
+2.0%/yrLatest (2025): $4,857 · +0.3% YoY. Source: county tax records.
Cash-flow waterfall
monthlySold comps — $/sqft
last 12 mo · ≤1 miLoading sold comps…