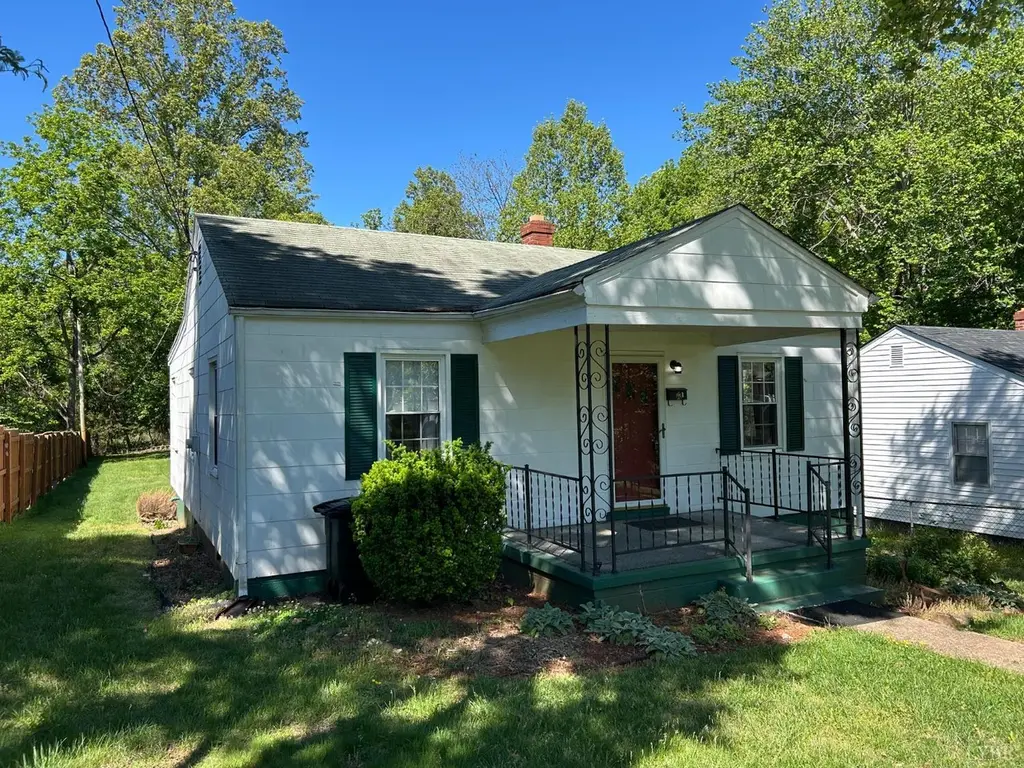
1153 Stratford Rd · Lynchburg, VA
Flood risk 1/10 · Minimal
- FEMA flood zone
- X (unshaded)
- Chance of flooding over 30 yrs
- 0.0%
- Est. flood insurance / yr
- $473 – $860
Fire risk 1/10 · Minimal
- Est. fire insurance / yr
- $666 – $1,236
Heat risk 6/10 · Moderate
- Hot days now (above 101°F)
- 7 days/yr
- Hot days in 30 yrs
- 18 days/yr
Wind risk 2/10 · Minimal
- Chance of severe wind over 30 yrs
- 2.0%
Air-quality risk 2/10 · Minimal
- Unhealthy air days now
- 0 days/yr
- Unhealthy air days in 30 yrs
- 1 days/yr
Risk factors via First Street. Map © Google.
Why this score? — see what drove the B- grade
The composite is a weighted blend of 9 inputs, each scored 0–100. Each bar is that input's sub-score; the figure is the points it added to the 100-point composite (weight × sub-score).
- Cash flow +23.8/30.0
- ARV discount +15.0/15.0
- DSCR +7.7/10.0
- 1% rule +5.6/10.0
- Livability +4.5/5.0
- Schools +4.0/10.0
- Rent growth +3.8/5.0
- Condition / age +2.5/5.0
- Appreciation +0.0/10.0
$138,000
🖨 Deal sheet 📄 Offer letter ✓ Due diligence
Listing remarks
Nice bungalow with 3 bedrooms, 1 bath in Stuart Heights being sold As Is. Nice level lot, and plenty of space in the fenced backyard. There may be trails off the back of the lot leading onto the University of Lynchburg (formerly Lynchburg College).
Key facts
- Fenced backyard
- Trails off the back
- 0.25 acre lot
Tags
Property features AI
Exterior
- Utilities: Public water; Public sewer; Cable available
- Home design: Single family residence; 1 story
- Construction: Asbestos and block construction; Metal and shingle roof; Built above grade (finished area reported)
- Exterior features: Fenced yard; Porch
Interior
- Kitchen: Electric range; Refrigerator
- Flooring: Carpet; Hardwood; Tile; Wood
- Bathrooms: 1 full bathroom
- Heating & cooling: Heat pump; Has heating
- Interior features: Accessible full bathroom; Partial basement with sump pump; Porch
- Laundry & utility: Washer hookup; Washer and dryer included; Electric water heater; Laundry located in basement
Neighborhood map
What this means for you Summary
Snapshot
- This is a 3-bed/1.0-bath single-family listed at $138k.
Deal economics
- At list price, monthly cash flow is $266 ($3k/yr) — positive.
- The deal already cash-flows at list — no discount required.
- Meets the 1% rule at list price ($1k rent vs $138k).
- Recommended offer: $136k (1.5% below list) — sets the bar for market timing.
- Cap rate 8.6% vs local median 4.0% in Lynchburg — top-decile yield for the area; either an underpriced asset or a hidden risk that comps aren't pricing in. Stress-test before assuming the spread holds.
Location & tenants
- Location reads 91/100 on livability (#1 in VA, #58 nationally) — a professional / high-income tenant draw. Strengths: amenities A+, commute A+, cost of living A+; Watch: crime C-, employment D+.
- Lynchburg City Public School District (urban): math 36% / reading 61% proficiency, ranked #104 of 131 in VA (top 79%) — families likely to look elsewhere, expect single-tenant / working-renter base with shorter leases; 61% free/reduced lunch — lower-income household profile, screen leases tightly.
- Zoned schools: Perrymont Elementary (math 27% / reading 42%, grade F, #966 of 1,108 statewide, top 89%, 337 students, 95% FRL); Heritage High (math 32% / reading 77%, grade C-, #281 of 319 statewide, top 90%, 1,073 students, 94% FRL) — zoned schools average 94% FRL vs 61% district-wide (34 pts higher); higher-poverty schools than district average — tighter screening recommended.
- Market conditions: Rents rising fast (+5.1%/yr); 318 active listings in the ZIP; 31 comparable units currently listed for rent nearby; rentals at typical pace (median 21d on market — plan ~3-4 weeks tenant-placement turnaround); 472 units permitted in Lynchburg city in 2024 (240 in 5+ unit buildings).
Forward outlook
- Local home prices are declining (-3.0%/yr); year-one equity from $954 of loan paydown is wiped out by about $4k of value loss. Plan a longer hold.
- Lynchburg County population projected at +37% by 2050 — long-run rental-demand tailwind backs the buy-and-hold thesis.
- At projected returns (-3.0% appreciation + 5.1% rent growth), your $39k cash investment doubles in ~10 years — after that, you're playing with house money.
Negotiation context
- It's been on market 26 days — a 2% lower offer ($136k) is reasonable based on typical stale-listing flexibility.
- 2 sale attempts with the ask held roughly flat each time — persistent listings suggest the price (not the market) is what's stuck; bring a comps-based counter.
- Current owner paid $14k; list at $138k implies a 852% gain — meaningful room to come down on a strong offer.
Risks & watch-outs
- Watch-outs: built in 1947 — expect roof / HVAC / electrical / plumbing capex.
- Climate carrying-cost: extreme-heat days projected 7→18/yr by 2055 (HVAC capex compounding) — expect insurance premiums to compound above CPI over the hold.
Questions for the listing agent
- Built in 1947 — when were the roof, HVAC, electrical panel, plumbing, and water heater last replaced?
- Is there a deadline driving the sale (1031 exchange, divorce, estate, relocation)? That informs how much negotiation room exists.
- Schools are A-rated — typically a magnet for longer-tenancy family renters. What's the average tenant stay here, and is there a school-zone premium baked into asking?
- What's the average days-on-market for RENTAL listings here right now (not sales)? A rising rental-DOM trend means longer vacancies and softer asking-rent achievability than the comps imply.
- What's the recent tenant-quality profile in this submarket — average credit score on applications, eviction rate, late-payment / NSF rate, and stable-employment percentage? A property-management company in the area should have these aggregated.
- How much new for-sale + rental construction is in the pipeline within 1–3 miles? Heavy new supply typically softens prices + rents 12–24 months out; constrained supply supports both.
Investment metrics
- 1% rule
- 1.06% ✓
- Cap rate
- 8.60%
- Cash-on-cash
- 8.25%
- DSCR
- 1.37
- GRM
- 7.9
CMA / ARV
- ARV (median comp)
- $178,161
- List price
- $138,000
- Delta
- -22.54%
- Verdict
- UNDERPRICED
- Comps
- 20 within 1.0 mi
Show comp detail 12 sales within ~0.75 mi
| Address | Dist | Beds/Ba | Sqft | Sold | Price | $/sf | Match |
|---|---|---|---|---|---|---|---|
| 1202 Brandon Rd | 0.12mi | 3/2.0 | 1,113 (+2%) | 14mo | $200,000 | $180 | 75 |
| 505 Thomas Rd Rd | 0.45mi | 2/1.0 (-1) | 1,087 (+0%) | 6mo | $120,000 | $110 | 69 |
| 1103 Brandon Rd | 0.20mi | 2/1.0 (-1) | 975 (-10%) | 10mo | $184,000 | $189 | 60 |
| 4600 Greenwood Dr | 0.28mi | 2/1.0 (-1) | 933 (-14%) | 1mo | $192,000 | $206 | 58 |
| 612 Sussex St St | 0.63mi | 3/1.0 | 989 (-9%) | 2mo | $189,900 | $192 | 54 |
| 1100 Brandon Rd | 0.23mi | 3/2.0 | 1,229 (+13%) | 12mo | $249,900 | $203 | 53 |
| 717 Crestwood Cir | 0.72mi | 3/1.0 | 1,030 (-5%) | 6mo | $220,000 | $214 | 52 |
| 707 Crestwood Cir | 0.74mi | 3/1.0 | 1,197 (+10%) | 4mo | $215,000 | $180 | 45 |
| 1715 Moormans Rd | 0.58mi | 2/1.5 (-1) | 986 (-9%) | 7mo | $199,900 | $203 | 45 |
| 4600 Alabama Ave | 0.57mi | 3/1.5 | 1,226 (+13%) | 10mo | $242,500 | $198 | 42 |
| 734 Crestwood Cir | 0.70mi | 2/2.0 (-1) | 1,020 (-6%) | 11mo | $176,000 | $173 | 39 |
| 411 Newberne St | 0.63mi | 2/2.0 (-1) | 927 (-15%) | 2mo | $200,000 | $216 | 35 |
Match score weights: distance 35% · size 25% · config 20% · recency 20%. Top-matched comps best support the ARV.
Projected returns pro-forma
-3.0% appreciation · 5.11% rent growth · sell at horizon
- IRR
- -1.5%
- Equity multiple
- 0.94×
- Total profit
- $-2,294
- Equity at exit
- $20,576
- IRR
- 10.2%
- Equity multiple
- 1.86×
- Total profit
- $33,269
- Equity at exit
- $11,932
Cash invested: $38,640 (down + closing). Projections, not guarantees.
Landlord ↔ Tenant lean methodology
- Overall (STATE)
- 55 Moderately Landlord-Leaning
- State Virginia
- 55 Moderately Landlord-Leaning · D+2
- County
- — inherits STATE
- City
- — inherits STATE
ZIP-level market 24502
- Rents YoY
- 5.1%
- Active inventory
- 318
- Price-to-rent
- 7.9×
Monthly cashflow live
- Estimated rent
- $1,459 high interval (Pro) →
- Mortgage (P&I)
- −$724
- Tax from tax record
- −$106 /mo · $1,268/yr
- Insurance
- −$58
- HOA
- −$0
- Vacancy / Maint / Mgmt
- −$306
- Net cashflow
- $266
Break-even live
UW: 25.0% down · 7.5% · 30yr · 1.5% tax · 5.0% vac · 8.0% maint · 8.0% mgmt
Financing live
Cash to close
- Down payment
- $34,500
- Closing costs
- $4,140
- Reserves months
- —
- Total cash needed
- —
Loan-product check · same deal, 3 products live
Conventional
25% down · 7.5% · 30yr
- Down + closing
- —
- Monthly P&I
- —
- Monthly cashflow
- —
- DSCR
- —
- Eligible?
- —
Personal DTI + credit; lowest rate.
DSCR
20% down · 8.5% · 30yr
- Down + closing
- —
- Monthly P&I
- —
- Monthly cashflow
- —
- DSCR
- —
- Eligible?
- —
No personal income docs; deal must DSCR.
Hard money
10% down · 12.0% · 12mo
- Down + closing
- —
- Monthly P&I
- —
- Monthly cashflow
- —
- DSCR
- —
- Eligible?
- —
Short-term bridge; refi at stabilization.
Rent comps 31 comps
| Address | Beds | Baths | Sqft | Rent | $/sqft | DOM | Units | Dist |
|---|---|---|---|---|---|---|---|---|
| 1218 Shirley Rd Lynchburg, VA | 2.0 | 1.0 | 742 | $950 | $1.28 | 20d | 1 | 0.17mi |
| 4647 Ferncliff Dr Lynchburg, VA | 2.0 | 2.0 | 1034 | $1,800 | $1.74 | 43d | 1 | 0.25mi |
| 4612 Greenwood Dr Lynchburg, VA | 3.0 | 1.0 | 1257 | $1,595 | $1.27 | 20d | 1 | 0.30mi |
| 1400 Weeping Willow Dr Apt A Lynchburg, VA | 1.0–3.0 | 1.0–2.0 | 1003 | $1,601 | $1.60 | 13d | 12 | 0.58mi |
| 4607 Fairmont Ave Lynchburg, VA | 3.0 | 1.0 | 1001 | $1,650 | $1.65 | 20d | 1 | 0.61mi |
| 302 Fleetwood Dr Lynchburg, VA | 2.0 | 1.0 | 856 | $995 | $1.16 | 20d | 1 | 0.76mi |
| 540 Monticello Ave Unit B Lynchburg, VA | 2.0 | 1.0 | 900 | $995 | $1.11 | 20d | 1 | 0.77mi |
| 4300 Tremont St Lynchburg, VA | 3.0 | 1.0 | 1122 | $1,200 | $1.07 | 43d | 1 | 0.88mi |
| 1009 Lindsay St Lynchburg, VA | 3.0 | 2.0 | 1050 | $1,800 | $1.71 | 43d | 1 | 0.99mi |
| 311 Killarney Ct Lynchburg, VA | 3.0 | 2.0 | 1300 | $1,295 | $1.00 | 43d | 1 | 1.01mi |
| 4067 Fort Ave Unit 3 Lynchburg, VA | 2.0 | 1.0 | 950 | $995 | $1.05 | 20d | 1 | 1.04mi |
| 412 Kerry Ln Lynchburg, VA | 1.0–3.0 | 1.0–2.0 | 1030 | $1,295 | $1.26 | 13d | 12 | 1.04mi |
| 307 Killarney Ct Lynchburg, VA | 2.0 | 1.5 | 1100 | $1,035 | $0.94 | 20d | 1 | 1.04mi |
| 128 Brenleigh Ct Lynchburg, VA | 2.0–3.0 | 2.0 | 1365 | $1,695 | $1.24 | 13d | 1 | 1.06mi |
| 1810 Broadway St #112 Lynchburg, VA | 2.0 | 2.5 | 1210 | $1,600 | $1.32 | 43d | 1 | 1.08mi |
| 2920 Richmond St Lynchburg, VA | 4.0 | 1.0 | 1472 | $1,695 | $1.15 | 20d | 1 | 1.11mi |
| 403 Kerry Ln Lynchburg, VA | 3.0 | 2.0 | 1300 | $1,295 | $1.00 | 13d | 1 | 1.12mi |
| 220 McConville Rd Lynchburg, VA | 2.0–3.0 | 2.0 | 1070 | $1,400 | $1.31 | 13d | 6 | 1.12mi |
| 106 Yeardley Ave Unit B Lynchburg, VA | 3.0 | 1.0 | 1060 | $895 | $0.84 | 20d | 1 | 1.12mi |
| 111 McConville Rd Lynchburg, VA | 3.0 | 1.0 | 912 | $1,105 | $1.21 | 13d | 1 | 1.15mi |
| 2421 Old Forest Rd Lynchburg, VA | 3.0 | 2.0 | 1400 | $1,550 | $1.11 | 43d | 1 | 1.16mi |
| 1320 Saint Cloud Ave Lynchburg, VA | 3.0 | 1.0 | 960 | $1,550 | $1.61 | 44d | 1 | 1.23mi |
| 803 Mansfield Ave Lynchburg, VA | 2.0 | 1.0 | 900 | $1,300 | $1.44 | 20d | 1 | 1.24mi |
| 101 1/2 Hampden Dr Unit 4 Lynchburg, VA | 2.0 | 1.5 | 1040 | $950 | $0.91 | 20d | 1 | 1.27mi |
| 11 Westdale Dr Lynchburg, VA | 3.0 | 2.5 | 1494 | $1,395 | $0.93 | 43d | 1 | 1.27mi |
| 10 Westdale Dr Lynchburg, VA | 2.0 | 3.0 | 1170 | $1,175 | $1.00 | 43d | 1 | 1.29mi |
| 2121 Langhorne Rd Unit 11041092SF 2BR/2BA Lynchburg, VA | 2.0 | 2.0 | 1092 | $1,495 | $1.37 | 20d | 1 | 1.30mi |
| 2121 Langhorne Rd Lynchburg, VA | 2.0 | 2.0 | 1142 | $1,575 | $1.38 | 20d | 1 | 1.37mi |
| 216 Kenyon St Lynchburg, VA | 2.0 | 1.0 | 1114 | $995 | $0.89 | 43d | 1 | 1.42mi |
| 127 Primrose Ln Unit B Lynchburg, VA | 2.0 | 1.5 | 1040 | $1,095 | $1.05 | 20d | 1 | 1.44mi |
| 2245 Landover Pl Lynchburg, VA | 1.0–3.0 | 1.0–1.5 | 925 | $965 | $1.04 | 43d | 2 | 1.49mi |
Listing history 16 events
-
2026-06-14statusdays on market $138,000 Pending 26 DOM
-
2026-06-13days on market $138,000 Active 25 DOM
-
2026-06-10days on market $138,000 Active 23 DOM
-
2026-06-09days on market $138,000 Active 22 DOM
-
2026-06-08days on market $138,000 Active 21 DOM
-
2026-06-07days on market $138,000 Active 20 DOM
-
2026-06-03days on market $138,000 Active 16 DOM
-
2026-06-02days on market $138,000 Active 15 DOM
-
2026-06-01days on market $138,000 Active 14 DOM
-
2026-05-31days on market $138,000 Active 13 DOM
-
2026-05-30days on market $138,000 Active 12 DOM
-
2026-05-07status Pending 248-char remark
-
2026-04-27$138,000 Active 248-char remark
-
1972-06-19soldstatus $14,500
-
1964-07-24soldstatus $10,000
-
1956-06-02soldstatus $6,800
ⓘ Source: listings_history table (triggers on properties + properties_extension) + one-shot
backfill from property_details.listing_events for pre-trigger history.
Tax reassessment forecast VA · Resets to sale price
- Current annual tax
- $1,268 · $106/mo
- Projected year-2 tax
- $1,268 · $106/mo
- Expected delta
- $0/yr ($0/mo · 0.0%)
ⓘ Screening estimate from a state-policy table — verify with the county assessor before closing.
Climate risk First Street
- Flood 1/10 Low FEMA zone X (unshaded) · 0% chance over 30 yrs
- Wildfire 1/10 Low
- Heat 6/10 Major 7 d/yr ≥101°F today · 18 d/yr by 30 yrs out
- Wind 2/10 Low 2% chance of damaging wind over 30 yrs
- Air quality 2/10 Low 0 unhealthy d/yr today · 1 by 30 yrs out
Nearby sold comps map
Loading sold comps map…
Walkable amenities ~0.75 mi
Loading nearby amenities…
Taxation est. · year 1
- Rental income
- $17,508
- − Mortgage interest
- −$7,730
- − Property taxes
- −$1,268
- − Insurance
- −$690
- − Repairs & maintenance
- −$1,401
- − Management
- −$1,401
- − Depreciation
- −$4,015
- Taxable income
- $1,004
- Est. tax owed @ 24.0%
- −$241
- After-tax cash flow
- $2,948/yr
For passive investors: Depreciation is non-cash, so a rental often shows a tax loss while cash-flowing — sheltering income. Rental losses are passive: they offset passive income freely, and up to $25,000/yr can offset ordinary (W-2) income if you actively participate and your MAGI is under $100k (phasing out to $0 by $150k); unused losses carry forward. On sale, claimed depreciation is recaptured at up to 25%, and gains may owe capital-gains tax (a 1031 exchange can defer both). Figures are a year-1 estimate at your 24.0% rate — not tax advice; consult a CPA.
Schools (NCES district)
- District
- Lynchburg City Public School District
- NCES district ID
- 5102340
- Math proficiency
- 36% ▼ -38.00%
- Reading proficiency
- 61% ▼ -8.00%
- Median HH income
- $39,097
- Composite
- 40.4/100
- National rank
- #3730
- State rank
- #104 of 131 in VA
Livability — Lynchburg
- Score
- 91/100
- State rank
- #1
- US rank
- #58
Category grades
Schools grade is shown separately in the Schools card above.
Census & demographics
- Census place
- Lynchburg, VA
- County
- Lynchburg City · 97,036 people
- City population
- 97,036
- Metro
- Lynchburg, VA
- Population (ZIP)
- 41,979
- Household income
- $68,872
- Rent vs Own
- Severe rent burden
- 1774.0
Population outlook (Lynchburg County) Hauer SSP2
- Today (2025)
- 87,977 people
- By 2030
- 93,626 · +6.4%
- By 2040
- 106,145 · +20.7%
- By 2050
- 120,783 · +37.3%
- By 2075
- 162,249 · +84.4%
- By 2100
- 191,358 · +117.5%
Race, ethnicity, and origin ACS 2023
- Neighborhood character
- Predominantly White (68%)
- Race & ethnicity
- White 68% Black 19% Two or more races 6% Hispanic / Latino 6% Asian 2%
- Hispanic origin (detail)
- Mexican 2%
- Common ancestry
- Slovak 3% Italian 2% Lithuanian 2%
- Foreign-born
- 6% · Canada, South Korea, United Kingdom
- Languages at home
- 91% English-only · Spanish 4% Other Indo-European 1% Other Asian/Pacific 1%
Political lean MEDSL · Lynchburg
- 2024 margin
- Lean R (+7.9) · D 45.4% · R 53.3% · Other 1.3%
- 2008→2024 swing
- -3.9pp toward R · 2008: -4.0pp · 2024: -7.9pp
- All cycles
- 2024: R+7.9 2020: D+2.6 2016: R+9.0 2012: R+10.6 2008: R+4.0
Not yet ingested
- Civics
- —
Market trends
- HPI YoY
- ▼ -222.79%
- Current HPI
- 241.9041
- Rent YoY
- ▲ 5.11%
- Metro
- Lynchburg, VA
- State GDP YoY
- ▲ 2.40%
- F500 in state
- 50
Industry mix (Fortune 500 HQ in VA)
| Industry | F500 HQs | Revenue |
|---|---|---|
| Aerospace / Defense | 4 | $236B |
|
||
| Technology / Defense | 3 | $32B |
|
||
| Financial Services | 2 | $176B |
|
||
| Utilities | 2 | $27B |
|
||
| Insurance | 2 | $25B |
|
||
| Technology | 2 | $15B |
|
||
Price history
+1929.4% since first listed7 events — show timeline
- 2026-06-13 Pending — LMLS
- 2026-05-28 Relisted — LMLS
- 2026-05-07 Pending — LMLS
- 2026-04-27 Listed $138,000 LMLS
- 1972-06-19 Sold (Public Records) $14,500 Public Records
- 1964-07-24 Sold (Public Records) $10,000 Public Records
- 1956-06-02 Sold (Public Records) $6,800 Public Records
Property tax history
+5.6%/yrLatest (2025): $1,268 · +38.2% YoY. Source: county tax records.
Cash-flow waterfall
monthlySold comps — $/sqft
last 12 mo · ≤1 miLoading sold comps…