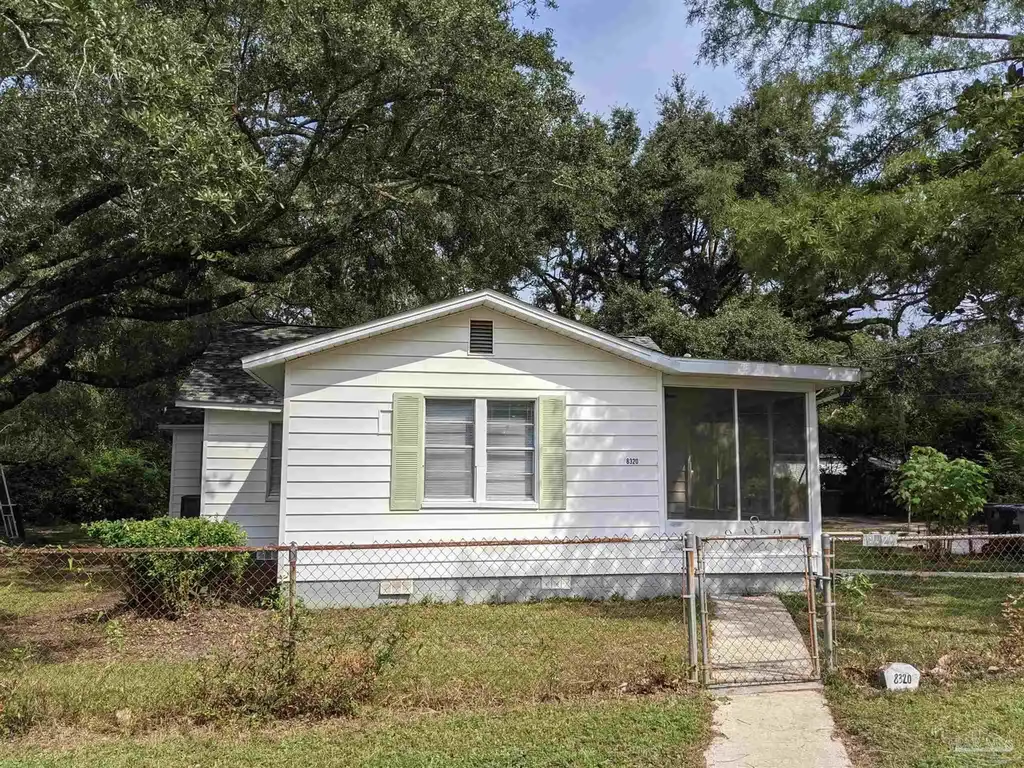
8320 Binkley St · Ferry Pass, FL
Flood risk 1/10 · Minimal
- FEMA flood zone
- X (unshaded)
- Chance of flooding over 30 yrs
- 0.0%
- Est. flood insurance / yr
- $507 – $1,088
Fire risk 1/10 · Minimal
- Est. fire insurance / yr
- $947 – $1,759
Heat risk 10/10 · Severe
- Hot days now (above 106°F)
- 7 days/yr
- Hot days in 30 yrs
- 22 days/yr
Wind risk 9/10 · Severe
- Chance of severe wind over 30 yrs
- 99.0%
Air-quality risk 1/10 · Minimal
- Unhealthy air days now
- 0 days/yr
- Unhealthy air days in 30 yrs
- 0 days/yr
Risk factors via First Street. Map © Google.
Why this score? — see what drove the D grade
The composite is a weighted blend of 9 inputs, each scored 0–100. Each bar is that input's sub-score; the figure is the points it added to the 100-point composite (weight × sub-score).
- Cash flow +15.3/30.0
- ARV discount +7.5/15.0
- DSCR +4.7/10.0
- Schools +3.6/10.0
- 1% rule +3.5/10.0
- Livability +3.2/5.0
- Rent growth +2.7/5.0
- Condition / age +2.5/5.0
- Appreciation +0.0/10.0
$198,500
🖨 Deal sheet (PDF) 📄 Offer letter ✓ Due diligence
Listing remarks
Remodeled 3 Bedroom home on a beautiful . 53 acre lot. Roof and AC less than 7 years old with new plumbing less than 2 years old. If you choose to use it for investment property instead of your very own Home, the lot is zoned Multi-Family <=9. Screened in porch, off street parking. Blocks away from West FL Hospital and close to shopping and UWF. Mobile home on the lot is occupied with monthly rent of $800, but has no value from appraisal perspective if buyer seeking mortgage, rather than cash purchase. Home was previously rented for $1295 per month for total monthly rental income of $2,095.
Key facts
- Remodeled
- Screened in porch
- Off street parking
Tags
Property features AI
Finance
- Other: Lot size approximately 0.53 acres; Total building area about 1,006 square feet
- HOA & community: No association
Exterior
- Parking: Front entrance access
- Utilities: Circuit breaker electric service; Public sewer; Public water
- Home design: Single-story (one level); Detached property; Off-grade foundation; Frame construction
- Construction: Frame construction; Off-grade foundation; Gable roof; One level
- Exterior features: Gable roof; Public water; Paved, county-maintained road
Interior
- Kitchen: Remodeled kitchen with updated cabinets, countertops, light fixtures, and flooring
- Bedrooms: Primary bedroom on the first floor; Second bedroom on the first floor
- Flooring: Laminate flooring
- Bathrooms: One full bathroom (recently remodeled: tub surround, vanity, flooring, light fixtures)
- Heating & cooling: Central heating; Central air; Ceiling fans
- Interior features: Remodeled bathroom; Remodeled kitchen; Breakfast bar
- Laundry & utility: Electric water heater
Neighborhood map
What this means for you Summary
Snapshot
- This is a 3-bed/1.0-bath other listed at $198k.
Deal economics
- At list price, monthly cash flow is $73 ($875/yr) — positive.
- The deal already cash-flows at list — no discount required.
- To meet the 1% rule (rent ≥ 1% of price), the offer needs to be $169k (14.9% below list).
- Recommended offer: $169k (14.9% below list) — sets the bar for 1% rule.
- Cap rate 6.7% vs local median 4.4% in Ferry Pass — top-decile yield for the area; either an underpriced asset or a hidden risk that comps aren't pricing in. Stress-test before assuming the spread holds.
Location & tenants
- Location reads 65/100 on livability (#664 in FL) — a middle-class / working-renter tenant base. Strengths: cost of living A+, housing A+; Watch: employment C-, amenities F, commute F.
- Escambia (suburban): math 40% / reading 45% proficiency, ranked #56 of 73 in FL (top 77%) — families likely to look elsewhere, expect single-tenant / working-renter base with shorter leases.
- Zoned schools: Ferry Pass Elementary School (math 41% / reading 45%, grade F, #1,366 of 2,144 statewide, top 64%, 567 students, 74% FRL); Ferry Pass Middle School (math 34% / reading 33%, grade F, #428 of 571 statewide, top 76%, 1,014 students, 64% FRL); Pine Forest High School (math 20% / reading 32%, grade F, #494 of 667 statewide, top 75%, 1,870 students, 62% FRL).
- Market conditions: Rents flat; 217 active listings in the ZIP; 25 comparable units currently listed for rent nearby; rentals at typical pace (median 26d on market — plan ~3-4 weeks tenant-placement turnaround); 1,479 units permitted in Escambia County in 2024 (0 in 5+ unit buildings).
- This rent runs 30% of the median local income ($67k/yr) — at the standard rent-burdened threshold; future hikes will face affordability resistance.
Forward outlook
- Local home prices are declining (-3.0%/yr); year-one equity from $1k of loan paydown is wiped out by about $6k of value loss. Plan a longer hold.
- Escambia County population projected at +13% by 2050 — modest demand growth; plan on rents tracking national, not racing it.
Negotiation context
- It's been on market 25 days — a 2% lower offer ($196k) is reasonable based on typical stale-listing flexibility.
- 4 sale attempts since 2y ago with the ask held roughly flat each time — persistent listings suggest the price (not the market) is what's stuck; bring a comps-based counter.
- Current owner paid $130k; list at $198k implies a 53% gain — meaningful room to come down on a strong offer.
Risks & watch-outs
- Watch-outs: built in 1949 — expect roof / HVAC / electrical / plumbing capex.
- Climate carrying-cost: severe wind risk, 99% chance of damaging wind over 30y; extreme-heat days projected 7→22/yr by 2055 (HVAC capex compounding) — expect insurance premiums to compound above CPI over the hold.
Questions for the listing agent
- Built in 1949 — when were the roof, HVAC, electrical panel, plumbing, and water heater last replaced?
- Is there a deadline driving the sale (1031 exchange, divorce, estate, relocation)? That informs how much negotiation room exists.
- Schools are D-rated, which usually means shorter tenancies and higher turnover. Who's the typical renter profile here, and what's been the actual vacancy rate?
- The area grade is low — what's the realistic commute time and amenity access for the typical tenant pool here? Any planned neighborhood developments (good or bad) we should know about?
- What's the average days-on-market for RENTAL listings here right now (not sales)? A rising rental-DOM trend means longer vacancies and softer asking-rent achievability than the comps imply.
- What's the recent tenant-quality profile in this submarket — average credit score on applications, eviction rate, late-payment / NSF rate, and stable-employment percentage? A property-management company in the area should have these aggregated.
- How much new for-sale + rental construction is in the pipeline within 1–3 miles? Heavy new supply typically softens prices + rents 12–24 months out; constrained supply supports both.
Investment metrics
- 1% rule
- 0.85% ✗
- Cap rate
- 6.73%
- Cash-on-cash
- 1.57%
- DSCR
- 1.07
- GRM
- 9.8
CMA / ARV
No comps found within radius.
Projected returns pro-forma
-3.0% appreciation · 0.76% rent growth · sell at horizon
- IRR
- -16.2%
- Equity multiple
- 0.44×
- Total profit
- $-31,289
- Equity at exit
- $29,597
- IRR
- -12.0%
- Equity multiple
- 0.35×
- Total profit
- $-36,045
- Equity at exit
- $17,163
Cash invested: $55,580 (down + closing). Projections, not guarantees.
Landlord ↔ Tenant lean methodology
- Overall (STATE)
- 87 Strongly Landlord-Friendly
- State Florida
- 87 Strongly Landlord-Friendly · R+3
- County
- — inherits STATE
- City
- — inherits STATE
ZIP-level market 32514
- Home prices YoY
- -31.2%
- Rents YoY
- 0.8%
- Active inventory
- 217
- Price-to-rent
- 9.8×
Monthly cashflow live
- Estimated rent
- $1,689 high interval (Pro) →
- Mortgage (P&I)
- −$1,041
- Tax from tax record
- −$137 /mo · $1,649/yr
- Insurance
- −$83
- HOA
- −$0
- Vacancy / Maint / Mgmt
- −$355
- Net cashflow
- $73
Break-even live
Sensitivity live
| Price | -10% $185 | -5% $129 | +0% $73 | +5% $17 | +10% $-39 |
|---|---|---|---|---|---|
| Rent | -10% $-61 | -5% $6 | +0% $73 | +5% $140 | +10% $206 |
| Rate | -1.0pp $173 | -0.5pp $123 | base $73 | +0.5pp $21 | +1.0pp $-31 |
UW: 25.0% down · 7.5% · 30yr · 1.5% tax · 5.0% vac · 8.0% maint · 8.0% mgmt
Financing live
Cash to close
- Down payment
- $49,625
- Closing costs
- $5,955
- Reserves months
- —
- Total cash needed
- —
Loan-product check · same deal, 3 products live
Conventional
25% down · 7.5% · 30yr
- Down + closing
- —
- Monthly P&I
- —
- Monthly cashflow
- —
- DSCR
- —
- Eligible?
- —
Personal DTI + credit; lowest rate.
DSCR
20% down · 8.5% · 30yr
- Down + closing
- —
- Monthly P&I
- —
- Monthly cashflow
- —
- DSCR
- —
- Eligible?
- —
No personal income docs; deal must DSCR.
Hard money
10% down · 12.0% · 12mo
- Down + closing
- —
- Monthly P&I
- —
- Monthly cashflow
- —
- DSCR
- —
- Eligible?
- —
Short-term bridge; refi at stabilization.
Rent comps 25 comps
| Address | Beds | Baths | Sqft | Rent | $/sqft | DOM | Units | Dist |
|---|---|---|---|---|---|---|---|---|
| 8707 N Davis Hwy Pensacola, FL | 1.0–3.0 | 1.0–2.0 | 1017 | $2,475 | $2.43 | 15d | 38 | 0.48mi |
| 8917 N Davis Hwy Pensacola, FL | 1.0–2.0 | 1.0–2.0 | 971 | $1,600 | $1.65 | 25d | 1 | 0.76mi |
| 8990 N Davis Hwy Pensacola, FL | 1.0–3.0 | 1.0–2.0 | 1019 | $1,775 | $1.74 | 15d | 20 | 0.77mi |
| 2345 Langston St Pensacola, FL | 2.0 | 1.0 | 806 | $1,250 | $1.55 | 23d | 1 | 0.81mi |
| 1613 Governors Dr Pensacola, FL | 2.0 | 2.0 | 1275 | $1,600 | $1.25 | 25d | 1 | 0.83mi |
| 3205 E Olive Rd Pensacola, FL | 1.0–2.0 | 1.0–2.0 | 900 | $1,540 | $1.71 | 15d | 8 | 0.85mi |
| 7650 Kipling St Unit 3 Pensacola, FL | 2.0 | 2.0 | 800 | $1,000 | $1.25 | 25d | 1 | 0.85mi |
| 7650 Kipling St Unit 1 Pensacola, FL | 3.0 | 2.0 | 1200 | $1,300 | $1.08 | 25d | 1 | 0.85mi |
| 1600 Governors Dr Pensacola, FL | 1.0–3.0 | 1.0–2.0 | 1010 | $1,991 | $1.97 | 15d | 25 | 0.87mi |
| 9004 Governors Place Ct Pensacola, FL | 2.0 | 2.5 | 1250 | $1,450 | $1.16 | 15d | 1 | 0.89mi |
| 1500 E Johnson Ave #128 Pensacola, FL | 2.0 | 2.0 | 1078 | $1,275 | $1.18 | 25d | 1 | 0.90mi |
| 7840 Lilac Ln Pensacola, FL | 1.0–3.0 | 1.0–2.0 | 1025 | $1,904 | $1.86 | 15d | 16 | 0.92mi |
| 8390 Country Walk Dr Unit B Pensacola, FL | 2.0 | 2.0 | 994 | $1,250 | $1.26 | 25d | 1 | 0.96mi |
| 9165 Loomis St Pensacola, FL | 3.0 | 2.0 | 1056 | $1,400 | $1.33 | 25d | 1 | 0.99mi |
| 1857 Atwood Dr Pensacola, FL | 1.0–2.0 | 1.0–1.5 | 892 | $1,399 | $1.57 | 25d | 1 | 0.99mi |
| 7322 Mangum Dr Unit 7322 Pensacola, FL | 2.0 | 2.0 | 1100 | $1,450 | $1.32 | 25d | 1 | 1.01mi |
| 2220 Gloria Cir Pensacola, FL | 2.0–3.0 | 2.0 | 1123 | $1,825 | $1.63 | 15d | 1 | 1.01mi |
| 9307 Mabel St Pensacola, FL | 3.0 | 1.0 | 915 | $1,300 | $1.42 | 25d | 1 | 1.09mi |
| 9184 Arand Dr Pensacola, FL | 3.0 | 2.0 | 1348 | $1,575 | $1.17 | 23d | 1 | 1.19mi |
| 9100 Baldridge Rd Pensacola, FL | 1.0–3.0 | 1.0–2.0 | 1086 | $1,966 | $1.81 | 15d | 13 | 1.19mi |
| 7101 Joy St Unit I5 Pensacola, FL | 3.0 | 2.0 | 1183 | $1,950 | $1.65 | 25d | 1 | 1.19mi |
| 1040 E Olive Rd Pensacola, FL | 1.0–3.0 | 1.0–2.0 | 897 | $1,644 | $1.83 | 25d | 7 | 1.38mi |
| 8108 Ridgefield Rd Pensacola, FL | 3.0 | 2.0 | 1485 | $2,000 | $1.35 | 15d | 1 | 1.39mi |
| 6016 Sewell St Pensacola, FL | 3.0 | 1.5 | 1377 | $1,650 | $1.20 | 25d | 1 | 1.42mi |
| 7150 Plantation Rd #122 Pensacola, FL | 2.0 | 2.0 | 1092 | $1,500 | $1.37 | 25d | 1 | 1.46mi |
Listing history 24 events
-
2026-06-21days on market $198,500 Active 25 DOM
-
2026-06-18days on market $198,500 Active 22 DOM
-
2026-06-17days on market $198,500 Active 21 DOM
-
2026-06-16days on market $198,500 Active 20 DOM
-
2026-06-15days on market $198,500 Active 19 DOM
-
2026-06-14days on market $198,500 Active 17 DOM
-
2026-06-10days on market $198,500 Active 14 DOM
-
2026-06-09days on market $198,500 Active 13 DOM
-
2026-06-08days on market $198,500 Active 12 DOM
-
2026-06-07days on market $198,500 Active 11 DOM
-
2026-06-03days on market $198,500 Active 7 DOM
-
2026-06-02days on market $198,500 Active 6 DOM
-
2026-06-01days on market $198,500 Active 5 DOM
-
2026-05-31days on market $198,500 Active 4 DOM
-
2026-05-31days on market $198,500 Active 3 DOM
-
2026-05-27$198,500 Active
-
2026-05-11soldstatus $129,900
-
2025-06-27historical $1,295
-
2025-06-23historical
-
2025-06-19$1,295
-
2025-06-13price $194,500
-
2025-04-17status Active
-
2025-03-15historical
-
2024-07-24$199,500 Active
ⓘ Source: listings_history table (triggers on properties + properties_extension) + one-shot
backfill from property_details.listing_events for pre-trigger history.
Tax reassessment forecast FL · Resets to sale price
- Current annual tax
- $1,649 · $137/mo
- Projected year-2 tax
- $1,649 · $137/mo
- Expected delta
- $0/yr ($0/mo · -0.0%)
ⓘ Screening estimate from a state-policy table — verify with the county assessor before closing.
Climate risk First Street
- Flood 1/10 Low FEMA zone X (unshaded) · 0% chance over 30 yrs
- Wildfire 1/10 Low
- Heat 10/10 Extreme 7 d/yr ≥106°F today · 22 d/yr by 30 yrs out
- Wind 9/10 Extreme 99% chance of damaging wind over 30 yrs
- Air quality 1/10 Low 0 unhealthy d/yr today · 0 by 30 yrs out
Nearby sold comps map
Loading sold comps map…
Walkable amenities ~0.75 mi
Loading nearby amenities…
Taxation est. · year 1
- Rental income
- $20,263
- − Mortgage interest
- −$11,119
- − Property taxes
- −$1,649
- − Insurance
- −$992
- − Repairs & maintenance
- −$1,621
- − Management
- −$1,621
- − Depreciation
- −$5,775
- Taxable loss
- −$2,514
- Est. tax savings @ 24.0%
- +$603
- After-tax cash flow
- $1,478/yr
For passive investors: Depreciation is non-cash, so a rental often shows a tax loss while cash-flowing — sheltering income. Rental losses are passive: they offset passive income freely, and up to $25,000/yr can offset ordinary (W-2) income if you actively participate and your MAGI is under $100k (phasing out to $0 by $150k); unused losses carry forward. On sale, claimed depreciation is recaptured at up to 25%, and gains may owe capital-gains tax (a 1031 exchange can defer both). Figures are a year-1 estimate at your 24.0% rate — not tax advice; consult a CPA.
Schools (NCES district)
- District
- Escambia
- NCES district ID
- 1200510
- Math proficiency
- 40% ▼ -9.00%
- Reading proficiency
- 45% ▼ -4.00%
- Median HH income
- $44,649
- Composite
- 36.04/100
- National rank
- #4773
- State rank
- #56 of 73 in FL
Livability — Ferry Pass
- Score
- 65/100
- State rank
- #664
- US rank
- #13543
Category grades
Schools grade is shown separately in the Schools card above.
Census & demographics
- Census place
- Ferry Pass, FL
- County
- Escambia County · 301,722 people
- City population
- 43,072
- Metro
- Pensacola-Ferry Pass-Brent, FL
- Population (ZIP)
- 42,447
- Household income
- $66,644
- Rent vs Own
- Severe rent burden
- 1962.0
Population outlook (Escambia County) Hauer SSP2
- Today (2025)
- 334,637 people
- By 2030
- 345,779 · +3.3%
- By 2040
- 364,828 · +9.0%
- By 2050
- 378,514 · +13.1%
- By 2075
- 403,220 · +20.5%
- By 2100
- 386,125 · +15.4%
Race, ethnicity, and origin ACS 2023
- Neighborhood character
- Diverse neighborhood (Simpson 0.55)
- Race & ethnicity
- White 63% Black 22% Two or more races 9% Hispanic / Latino 7% Asian 2%
- Hispanic origin (detail)
- Mexican 2% Puerto Rican 2%
- Common ancestry
- Italian 3% Lithuanian 2% Slovak 2%
- Foreign-born
- 6% · Canada, South Korea
- Languages at home
- 91% English-only · Spanish 5% Other Indo-European 1% Tagalog/Filipino 1%
Political lean MEDSL · Escambia
- 2024 margin
- R (+19.5) · D 39.7% · R 59.2% · Other 1.1%
- 2008→2024 swing
- -0.2pp no change · 2008: -19.3pp · 2024: -19.5pp
- All cycles
- 2024: R+19.5 2020: R+15.1 2016: R+20.6 2012: R+20.6 2008: R+19.3
Not yet ingested
- Civics
- —
Market trends
- HPI YoY
- ▼ -120.99%
- Current HPI
- 266.7408
- Rent YoY
- ▲ 0.76%
- Metro
- Pensacola-Ferry Pass-Brent, FL
- State GDP YoY
- ▲ 3.28%
- F500 in state
- 36
Industry mix (Fortune 500 HQ in FL)
| Industry | F500 HQs | Revenue |
|---|---|---|
| Industrial Technology | 2 | $29B |
|
||
| Insurance | 2 | $17B |
|
||
| Retail | 1 | $60B |
|
||
| Technology Distribution | 1 | $58B |
|
||
| Homebuilding | 1 | $35B |
|
||
| Technology Manufacturing | 1 | $35B |
|
||
Price history
-0.5% since first listed9 events — show timeline
- 2026-05-27 Listed $198,500 PARMLS
- 2026-05-11 Sold (Public Records) $129,900 Public Records
- 2025-06-27 Rental Removed $1,295 PARMLS
- 2025-06-23 Listing Removed — PARMLS
- 2025-06-19 Listed for Rent $1,295 PARMLS
- 2025-06-13 Price Changed $194,500 PARMLS
- 2025-04-17 Relisted — PARMLS
- 2025-03-15 Listing Removed — PARMLS
- 2024-07-24 Listed $199,500 PARMLS
Property tax history
+23.3%/yrLatest (2025): $1,649 · +29.8% YoY. Source: county tax records.
Cash-flow waterfall
monthlySold comps — $/sqft
last 12 mo · ≤1 miLoading sold comps…