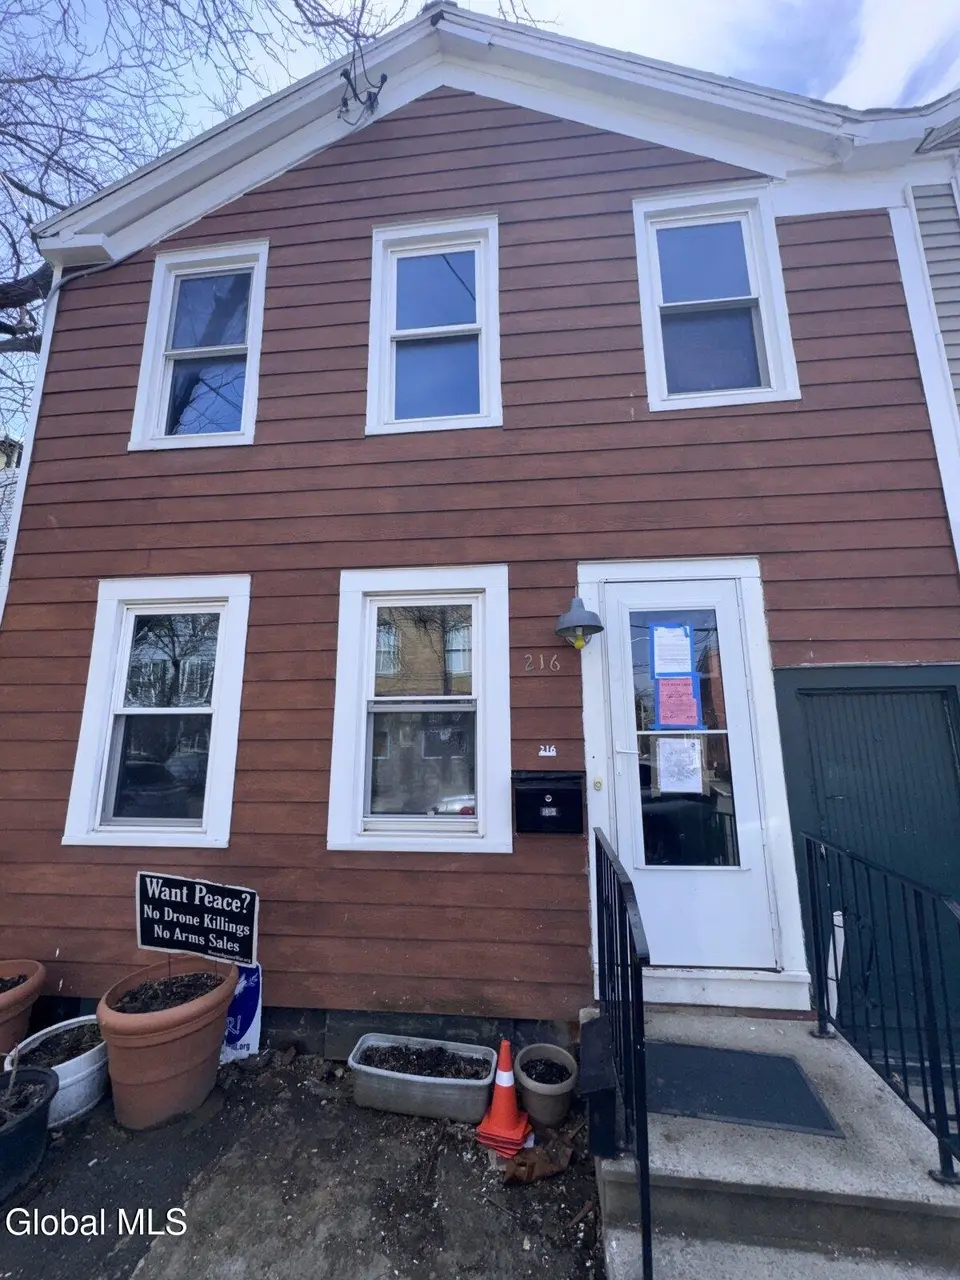
216 Front St · Schenectady, NY
Flood risk 8/10 · Major
- FEMA flood zone
- X (shaded)
- Chance of flooding over 30 yrs
- 0.88%
- Est. flood insurance / yr
- $473 – $860
Fire risk 1/10 · Minimal
- Est. fire insurance / yr
- $691 – $1,283
Heat risk 4/10 · Minor
- Hot days now (above 96°F)
- 7 days/yr
- Hot days in 30 yrs
- 16 days/yr
Wind risk 2/10 · Minimal
- Chance of severe wind over 30 yrs
- 4.0%
Air-quality risk 1/10 · Minimal
- Unhealthy air days now
- 0 days/yr
- Unhealthy air days in 30 yrs
- 0 days/yr
Risk factors via First Street. Map © Google.
Why this score? — see what drove the B+ grade
The composite is a weighted blend of 9 inputs, each scored 0–100. Each bar is that input's sub-score; the figure is the points it added to the 100-point composite (weight × sub-score).
- Cash flow +30.0/30.0
- 1% rule +10.0/10.0
- DSCR +10.0/10.0
- ARV discount +7.5/15.0
- Appreciation +6.6/10.0
- Livability +3.9/5.0
- Schools +3.0/10.0
- Rent growth +2.5/5.0
- Condition / age +2.5/5.0
$60,000
🖨 Deal sheet 📄 Offer letter ✓ Due diligence
Listing remarks
Bring your vision to life! This fully gutted home is a blank canvas with a newer roof already completed. Formerly a 2-bedroom, 1.5-bath layout, it offers great potential. Convenient location near bus routes and just minutes from the highway makes commuting a breeze. CASH BUYERS ONLY, ASSIGNMENT OF CONTRACT.
Key facts
- 2,178 sq ft lot
- Built 1850
Neighborhood map
What this means for you Summary
Snapshot
- This is a 2-bed/1.0-bath townhouse listed at $60k.
Deal economics
- At list price, monthly cash flow is $665 ($8k/yr) — positive.
- The deal already cash-flows at list — no discount required.
- Meets the 1% rule at list price ($1k rent vs $60k).
- Cap rate 20.7% vs local median 6.3% in Schenectady — top-decile yield for the area; either an underpriced asset or a hidden risk that comps aren't pricing in. Stress-test before assuming the spread holds.
Location & tenants
- Location reads 78/100 on livability (#167 in NY, #2,597 nationally) — a middle-class / working-renter tenant base. Strengths: commute A+, health & safety A+, cost of living A; Watch: employment D+, crime F.
- Schenectady City School District (urban): math 38% / reading 34% proficiency, ranked #556 of 590 in NY (top 94%) — families likely to look elsewhere, expect single-tenant / working-renter base with shorter leases; 65% free/reduced lunch — lower-income household profile, screen leases tightly.
- Zoned schools: Schenectady High School (math 75% / reading 90%, grade A, #446 of 1,100 statewide, top 41%, 2,743 students, 71% FRL).
- Zoned-school proficiency averages 82% at this address vs 36% district-wide (+46 pts) — the actual schools serving this property are materially stronger than the Schenectady City School District average implies; a family-tenant draw the district grade alone would hide.
- Market conditions: 20 active listings in the ZIP; 30 comparable units currently listed for rent nearby; rentals at typical pace (median 24d on market — plan ~3-4 weeks tenant-placement turnaround); 154 units permitted in Schenectady County in 2024 (54 in 5+ unit buildings).
- This rent runs 32% of the median local income ($53k/yr) — at the standard rent-burdened threshold; future hikes will face affordability resistance.
Forward outlook
- In year one you build about $2k of equity ($415 loan paydown + $2k appreciation (3.2% local appreciation)).
- Schenectady County population projected to shrink 4% by 2050 — rents likely to lag national; underwrite the cash flow, not the appreciation.
- At projected returns (3.2% appreciation + 3.0% rent growth), your $17k cash investment doubles in ~2 years — after that, you're playing with house money.
Negotiation context
- Only 1 days on market — expect competitive offers; lowballing is unlikely to land.
Risks & watch-outs
- Watch-outs: flood insurance adds $56/mo; built in 1850 — expect roof / HVAC / electrical / plumbing capex.
- Climate carrying-cost: severe flood risk — expect insurance premiums to compound above CPI over the hold.
Questions for the listing agent
- Built in 1850 — when were the roof, HVAC, electrical panel, plumbing, and water heater last replaced?
- What's the actual annual flood-insurance premium (NFIP or private), and is the property in a SFHA with mandatory coverage?
- Is there a deadline driving the sale (1031 exchange, divorce, estate, relocation)? That informs how much negotiation room exists.
- Crime grade is F in this area — have there been break-ins, vandalism, or insurance claims at this property in the last 3 years? What carrier currently insures it and at what premium?
- What's the average days-on-market for RENTAL listings here right now (not sales)? A rising rental-DOM trend means longer vacancies and softer asking-rent achievability than the comps imply.
- What's the recent tenant-quality profile in this submarket — average credit score on applications, eviction rate, late-payment / NSF rate, and stable-employment percentage? A property-management company in the area should have these aggregated.
- How much new for-sale + rental construction is in the pipeline within 1–3 miles? Heavy new supply typically softens prices + rents 12–24 months out; constrained supply supports both.
Investment metrics
- 1% rule
- 2.40% ✓
- Cap rate
- 20.71%
- Cash-on-cash
- 51.49%
- DSCR
- 3.29
- GRM
- 3.5
CMA / ARV
No comps found within radius.
Projected returns pro-forma
3.2% appreciation · 3.0% rent growth · sell at horizon
- IRR
- 53.0%
- Equity multiple
- 3.99×
- Total profit
- $50,302
- Equity at exit
- $27,660
- IRR
- 52.5%
- Equity multiple
- 8.08×
- Total profit
- $118,979
- Equity at exit
- $43,165
Cash invested: $16,800 (down + closing). Projections, not guarantees.
Landlord ↔ Tenant lean methodology
- Overall (STATE)
- 15 Strongly Tenant-Friendly
- State New York
- 15 Strongly Tenant-Friendly · D+10
- County
- — inherits STATE
- City
- — inherits STATE
ZIP-level market 12305
- Home prices YoY
- 1.2%
- Active inventory
- 20
- Price-to-rent
- 3.5×
Monthly cashflow live
- Estimated rent
- $1,437 high interval (Pro) →
- Mortgage (P&I)
- −$315
- Tax est. 1.5%
- −$75 /mo · $900/yr
- Insurance
- −$25
- Flood insurance flood zone
- −$56 /mo · $666/yr
- HOA
- −$0
- Vacancy / Maint / Mgmt
- −$302
- Net cashflow
- $665
Break-even live
UW: 25.0% down · 7.5% · 30yr · 1.5% tax · 5.0% vac · 8.0% maint · 8.0% mgmt
Financing live
Cash to close
- Down payment
- $15,000
- Closing costs
- $1,800
- Reserves months
- —
- Total cash needed
- —
Loan-product check · same deal, 3 products live
Conventional
25% down · 7.5% · 30yr
- Down + closing
- —
- Monthly P&I
- —
- Monthly cashflow
- —
- DSCR
- —
- Eligible?
- —
Personal DTI + credit; lowest rate.
DSCR
20% down · 8.5% · 30yr
- Down + closing
- —
- Monthly P&I
- —
- Monthly cashflow
- —
- DSCR
- —
- Eligible?
- —
No personal income docs; deal must DSCR.
Hard money
10% down · 12.0% · 12mo
- Down + closing
- —
- Monthly P&I
- —
- Monthly cashflow
- —
- DSCR
- —
- Eligible?
- —
Short-term bridge; refi at stabilization.
Rent comps 30 comps
| Address | Beds | Baths | Sqft | Rent | $/sqft | DOM | Units | Dist |
|---|---|---|---|---|---|---|---|---|
| 126 N College St #2 Schenectady, NY | 1.0 | 1.0 | 780 | $1,325 | $1.70 | 14d | 1 | 0.08mi |
| 304 Front St Fl Left Schenectady, NY | 1.0 | 1.0 | 750 | $1,550 | $2.07 | 14d | 1 | 0.11mi |
| 23 Monroe St Unit 23 2R Schenectady, NY | 2.0 | 1.0 | 800 | $1,325 | $1.66 | 14d | 1 | 0.11mi |
| 225 State St Schenectady, NY | 1.0 | 1.0 | 850 | $1,325 | $1.56 | 14d | 4 | 0.41mi |
| 409 State St Schenectady, NY | 2.0 | 1.0 | 1000 | $1,200 | $1.20 | 19d | 1 | 0.45mi |
| 13 State St Schenectady, NY | 1.0–2.0 | 1.0 | 923 | $1,768 | $1.92 | 14d | 1 | 0.49mi |
| 192 Erie Blvd Schenectady, NY | 1.0 | 1.0 | 895 | $1,595 | $1.78 | 21d | 1 | 0.49mi |
| 192 Erie Blvd Apt 401 Schenectady, NY | 1.0 | 1.0 | 819 | $1,595 | $1.95 | 43d | 1 | 0.50mi |
| 192 Erie Blvd Apt 607 Schenectady, NY | 1.0 | 1.0 | 884 | $1,495 | $1.69 | 43d | 1 | 0.50mi |
| 192 Erie Blvd Apt 706 Schenectady, NY | 1.0 | 1.0 | 889 | $1,600 | $1.80 | 23d | 1 | 0.50mi |
| 192 Erie Blvd Apt 502 Schenectady, NY | 1.0 | 1.0 | 915 | $1,495 | $1.63 | 14d | 1 | 0.50mi |
| 192 Erie Blvd Unit 508 Schenectady, NY | 1.0 | 1.0 | 932 | $1,715 | $1.84 | 43d | 1 | 0.50mi |
| 117 Washington Ave Schenectady, NY | 2.0–4.0 | 1.0–2.0 | 1033 | $867 | $0.84 | 14d | 9 | 0.58mi |
| 762 Eastern Ave Schenectady, NY | 2.0 | 1.0 | 1119 | $1,400 | $1.25 | 23d | 1 | 0.73mi |
| 1633 Carrie St Schenectady, NY | 2.0 | 1.0 | 1200 | $1,500 | $1.25 | 43d | 1 | 0.76mi |
| 126 Prospect St Schenectady, NY | 3.0 | 1.0 | 1000 | $1,600 | $1.60 | 23d | 1 | 0.77mi |
| 1037 University Pl Unit 2 Schenectady, NY | 3.0 | 1.0 | 1200 | $1,600 | $1.33 | 43d | 1 | 0.85mi |
| 1673 Van Vranken Ave Schenectady, NY | 3.0 | 1.0 | 1335 | $1,750 | $1.31 | 43d | 1 | 0.86mi |
| 901 Nott St Unit 1R Schenectady, NY | 3.0 | 1.0 | 1500 | $1,250 | $0.83 | 23d | 1 | 0.89mi |
| 1093 Park Ave Schenectady, NY | 1.0 | 1.0 | 900 | $1,200 | $1.33 | 14d | 1 | 0.91mi |
| 100 Reserve Ct Schenectady, NY | 1.0–3.0 | 1.0–2.0 | 1106 | $2,040 | $1.84 | 14d | 1 | 0.97mi |
| 1755 Avenue B Unit B Schenectady, NY | 3.0 | 1.0 | 1200 | $1,700 | $1.42 | 14d | 1 | 1.06mi |
| 918 Delamont Ave Schenectady, NY | 3.0 | 1.0 | 1192 | $1,600 | $1.34 | 23d | 1 | 1.09mi |
| 922 State St Schenectady, NY | 1.0–2.0 | 1.0 | 855 | $1,390 | $1.63 | 14d | 6 | 1.13mi |
| 2042 Van Vranken Ave Schenectady, NY | 2.0 | 1.0 | 816 | $1,200 | $1.47 | 43d | 1 | 1.22mi |
| 23 Hawk St Schenectady, NY | 2.0 | 1.0 | 920 | $1,500 | $1.63 | 19d | 1 | 1.23mi |
| 54 Freemans Bridge Rd Schenectady, NY | 2.0 | 1.0 | 1500 | $2,000 | $1.33 | 43d | 1 | 1.27mi |
| 222 S Ten Broeck St Scotia, NY | 2.0 | 1.0 | 857 | $1,600 | $1.87 | 43d | 1 | 1.35mi |
| 13 Bancker Ave Unit 2 Scotia, NY | 1.0 | 1.0 | 700 | $1,600 | $2.29 | 23d | 1 | 1.47mi |
| 830 Plymouth Ave Schenectady, NY | 2.0 | 1.0 | 1200 | $1,700 | $1.42 | 19d | 1 | 1.49mi |
Listing history 2 events
-
2026-04-18status Pending
-
2026-04-17$60,000 Active
ⓘ Source: listings_history table (triggers on properties + properties_extension) + one-shot
backfill from property_details.listing_events for pre-trigger history.
Climate risk First Street
- Flood 8/10 Severe FEMA zone X (shaded) · 88% chance over 30 yrs
- Wildfire 1/10 Low
- Heat 4/10 Moderate 7 d/yr ≥96°F today · 16 d/yr by 30 yrs out
- Wind 2/10 Low 4% chance of damaging wind over 30 yrs
- Air quality 1/10 Low 0 unhealthy d/yr today · 0 by 30 yrs out
Nearby sold comps map
Loading sold comps map…
Walkable amenities ~0.75 mi
Loading nearby amenities…
Taxation est. · year 1
- Rental income
- $17,249
- − Mortgage interest
- −$3,361
- − Property taxes
- −$900
- − Insurance
- −$966
- − Repairs & maintenance
- −$1,380
- − Management
- −$1,380
- − Depreciation
- −$1,745
- Taxable income
- $7,516
- Est. tax owed @ 24.0%
- −$1,804
- After-tax cash flow
- $6,181/yr
For passive investors: Depreciation is non-cash, so a rental often shows a tax loss while cash-flowing — sheltering income. Rental losses are passive: they offset passive income freely, and up to $25,000/yr can offset ordinary (W-2) income if you actively participate and your MAGI is under $100k (phasing out to $0 by $150k); unused losses carry forward. On sale, claimed depreciation is recaptured at up to 25%, and gains may owe capital-gains tax (a 1031 exchange can defer both). Figures are a year-1 estimate at your 24.0% rate — not tax advice; consult a CPA.
Schools (NCES district)
- District
- Schenectady City School District
- NCES district ID
- 3626010
- Math proficiency
- 38% ▲ 12.00%
- Reading proficiency
- 34% ▲ 2.00%
- Median HH income
- $39,453
- Composite
- 30.2/100
- National rank
- #6309
- State rank
- #556 of 590 in NY
Livability — Schenectady
- Score
- 78/100
- State rank
- #167
- US rank
- #2597
Category grades
Schools grade is shown separately in the Schools card above.
Census & demographics
- Census place
- Schenectady, NY
- County
- Schenectady County · 141,369 people
- City population
- 141,369
- Metro
- Albany-Schenectady-Troy, NY
- Population (ZIP)
- 7,356
- Household income
- $53,326
- Rent vs Own
- Severe rent burden
- 962.0
Population outlook (Schenectady County) Hauer SSP2
- Today (2025)
- 155,046 people
- By 2030
- 154,322 · -0.5%
- By 2040
- 151,796 · -2.1%
- By 2050
- 148,621 · -4.1%
- By 2075
- 141,229 · -8.9%
- By 2100
- 126,014 · -18.7%
Race, ethnicity, and origin ACS 2023
- Neighborhood character
- Diverse neighborhood (Simpson 0.60)
- Race & ethnicity
- White 59% Black 20% Two or more races 14% Hispanic / Latino 10% Asian 2%
- Hispanic origin (detail)
- Mexican 3% Puerto Rican 4%
- Common ancestry
- Romanian 5% Italian 2% Serbian 2%
- Foreign-born
- 10% · Canada, China
- Languages at home
- 91% English-only · Spanish 5% Other Indo-European 1% Russian/Polish/Slavic 1%
Political lean MEDSL · Schenectady
- 2024 margin
- D (+10.8) · D 55.4% · R 44.6%
- 2008→2024 swing
- -1.8pp toward R · 2008: 12.7pp · 2024: 10.8pp
- All cycles
- 2024: D+10.8 2020: D+15.7 2016: D+5.8 2012: D+15.4 2008: D+12.7
Not yet ingested
- Civics
- —
Market trends
- HPI YoY
- ▲ 3.20%
- Current HPI
- 276.7183
- Rent YoY
- —
- Metro
- Albany-Schenectady-Troy, NY
- State GDP YoY
- ▲ 2.60%
- F500 in state
- 92
Industry mix (Fortune 500 HQ in NY)
| Industry | F500 HQs | Revenue |
|---|---|---|
| Financial Services | 10 | $950B |
|
||
| Consumer Goods | 9 | $162B |
|
||
| Insurance | 4 | $225B |
|
||
| Telecommunications | 2 | $144B |
|
||
| Pharmaceuticals | 2 | $112B |
|
||
| Media / Entertainment | 2 | $69B |
|
||
Price history
2 events — show timeline
- 2026-04-18 Pending — Global MLS
- 2026-04-17 Listed $60,000 Global MLS
Property tax history
+1.2%/yrLatest (2025): $3,500 · +4.7% YoY. Source: county tax records.
Cash-flow waterfall
monthlySold comps — $/sqft
last 12 mo · ≤1 miLoading sold comps…