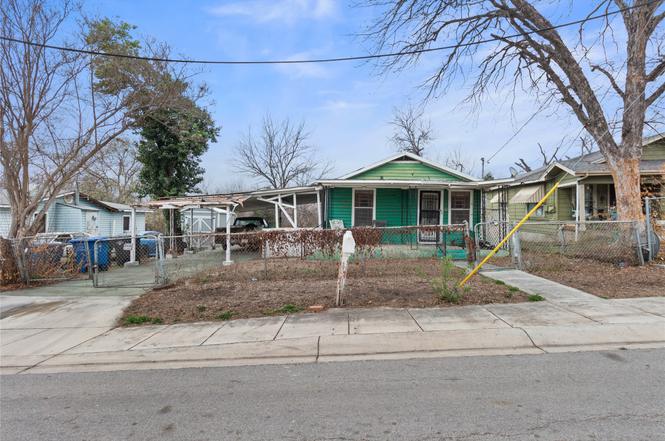
123 Gray St · San Antonio, TX
Flood risk 1/10 · Minimal
- FEMA flood zone
- X (unshaded)
- Chance of flooding over 30 yrs
- 0.0%
- Est. flood insurance / yr
- $507 – $1,088
Fire risk 1/10 · Minimal
- Est. fire insurance / yr
- $1,222 – $2,270
Heat risk 8/10 · Major
- Hot days now (above 108°F)
- 7 days/yr
- Hot days in 30 yrs
- 21 days/yr
Wind risk 8/10 · Major
- Chance of severe wind over 30 yrs
- 80.0%
Air-quality risk 2/10 · Minimal
- Unhealthy air days now
- 1 days/yr
- Unhealthy air days in 30 yrs
- 2 days/yr
Risk factors via First Street. Map © Google.
Why this score? — see what drove the C grade
The composite is a weighted blend of 9 inputs, each scored 0–100. Each bar is that input's sub-score; the figure is the points it added to the 100-point composite (weight × sub-score).
- ARV discount +15.0/15.0
- Cash flow +13.0/30.0
- Appreciation +10.0/10.0
- 1% rule +6.8/10.0
- Livability +4.0/5.0
- DSCR +3.9/10.0
- Rent growth +2.7/5.0
- Condition / age +2.5/5.0
- Schools +1.4/10.0
$98,999
🖨 Deal sheet (PDF) 📄 Offer letter ✓ Due diligence
Listing remarks
Located near the historic Government Hill district, this property offers a great opportunity for homeowners, investors, or developers in one of San Antonio’s growing central areas. The home features 2 bedrooms and 1 full bathroom and can be restored into a comfortable residence or serve as a buy and hold, flip, or development opportunity. The real value is the spacious 7,600 sq ft lot and its development potential. Currently zoned R6, the property allows for the possibility of adding an ADU, creating an opportunity for additional rental income or multigenerational living. The zoning may also present the potential to rezone to R2 to allow for duplex development, making this an attracti
Key facts
- Zoned r6
- Duplex development
- Near the pearl
Tags
Neighborhood map
What this means for you Summary
Snapshot
- This is a 1-bed/1.0-bath single-family listed at $99k.
Deal economics
- At list price, monthly cash flow is $-5 ($-64/yr) — negative.
- To cash-flow at today's rent, offer at most $98k (1.0% below list).
- Meets the 1% rule at list price ($1k rent vs $99k).
- Recommended offer: $96k (3.0% below list) — sets the bar for market timing.
- Cap rate 6.2% vs local median 3.8% in San Antonio — top-decile yield for the area; either an underpriced asset or a hidden risk that comps aren't pricing in. Stress-test before assuming the spread holds.
Location & tenants
- Location reads 80/100 on livability (#31 in TX, #1,616 nationally) — a professional / high-income tenant draw. Strengths: amenities A+, commute A+, cost of living A+; Watch: crime F.
- San Antonio ISD (urban): math 12% / reading 22% proficiency, ranked #805 of 826 in TX (top 98%) — low school quality limits family demand, transient renter base, plan for 1-2y turnover; 80% free/reduced lunch — lower-income household profile, screen leases tightly.
- Zoned schools: Pershing El (math 8% / reading 12%, grade F, #4,259 of 4,322 statewide, top 99%, 303 students, 96% FRL); Davis Middle (math 5% / reading 15%, grade F, #1,641 of 1,662 statewide, top 99%, 545 students, 96% FRL, charter); Houston H S (math 12% / reading 18%, grade F, #1,507 of 1,632 statewide, top 93%, 856 students, 95% FRL) — zoned schools average 96% FRL vs 80% district-wide (16 pts higher); higher-poverty schools than district average — tighter screening recommended.
- Market conditions: Rents flat; 30 active listings in the ZIP; 40 comparable units currently listed for rent nearby; rentals lingering (median 45d on market — plan ~5-8 weeks vacancy on turnover, expect pricing pressure); 52% of comp listings sitting > 30 days — soft ceiling on asking rent; lower-income renter base — watch delinquency; 8,308 units permitted in Bexar County in 2024 (2,506 in 5+ unit buildings).
- At $1,163/mo this rent would consume 52% of the median local household income ($27k/yr) (locally 526% of renters already pay >50% of income on rent) — very limited rent-growth headroom before tenants either downsize or default.
Forward outlook
- In year one you build about $11k of equity ($684 loan paydown + $10k appreciation (10.0% local appreciation)).
- Bexar County population projected at +50% by 2050 — long-run rental-demand tailwind backs the buy-and-hold thesis.
- At projected returns (10.0% appreciation + 0.7% rent growth), your $28k cash investment doubles in ~3 years — after that, you're playing with house money.
- By year 4, paydown + projected appreciation supports a ~$38k cash-out refi (75% LTV) — recoverable capital for the next deal without selling this one.
Negotiation context
- It's been on market 31 days — a 3% lower offer ($96k) is reasonable based on typical stale-listing flexibility.
Risks & watch-outs
- Watch-outs: property tax is 4.4% of price; built in 1948 — expect roof / HVAC / electrical / plumbing capex.
- Climate carrying-cost: severe wind risk, 80% chance of damaging wind over 30y; extreme-heat days projected 7→21/yr by 2055 (HVAC capex compounding) — expect insurance premiums to compound above CPI over the hold.
Questions for the listing agent
- What do current leases actually rent for vs. the listed asking? Can we see a recent rent roll and the last 12 months of T-12 income?
- It's been on market 31 days. Have you received any prior offers? Is the seller open to a 3% concession, seller financing, or rate buy-down credit?
- Built in 1948 — when were the roof, HVAC, electrical panel, plumbing, and water heater last replaced?
- Property tax is high relative to price — has the assessment been appealed recently, and will the sale trigger a re-assessment?
- Is there a deadline driving the sale (1031 exchange, divorce, estate, relocation)? That informs how much negotiation room exists.
- Crime grade is F in this area — have there been break-ins, vandalism, or insurance claims at this property in the last 3 years? What carrier currently insures it and at what premium?
- What's the average days-on-market for RENTAL listings here right now (not sales)? A rising rental-DOM trend means longer vacancies and softer asking-rent achievability than the comps imply.
- What's the recent tenant-quality profile in this submarket — average credit score on applications, eviction rate, late-payment / NSF rate, and stable-employment percentage? A property-management company in the area should have these aggregated.
- How much new for-sale + rental construction is in the pipeline within 1–3 miles? Heavy new supply typically softens prices + rents 12–24 months out; constrained supply supports both.
Investment metrics
- 1% rule
- 1.18% ✓
- Cap rate
- 6.23%
- Cash-on-cash
- -0.23%
- DSCR
- 0.99
- GRM
- 7.1
CMA / ARV
- ARV (on-the-fly)
- $163,200
- Comps found
- 3
Show comp detail 3 sales within ~0.75 mi
| Address | Dist | Beds/Ba | Sqft | Sold | Price | $/sf | Match |
|---|---|---|---|---|---|---|---|
| 1222 Mason St | 0.30mi | 2/2.0 (+1) | 750 (-6%) | 4mo | $223,900 | $299 | 64 |
| 2222 Osburn | 0.49mi | 1/1.0 | 748 (-6%) | 12mo | $99,900 | $134 | 56 |
| 1810 Rogers Ave | 0.48mi | 2/1.0 (+1) | 766 (-4%) | 16mo | $156,000 | $204 | 52 |
Match score weights: distance 35% · size 25% · config 20% · recency 20%. Top-matched comps best support the ARV.
Projected returns pro-forma
10.0% appreciation · 0.7% rent growth · sell at horizon
- IRR
- 23.2%
- Equity multiple
- 2.84×
- Total profit
- $51,109
- Equity at exit
- $89,186
- IRR
- 20.0%
- Equity multiple
- 6.28×
- Total profit
- $146,250
- Equity at exit
- $192,333
Cash invested: $27,720 (down + closing). Projections, not guarantees.
Landlord ↔ Tenant lean methodology
- Overall (STATE)
- 87 Strongly Landlord-Friendly
- State Texas
- 87 Strongly Landlord-Friendly · R+5
- County
- — inherits STATE
- City
- — inherits STATE
ZIP-level market 78208
- Home prices YoY
- 3.2%
- Rents YoY
- 0.7%
- Active inventory
- 30
- Price-to-rent
- 7.1×
Monthly cashflow live
- Estimated rent
- $1,163 high interval (Pro) →
- Mortgage (P&I)
- −$519
- Tax from tax record
- −$364 /mo · $4,368/yr
- Insurance
- −$41
- HOA
- −$0
- Vacancy / Maint / Mgmt
- −$244
- Net cashflow
- $-5
Break-even live
Sensitivity live
| Price | -10% $51 | -5% $23 | +0% $-5 | +5% $-33 | +10% $-61 |
|---|---|---|---|---|---|
| Rent | -10% $-97 | -5% $-51 | +0% $-5 | +5% $41 | +10% $87 |
| Rate | -1.0pp $44 | -0.5pp $20 | base $-5 | +0.5pp $-31 | +1.0pp $-57 |
UW: 25.0% down · 7.5% · 30yr · 1.5% tax · 5.0% vac · 8.0% maint · 8.0% mgmt
Financing live
Cash to close
- Down payment
- $24,750
- Closing costs
- $2,970
- Reserves months
- —
- Total cash needed
- —
Loan-product check · same deal, 3 products live
Conventional
25% down · 7.5% · 30yr
- Down + closing
- —
- Monthly P&I
- —
- Monthly cashflow
- —
- DSCR
- —
- Eligible?
- —
Personal DTI + credit; lowest rate.
DSCR
20% down · 8.5% · 30yr
- Down + closing
- —
- Monthly P&I
- —
- Monthly cashflow
- —
- DSCR
- —
- Eligible?
- —
No personal income docs; deal must DSCR.
Hard money
10% down · 12.0% · 12mo
- Down + closing
- —
- Monthly P&I
- —
- Monthly cashflow
- —
- DSCR
- —
- Eligible?
- —
Short-term bridge; refi at stabilization.
Rent comps 40 comps
| Address | Beds | Baths | Sqft | Rent | $/sqft | DOM | Units | Dist |
|---|---|---|---|---|---|---|---|---|
| 634 Hood St San Antonio, TX | 2.0 | 1.0 | 762 | $1,100 | $1.44 | 45d | 1 | 0.20mi |
| 512 Bee St San Antonio, TX | 2.0 | 1.0 | 672 | $845 | $1.26 | 25d | 1 | 0.37mi |
| 514 Bee St San Antonio, TX | 2.0 | 1.0 | 672 | $895 | $1.33 | 45d | 1 | 0.38mi |
| 2654 Dignowity Ave Unit 102 San Antonio, TX | 2.0 | 1.5 | 980 | $1,450 | $1.48 | 45d | 1 | 0.38mi |
| 601 Coleman St Unit 2 San Antonio, TX | 2.0 | 1.0 | 800 | $950 | $1.19 | 45d | 1 | 0.43mi |
| 923 E Carson St San Antonio, TX | 2.0 | 1.0–2.0 | 859 | $1,821 | $2.12 | 0d | 36 | 0.50mi |
| 925 E Carson St Unit 610 San Antonio, TX | 1.0 | 1.0 | 716 | $1,413 | $1.97 | 0d | 1 | 0.54mi |
| 925 E Carson St Unit 710 San Antonio, TX | 2.0 | 2.0 | 1019 | $1,910 | $1.87 | 0d | 1 | 0.54mi |
| 1010 Locke St Unit 610 San Antonio, TX | 1.0 | 1.0 | 715 | $723 | $1.01 | 0d | 1 | 0.55mi |
| 1010 Locke St Unit 710 San Antonio, TX | 2.0 | 2.0 | 950 | $871 | $0.92 | 0d | 1 | 0.55mi |
| 822 E Carson St Unit 5 San Antonio, TX | 1.0 | 1.0 | 577 | $800 | $1.39 | 45d | 1 | 0.57mi |
| 323 Gabriel San Antonio, TX | 2.0 | 2.0 | 1000 | $1,375 | $1.38 | 25d | 1 | 0.71mi |
| 323 Gabriel Unit 1 201 San Antonio, TX | 2.0 | 2.5 | 1000 | $1,375 | $1.38 | 45d | 1 | 0.71mi |
| 1017 N Mittman St San Antonio, TX | 1.0 | 1.0 | 726 | $910 | $1.25 | 45d | 1 | 0.73mi |
| 819 Larry San Antonio, TX | 2.0 | 1.0 | 688 | $1,149 | $1.67 | 45d | 1 | 0.74mi |
| 414 Rotary San Antonio, TX | 2.0 | 1.0 | 624 | $1,095 | $1.75 | 45d | 1 | 0.74mi |
| 1411 Lamar St San Antonio, TX | 2.0 | 1.0 | 700 | $1,125 | $1.61 | 45d | 1 | 0.78mi |
| 1223 N Walters St Unit 710 San Antonio, TX | 2.0 | 2.0 | 970 | $1,039 | $1.07 | 0d | 1 | 0.79mi |
| 1223 N Walters St Unit 610 San Antonio, TX | 1.0 | 1.0 | 732 | $869 | $1.19 | 0d | 1 | 0.79mi |
| 1323 Lamar St #1 San Antonio, TX | 2.0 | 1.0 | 900 | $999 | $1.11 | 45d | 1 | 0.80mi |
| 1219 Muncey San Antonio, TX | 2.0 | 2.0 | 944 | $1,350 | $1.43 | 25d | 1 | 0.80mi |
| 1121 Willow St San Antonio, TX | 2.0 | 1.0 | 900 | $1,000 | $1.11 | 45d | 1 | 0.91mi |
| 1810 Burnet St San Antonio, TX | 2.0 | 1.0 | 620 | $1,045 | $1.69 | 16d | 1 | 0.92mi |
| 2142 Lamar St San Antonio, TX | 2.0 | 1.0 | 900 | $1,100 | $1.22 | 45d | 1 | 0.92mi |
| 216 Lucas St Unit 8 San Antonio, TX | 1.0 | 1.0 | 565 | $800 | $1.42 | 45d | 1 | 0.94mi |
| 410 E Carson St Unit 3 San Antonio, TX | 2.0 | 1.5 | 900 | $1,800 | $2.00 | 45d | 1 | 0.95mi |
| 404 E Carson St #2 San Antonio, TX | 1.0 | 1.0 | 697 | $1,625 | $2.33 | 45d | 1 | 0.96mi |
| 1722 N Pine St Unit 2 San Antonio, TX | 1.0 | 1.0 | 636 | $800 | $1.26 | 25d | 1 | 0.97mi |
| 710 Poinsettia San Antonio, TX | 2.0 | 1.0 | 708 | $1,195 | $1.69 | 0d | 1 | 0.98mi |
| 710 Poinsettia San Antonio, TX | 2.0 | 1.0 | 708 | $1,195 | $1.69 | 45d | 1 | 0.98mi |
| 208 Victor St Unit 13 San Antonio, TX | 1.0 | 1.0 | 545 | $575 | $1.06 | 19d | 1 | 0.99mi |
| 307 Victor St San Antonio, TX | 2.0 | 1.0 | 612 | $1,000 | $1.63 | 25d | 1 | 0.99mi |
| 322 Andrews St Unit B San Antonio, TX | 2.0 | 1.0 | 850 | $1,900 | $2.24 | 45d | 1 | 1.00mi |
| 322 Andrews St Unit A San Antonio, TX | 2.0 | 1.0 | 850 | $1,900 | $2.24 | 45d | 1 | 1.00mi |
| 831 E Grayson St San Antonio, TX | 2.0 | 1.0 | 787 | $874 | $1.11 | 16d | 4 | 1.00mi |
| 209 Victor St San Antonio, TX | 1.0–2.0 | 1.0 | 620 | $575 | $0.93 | 25d | 2 | 1.01mi |
| 947 Poinsettia San Antonio, TX | 1.0 | 1.0 | 564 | $595 | $1.05 | 45d | 1 | 1.02mi |
| 1908 Nolan St San Antonio, TX | 2.0 | 1.0 | 836 | $1,049 | $1.25 | 0d | 1 | 1.02mi |
| 928 Poinsettia St San Antonio, TX | 2.0 | 1.0 | 675 | $990 | $1.47 | 45d | 1 | 1.02mi |
| 819 E Grayson St San Antonio, TX | 1.0–2.0 | 1.0 | 825 | $825 | $1.00 | 25d | 4 | 1.03mi |
Listing history 2 events
-
2026-04-09status Pending
-
2026-03-09$98,999 Active
ⓘ Source: listings_history table (triggers on properties + properties_extension) + one-shot
backfill from property_details.listing_events for pre-trigger history.
Tax reassessment forecast TX · Resets to sale price
- Current annual tax
- $4,368 · $364/mo
- Projected year-2 tax
- $4,368 · $364/mo
- Expected delta
- $0/yr ($0/mo · 0.0%)
ⓘ Screening estimate from a state-policy table — verify with the county assessor before closing.
Climate risk First Street
- Flood 1/10 Low FEMA zone X (unshaded) · 0% chance over 30 yrs
- Wildfire 1/10 Low
- Heat 8/10 Severe 7 d/yr ≥108°F today · 21 d/yr by 30 yrs out
- Wind 8/10 Severe 80% chance of damaging wind over 30 yrs
- Air quality 2/10 Low 1 unhealthy d/yr today · 2 by 30 yrs out
Nearby sold comps map
Loading sold comps map…
Walkable amenities ~0.75 mi
Loading nearby amenities…
Taxation est. · year 1
- Rental income
- $13,960
- − Mortgage interest
- −$5,545
- − Property taxes
- −$4,368
- − Insurance
- −$495
- − Repairs & maintenance
- −$1,117
- − Management
- −$1,117
- − Depreciation
- −$2,880
- Taxable loss
- −$1,562
- Est. tax savings @ 24.0%
- +$375
- After-tax cash flow
- $310/yr
For passive investors: Depreciation is non-cash, so a rental often shows a tax loss while cash-flowing — sheltering income. Rental losses are passive: they offset passive income freely, and up to $25,000/yr can offset ordinary (W-2) income if you actively participate and your MAGI is under $100k (phasing out to $0 by $150k); unused losses carry forward. On sale, claimed depreciation is recaptured at up to 25%, and gains may owe capital-gains tax (a 1031 exchange can defer both). Figures are a year-1 estimate at your 24.0% rate — not tax advice; consult a CPA.
Schools (NCES district)
- District
- San Antonio ISD
- NCES district ID
- 4838730
- Math proficiency
- 12% ▼ -21.00%
- Reading proficiency
- 22% ▼ -7.00%
- Median HH income
- $30,952
- Composite
- 13.57/100
- National rank
- #9512
- State rank
- #805 of 826 in TX
Livability — San Antonio
- Score
- 80/100
- State rank
- #31
- US rank
- #1616
Category grades
Schools grade is shown separately in the Schools card above.
Census & demographics
- Census place
- San Antonio, TX
- County
- Bexar County · 1,990,555 people
- City population
- 1,806,925
- Metro
- San Antonio-New Braunfels, TX
- Population (ZIP)
- 3,861
- Household income
- $26,595
- Rent vs Own
- Severe rent burden
- 526.0
Population outlook (Bexar County) Hauer SSP2
- Today (2025)
- 2,336,851 people
- By 2030
- 2,560,728 · +9.6%
- By 2040
- 3,020,569 · +29.3%
- By 2050
- 3,493,522 · +49.5%
- By 2075
- 4,668,459 · +99.8%
- By 2100
- 5,533,242 · +136.8%
Race, ethnicity, and origin ACS 2023
- Neighborhood character
- Majority Hispanic (63%)
- Race & ethnicity
- Hispanic / Latino 63% Black 25% Two or more races 22% White 10%
- Hispanic origin (detail)
- Mexican 55%
- Common ancestry
- Serbian 1% Romanian 1% Lithuanian 1%
- Foreign-born
- 10% · Canada, Jamaica
- Languages at home
- 69% English-only · Spanish 30% Russian/Polish/Slavic 1%
Political lean MEDSL · Bexar
- 2024 margin
- Lean D (+9.8) · D 54.3% · R 44.6% · Other 1.1%
- 2008→2024 swing
- +4.2pp toward D · 2008: 5.6pp · 2024: 9.8pp
- All cycles
- 2024: D+9.8 2020: D+18.2 2016: D+13.5 2012: D+4.6 2008: D+5.6
Not yet ingested
- Civics
- —
Market trends
- HPI YoY
- ▲ 13.53%
- Current HPI
- 432.482
- Rent YoY
- ▲ 0.70%
- Metro
- San Antonio-New Braunfels, TX
- State GDP YoY
- ▲ 3.95%
- F500 in state
- 110
Industry mix (Fortune 500 HQ in TX)
| Industry | F500 HQs | Revenue |
|---|---|---|
| Energy | 16 | $1,198B |
|
||
| Technology | 5 | $198B |
|
||
| Engineering / Construction | 4 | $72B |
|
||
| Energy Services | 3 | $60B |
|
||
| Utilities | 3 | $41B |
|
||
| Healthcare | 2 | $330B |
|
||
Price history
2 events — show timeline
- 2026-04-09 Pending — HARMLS
- 2026-03-09 Listed $98,999 HARMLS
Property tax history
+11.3%/yrLatest (2025): $4,368 · +94.2% YoY. Source: county tax records.
Cash-flow waterfall
monthlySold comps — $/sqft
last 12 mo · ≤1 miLoading sold comps…