707 Hamilton St · New Smyrna Beach, FL
Flood risk 6/10 · Moderate
- FEMA flood zone
- X (shaded)
- Chance of flooding over 30 yrs
- 0.56%
- Est. flood insurance / yr
- $507 – $1,088
Fire risk 3/10 · Minor
- Est. fire insurance / yr
- $947 – $1,759
Heat risk 9/10 · Severe
- Hot days now (above 105°F)
- 7 days/yr
- Hot days in 30 yrs
- 19 days/yr
Wind risk 10/10 · Severe
- Chance of severe wind over 30 yrs
- 99.0%
Air-quality risk 2/10 · Minimal
- Unhealthy air days now
- 1 days/yr
- Unhealthy air days in 30 yrs
- 1 days/yr
Risk factors via First Street. Map © Google.
Why this score? — see what drove the F grade
The composite is a weighted blend of 9 inputs, each scored 0–100. Each bar is that input's sub-score; the figure is the points it added to the 100-point composite (weight × sub-score).
- Cash flow +7.6/30.0
- ARV discount +7.5/15.0
- Rent growth +3.9/5.0
- Schools +3.9/10.0
- Livability +3.5/5.0
- Condition / age +2.5/5.0
- 1% rule +2.2/10.0
- DSCR +1.7/10.0
- Appreciation +0.0/10.0
$325,000
🖨 Deal sheet (PDF) 📄 Offer letter ✓ Due diligence
Listing remarks MLS
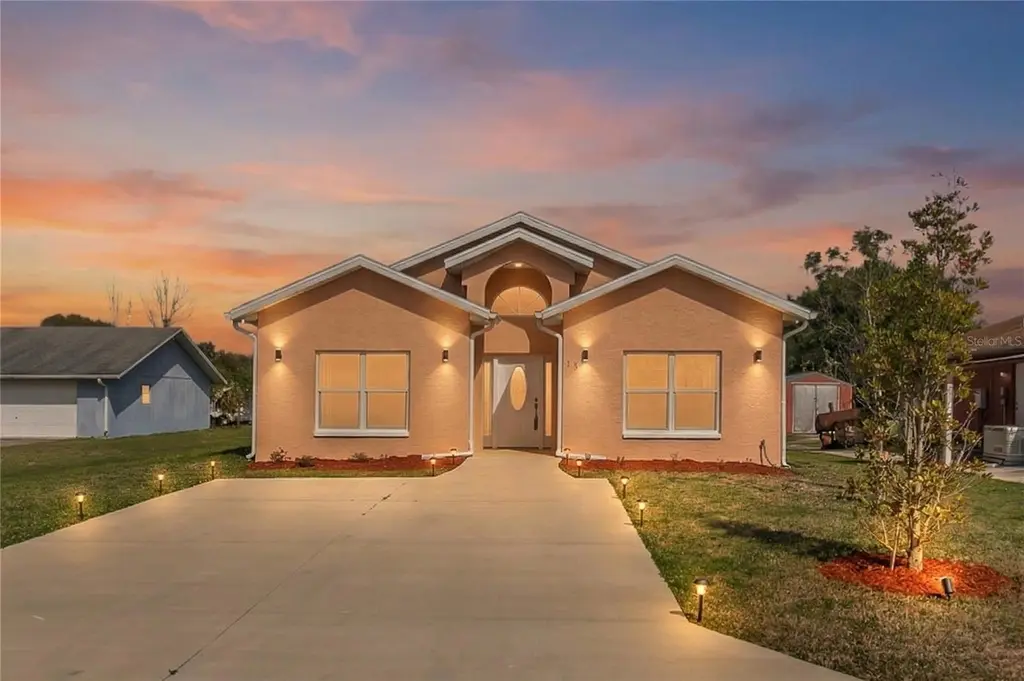
Welcome to 707 Hamilton Street, a beautifully crafted NEW CONSTRUCTION home completed in 2025, ideally located in the heart of New Smyrna Beach with NO HOA! This thoughtfully designed 3-bedroom, 2-bath residence offers a bright, open floorplan that seamlessly blends modern style with everyday functionality. The spacious living area flows effortlessly into the kitchen, which comes fully equipped with all appliances - making this home truly move-in ready. The primary suite serves as a private retreat, featuring a large bedroom, walk-in closet, and a well-appointed en suite bathroom. Both bathrooms include dual sinks, adding convenience and a touch of luxury to daily routines. Modern lighting fixtures throughout the home enhance its clean, contemporary feel. Situated on a generous lot, the property provides ample outdoor space for you to enjoy the Florida sunshine year-round, along with a large driveway offering plenty of parking. Whether you’re looking for a primary residence, second home, or investment opportunity, this home offers the perfect combination of new construction, no HOA, and a prime coastal location just minutes from the beach, shopping, and dining. Don’t miss your chance to own a brand-new home in one of Florida’s most sought-after beach communities. .. . SCHEDULE YOUR PRIVATE TOUR TODAY! * * * * All information pertaining to the property is deemed reliable, but not guaranteed. Information to be verified by the Buyer. Be advised that cameras may exist recording audio and video inside/outside the property, such as ring doorbells. Photos are digitally enhanced and could be altered, please verify. * * * *
Key facts
- Large driveway
- Generous lot
- New construction
Tags
Neighborhood map
What this means for you Summary
Snapshot
- This is a 3-bed/2.0-bath land listed at $325k.
Deal economics
- At list price, monthly cash flow is $-389 ($-5k/yr) — negative.
- To cash-flow at today's rent, offer at most $269k (17.3% below list).
- To meet the 1% rule (rent ≥ 1% of price), the offer needs to be $235k (27.7% below list).
- Recommended offer: $235k (27.7% below list) — sets the bar for 1% rule.
Location & tenants
- Location reads 69/100 on livability (#474 in FL) — a middle-class / working-renter tenant base. Strengths: crime A+, housing A+, employment B; Watch: amenities F, commute F, health & safety D-.
- Volusia (suburban): math 44% / reading 49% proficiency, ranked #47 of 73 in FL (top 64%) — families likely to look elsewhere, expect single-tenant / working-renter base with shorter leases.
- Market conditions: Rents rising fast (+5.6%/yr); 601 active listings in the ZIP; 12 comparable units currently listed for rent nearby; rentals at typical pace (median 24d on market — plan ~3-4 weeks tenant-placement turnaround); solid renter incomes; 3,402 units permitted in Volusia County in 2024 (681 in 5+ unit buildings).
- This rent runs 37% of the median local income ($77k/yr) — at the standard rent-burdened threshold; future hikes will face affordability resistance.
Forward outlook
- Local home prices are declining (-3.0%/yr); year-one equity from $2k of loan paydown is wiped out by about $10k of value loss. Plan a longer hold.
- Volusia County population projected at +19% by 2050 — long-run rental-demand tailwind backs the buy-and-hold thesis.
Negotiation context
- It's been on market 76 days — a 6% lower offer ($306k) is reasonable based on typical stale-listing flexibility.
- 8 sale attempts since 9y ago with the ask held roughly flat each time — persistent listings suggest the price (not the market) is what's stuck; bring a comps-based counter.
- Current owner paid $25k; list at $325k implies a 1200% gain — meaningful room to come down on a strong offer.
Risks & watch-outs
- Climate carrying-cost: major flood risk; severe wind risk, 99% chance of damaging wind over 30y; extreme-heat days projected 7→19/yr by 2055 (HVAC capex compounding) — expect insurance premiums to compound above CPI over the hold.
Questions for the listing agent
- What do current leases actually rent for vs. the listed asking? Can we see a recent rent roll and the last 12 months of T-12 income?
- It's been on market 76 days. Have you received any prior offers? Is the seller open to a 28% concession, seller financing, or rate buy-down credit?
- Why hasn't it sold? Are there any deal-killer items the seller is aware of (foundation, flood, title, zoning, code violations)?
- Is there a deadline driving the sale (1031 exchange, divorce, estate, relocation)? That informs how much negotiation room exists.
- Schools are B-rated — typically a magnet for longer-tenancy family renters. What's the average tenant stay here, and is there a school-zone premium baked into asking?
- The area grade is low — what's the realistic commute time and amenity access for the typical tenant pool here? Any planned neighborhood developments (good or bad) we should know about?
- What's the average days-on-market for RENTAL listings here right now (not sales)? A rising rental-DOM trend means longer vacancies and softer asking-rent achievability than the comps imply.
- What's the recent tenant-quality profile in this submarket — average credit score on applications, eviction rate, late-payment / NSF rate, and stable-employment percentage? A property-management company in the area should have these aggregated.
- How much new for-sale + rental construction is in the pipeline within 1–3 miles? Heavy new supply typically softens prices + rents 12–24 months out; constrained supply supports both.
Investment metrics
- 1% rule
- 0.72% ✗
- Cap rate
- 4.86%
- Cash-on-cash
- -5.13%
- DSCR
- 0.77
- GRM
- 11.5
CMA / ARV
No comps found within radius.
Projected returns pro-forma
-3.0% appreciation · 5.6% rent growth · sell at horizon
- IRR
- -22.2%
- Equity multiple
- 0.22×
- Total profit
- $-71,110
- Equity at exit
- $48,459
- IRR
- -10.9%
- Equity multiple
- 0.27×
- Total profit
- $-66,395
- Equity at exit
- $28,100
Cash invested: $91,000 (down + closing). Projections, not guarantees.
Landlord ↔ Tenant lean methodology
- Overall (STATE)
- 87 Strongly Landlord-Friendly
- State Florida
- 87 Strongly Landlord-Friendly · R+3
- County
- — inherits STATE
- City
- — inherits STATE
ZIP-level market 32168
- Home prices YoY
- -27.0%
- Rents YoY
- 5.6%
- Active inventory
- 601
- Price-to-rent
- 11.5×
Monthly cashflow live
- Estimated rent
- $2,350 high interval (Pro) →
- Mortgage (P&I)
- −$1,704
- Tax est. 1.5%
- −$406 /mo · $4,875/yr
- Insurance
- −$135
- HOA
- −$0
- Vacancy / Maint / Mgmt
- −$494
- Net cashflow
- $-389
Break-even live
Sensitivity live
| Price | -10% $-165 | -5% $-277 | +0% $-389 | +5% $-502 | +10% $-614 |
|---|---|---|---|---|---|
| Rent | -10% $-575 | -5% $-482 | +0% $-389 | +5% $-296 | +10% $-204 |
| Rate | -1.0pp $-226 | -0.5pp $-307 | base $-389 | +0.5pp $-473 | +1.0pp $-559 |
UW: 25.0% down · 7.5% · 30yr · 1.5% tax · 5.0% vac · 8.0% maint · 8.0% mgmt
Financing live
Cash to close
- Down payment
- $81,250
- Closing costs
- $9,750
- Reserves months
- —
- Total cash needed
- —
Loan-product check · same deal, 3 products live
Conventional
25% down · 7.5% · 30yr
- Down + closing
- —
- Monthly P&I
- —
- Monthly cashflow
- —
- DSCR
- —
- Eligible?
- —
Personal DTI + credit; lowest rate.
DSCR
20% down · 8.5% · 30yr
- Down + closing
- —
- Monthly P&I
- —
- Monthly cashflow
- —
- DSCR
- —
- Eligible?
- —
No personal income docs; deal must DSCR.
Hard money
10% down · 12.0% · 12mo
- Down + closing
- —
- Monthly P&I
- —
- Monthly cashflow
- —
- DSCR
- —
- Eligible?
- —
Short-term bridge; refi at stabilization.
Rent comps 12 comps
| Address | Beds | Baths | Sqft | Rent | $/sqft | DOM | Units | Dist |
|---|---|---|---|---|---|---|---|---|
| 907 Hamilton St New Smyrna Beach, FL | 3.0 | 2.0 | 1336 | $2,085 | $1.56 | 12d | 1 | 0.16mi |
| 700 Green Rd New Smyrna Beach, FL | 4.0 | 2.0 | 1705 | $1,995 | $1.17 | 12d | 1 | 0.33mi |
| 618 N Duss St New Smyrna Beach, FL | 3.0 | 2.0 | 1500 | $1,999 | $1.33 | 19d | 1 | 0.34mi |
| 554 Ronnoc Ln New Smyrna Beach, FL | 3.0 | 3.0 | 1762 | $2,800 | $1.59 | 24d | 1 | 0.47mi |
| 7 Birdie Dr New Smyrna Beach, FL | 2.0 | 2.0 | 1046 | $2,600 | $2.49 | 24d | 1 | 0.77mi |
| 14 Birdie Dr New Smyrna Beach, FL | 2.0 | 2.0 | 1060 | $1,775 | $1.67 | 24d | 1 | 0.77mi |
| 1054 Claudia St New Smyrna Beach, FL | 2.0 | 2.0 | 1005 | $1,750 | $1.74 | 24d | 1 | 0.78mi |
| 331 Citrus Open Dr New Smyrna Beach, FL | 3.0 | 2.0 | 1820 | $2,600 | $1.43 | 24d | 1 | 0.96mi |
| 527 Terriere Way New Smyrna Beach, FL | 3.0 | 2.0 | 1490 | $2,400 | $1.61 | 12d | 1 | 0.96mi |
| 2 Riverwalk Dr #202 New Smyrna Beach, FL | 2.0 | 2.0 | 1384 | $3,200 | $2.31 | 24d | 1 | 1.12mi |
| 159 Breezeway Ct #159 New Smyrna Beach, FL | 2.0 | 2.0 | 967 | $2,900 | $3.00 | 24d | 1 | 1.26mi |
| 464 Judy St New Smyrna Beach, FL | 3.0 | 1.5 | 1550 | $2,400 | $1.55 | 15d | 1 | 1.36mi |
Listing history 36 events
-
2026-06-18days on market $325,000 Active 76 DOM
-
2026-06-17days on market $325,000 Active 75 DOM
-
2026-06-16days on market $325,000 Active 74 DOM
-
2026-06-15days on market $325,000 Active 73 DOM
-
2026-06-14days on market $325,000 Active 71 DOM
-
2026-06-10days on market $325,000 Active 68 DOM
-
2026-06-09days on market $325,000 Active 67 DOM
-
2026-06-08days on market $325,000 Active 66 DOM
-
2026-06-07days on market $325,000 Active 65 DOM
-
2026-06-05days on market $325,000 Active 62 DOM
-
2026-06-03days on market $325,000 Active 61 DOM
-
2026-06-03days on market $325,000 Active 60 DOM
-
2026-06-01days on market $325,000 Active 59 DOM
-
2026-05-31days on market $325,000 Active 58 DOM
-
2026-05-31days on market $325,000 Active 57 DOM
-
2026-04-03$325,000 Active 1670-char remark
Show marketing remark (1670 chars)
Welcome to 707 Hamilton Street, a beautifully crafted NEW CONSTRUCTION home completed in 2025, ideally located in the heart of New Smyrna Beach with NO HOA! This thoughtfully designed 3-bedroom, 2-bath residence offers a bright, open floorplan that seamlessly blends modern style with everyday functionality. The spacious living area flows effortlessly into the kitchen, which comes fully equipped with all appliances - making this home truly move-in ready. The primary suite serves as a private retreat, featuring a large bedroom, walk-in closet, and a well-appointed en suite bathroom. Both bathrooms include dual sinks, adding convenience and a touch of luxury to daily routines. Modern lighting fixtures throughout the home enhance its clean, contemporary feel. Situated on a generous lot, the property provides ample outdoor space for you to enjoy the Florida sunshine year-round, along with a large driveway offering plenty of parking. Whether you’re looking for a primary residence, second home, or investment opportunity, this home offers the perfect combination of new construction, no HOA, and a prime coastal location just minutes from the beach, shopping, and dining. Don’t miss your chance to own a brand-new home in one of Florida’s most sought-after beach communities. .. . SCHEDULE YOUR PRIVATE TOUR TODAY! * * * * All information pertaining to the property is deemed reliable, but not guaranteed. Information to be verified by the Buyer. Be advised that cameras may exist recording audio and video inside/outside the property, such as ring doorbells. Photos are digitally enhanced and could be altered, please verify. * * * *
-
2025-10-31historical
-
2025-08-26price $315,000
-
2025-08-26price $315,000
-
2025-07-01status Active
-
2025-07-01status Active
-
2025-06-09status Pending
-
2025-06-09status Pending
-
2025-06-09historical
-
2025-05-12$325,000 Active
-
2025-05-07$325,000 Active
-
2020-08-13soldstatus $25,000 Closed
-
2020-07-16historical Contingent
-
2020-02-16$31,900 Active
-
2018-01-24soldstatus $16,500 Closed
-
2017-11-17historical Contingent
-
2017-11-13$17,500 Active
-
2017-11-13historical Withdrawn
-
2017-08-11price
-
2017-03-05Active
-
1995-02-27soldstatus $5,000
ⓘ Source: listings_history table (triggers on properties + properties_extension) + one-shot
backfill from property_details.listing_events for pre-trigger history.
Climate risk First Street
- Flood 6/10 Major FEMA zone X (shaded) · 56% chance over 30 yrs
- Wildfire 3/10 Moderate
- Heat 9/10 Extreme 7 d/yr ≥105°F today · 19 d/yr by 30 yrs out
- Wind 10/10 Extreme 99% chance of damaging wind over 30 yrs
- Air quality 2/10 Low 1 unhealthy d/yr today · 1 by 30 yrs out
Nearby sold comps map
Loading sold comps map…
Walkable amenities ~0.75 mi
Loading nearby amenities…
Taxation est. · year 1
- Rental income
- $28,204
- − Mortgage interest
- −$18,205
- − Property taxes
- −$4,875
- − Insurance
- −$1,625
- − Repairs & maintenance
- −$2,256
- − Management
- −$2,256
- − Depreciation
- −$9,455
- Taxable loss
- −$10,468
- Est. tax savings @ 24.0%
- +$2,512
- After-tax cash flow
- $-2,158/yr
For passive investors: Depreciation is non-cash, so a rental often shows a tax loss while cash-flowing — sheltering income. Rental losses are passive: they offset passive income freely, and up to $25,000/yr can offset ordinary (W-2) income if you actively participate and your MAGI is under $100k (phasing out to $0 by $150k); unused losses carry forward. On sale, claimed depreciation is recaptured at up to 25%, and gains may owe capital-gains tax (a 1031 exchange can defer both). Figures are a year-1 estimate at your 24.0% rate — not tax advice; consult a CPA.
Schools (NCES district)
- District
- Volusia
- NCES district ID
- 1201920
- Math proficiency
- 44% ▼ -9.00%
- Reading proficiency
- 49% ▼ -3.00%
- Median HH income
- $42,946
- Composite
- 39.2/100
- National rank
- #4019
- State rank
- #47 of 73 in FL
Livability — New Smyrna Beach
- Score
- 69/100
- State rank
- #474
- US rank
- #8577
Category grades
Schools grade is shown separately in the Schools card above.
Census & demographics
- Census place
- New Smyrna Beach, FL
- County
- Volusia County · 556,871 people
- City population
- 42,039
- Metro
- Deltona-Daytona Beach-Ormond Beach, FL
- Population (ZIP)
- 31,847
- Household income
- $77,083
- Rent vs Own
- Severe rent burden
- 1139.0
Population outlook (Volusia County) Hauer SSP2
- Today (2025)
- 572,749 people
- By 2030
- 598,695 · +4.5%
- By 2040
- 644,880 · +12.6%
- By 2050
- 681,451 · +19.0%
- By 2075
- 759,957 · +32.7%
- By 2100
- 778,902 · +36.0%
Race, ethnicity, and origin ACS 2023
- Neighborhood character
- Predominantly White (85%)
- Race & ethnicity
- White 85% Hispanic / Latino 6% Black 5% Two or more races 4%
- Hispanic origin (detail)
- Mexican 2% Puerto Rican 1%
- Common ancestry
- Romanian 4% Italian 3% Lithuanian 2%
- Foreign-born
- 5% · Canada, Vietnam
- Languages at home
- 93% English-only · Spanish 5% Other Indo-European 1%
Political lean MEDSL · Volusia
- 2024 margin
- Strong R (+21.8) · D 38.7% · R 60.5%
- 2008→2024 swing
- -27.4pp toward R · 2008: 5.7pp · 2024: -21.8pp
- All cycles
- 2024: R+21.8 2020: R+14.1 2016: R+13.1 2012: R+1.2 2008: D+5.7
Not yet ingested
- Civics
- —
Market trends
- HPI YoY
- ▼ -129.58%
- Current HPI
- 350.4259
- Rent YoY
- ▲ 5.60%
- Metro
- Deltona-Daytona Beach-Ormond Beach, FL
- State GDP YoY
- ▲ 3.28%
- F500 in state
- 36
Industry mix (Fortune 500 HQ in FL)
| Industry | F500 HQs | Revenue |
|---|---|---|
| Industrial Technology | 2 | $29B |
|
||
| Insurance | 2 | $17B |
|
||
| Retail | 1 | $60B |
|
||
| Technology Distribution | 1 | $58B |
|
||
| Homebuilding | 1 | $35B |
|
||
| Technology Manufacturing | 1 | $35B |
|
||
Price history
+6400.0% since first listed21 events — show timeline
- 2026-04-03 Listed $325,000 Stellar MLS as Distributed by MLS Grid
- 2025-10-31 Listing Removed — Stellar MLS as Distributed by MLS Grid
- 2025-08-26 Price Changed $315,000 Daytona MLS
- 2025-08-26 Price Changed $315,000 Stellar MLS as Distributed by MLS Grid
- 2025-07-01 Relisted — Daytona MLS
- 2025-07-01 Relisted — Stellar MLS as Distributed by MLS Grid
- 2025-06-09 Pending — Stellar MLS as Distributed by MLS Grid
- 2025-06-09 Pending — Daytona MLS
- 2025-06-09 Listing Removed — Daytona MLS
- 2025-05-12 Listed $325,000 Daytona MLS
- 2025-05-07 Listed $325,000 Stellar MLS as Distributed by MLS Grid
- 2020-08-13 Sold (MLS) $25,000 NSBMLS
- 2020-07-16 Contingent — NSBMLS
- 2020-02-16 Listed $31,900 NSBMLS
- 2018-01-24 Sold (MLS) $16,500 NSBMLS
- 2017-11-17 Contingent — NSBMLS
- 2017-11-13 Listed $17,500 NSBMLS
- 2017-11-13 Delisted — NSBMLS
- 2017-08-11 Price Changed — NSBMLS
- 2017-03-05 Listed — NSBMLS
- 1995-02-27 Sold (Public Records) $5,000 Public Records
Property tax history
+8.3%/yrLatest (2025): $494 · +47.0% YoY. Source: county tax records.
Cash-flow waterfall
monthlySold comps — $/sqft
last 12 mo · ≤1 miLoading sold comps…