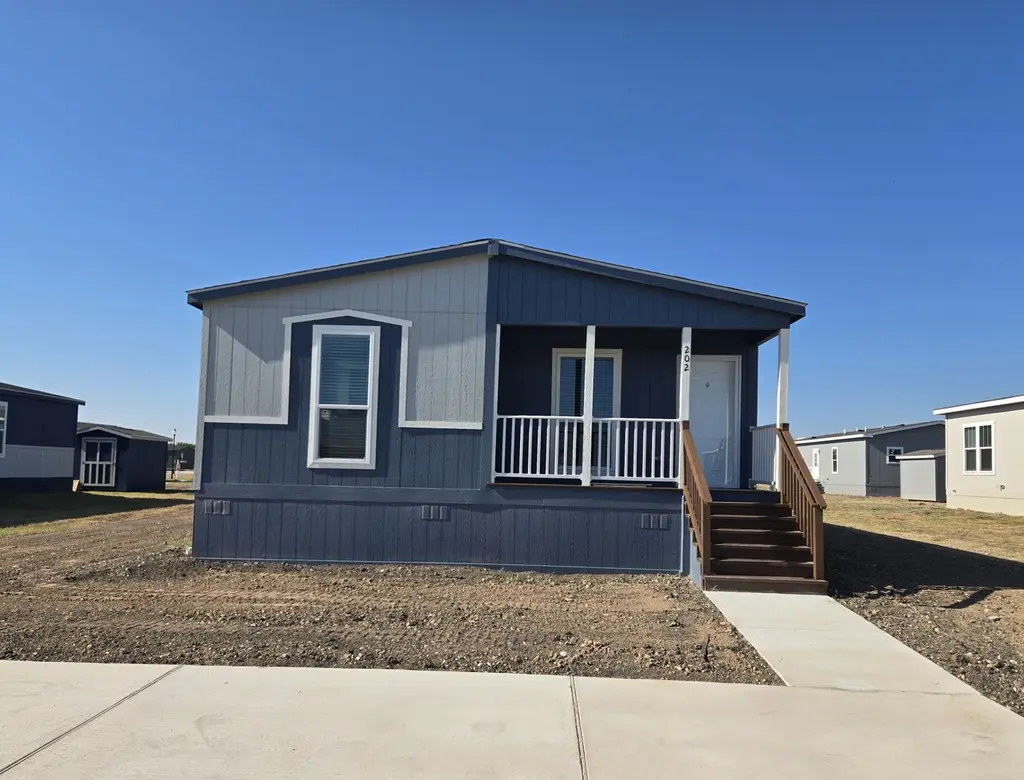
202 Saddle Ranch Drive Plan · Kyle, TX
Flood risk 1/10 · Minimal
- FEMA flood zone
- X (unshaded)
- Chance of flooding over 30 yrs
- 0.0%
- Est. flood insurance / yr
- $507 – $1,088
Fire risk 4/10 · Minor
- Est. fire insurance / yr
- $1,222 – $2,270
Heat risk 8/10 · Major
- Hot days now (above 108°F)
- 7 days/yr
- Hot days in 30 yrs
- 23 days/yr
Wind risk 8/10 · Major
- Chance of severe wind over 30 yrs
- 80.0%
Air-quality risk 1/10 · Minimal
- Unhealthy air days now
- 0 days/yr
- Unhealthy air days in 30 yrs
- 0 days/yr
Risk factors via First Street. Map © Google.
Why this score? — see what drove the B grade
The composite is a weighted blend of 9 inputs, each scored 0–100. Each bar is that input's sub-score; the figure is the points it added to the 100-point composite (weight × sub-score).
- Cash flow +30.0/30.0
- 1% rule +10.0/10.0
- DSCR +10.0/10.0
- ARV discount +7.5/15.0
- Condition / age +4.0/5.0
- Livability +3.8/5.0
- Schools +3.5/10.0
- Rent growth +2.4/5.0
- Appreciation +0.0/10.0
$119,995
🖨 Deal sheet (PDF) 📄 Offer letter ✓ Due diligence
Listing remarks MLS
This Champion model home delivers a generous 4-bedroom, 2-bath layout perfect for big families or anyone needing extra space. With an open kitchen, roomy living area, and private bedrooms, this home gives you plenty of room! Kitchen features a large island perfect for hosting. Call us today to schedule a tour of this beautiful home! * All home series, floor plans, specifications, dimensions, features, materials, pricing and availability shown on this website are subject to change.
Key facts
- Listed 253 days
Neighborhood map
What this means for you Summary
Snapshot
- This is a 4-bed/2.0-bath manufactured listed at $120k. Condition is rated good.
Deal economics
- At list price, monthly cash flow is $719 ($9k/yr) — positive.
- The deal already cash-flows at list — no discount required.
- Meets the 1% rule at list price ($2k rent vs $120k).
- Recommended offer: $106k (12.0% below list) — sets the bar for market timing.
- Cap rate 13.5% vs local median 3.3% in Kyle — top-decile yield for the area; either an underpriced asset or a hidden risk that comps aren't pricing in. Stress-test before assuming the spread holds.
Location & tenants
- Location reads 75/100 on livability (#138 in TX, #3,993 nationally) — a middle-class / working-renter tenant base. Strengths: housing A+, health & safety A+, employment A; Watch: amenities F, commute F.
- Hays CISD (rural): math 35% / reading 41% proficiency, ranked #390 of 826 in TX (top 47%) — families likely to look elsewhere, expect single-tenant / working-renter base with shorter leases.
- Zoned schools: Tobias El (math 40% / reading 46%, grade F, #1,283 of 4,322 statewide, top 30%, 683 students, 52% FRL); Laura B Wallace Middle (math 31% / reading 34%, grade F, #947 of 1,662 statewide, top 58%, 789 students, 53% FRL); Lehman H S (math 20% / reading 32%, grade F, #1,234 of 1,632 statewide, top 76%, 2,120 students, 59% FRL).
- Market conditions: Rents soft (-0.3%/yr); 1820 active listings in the ZIP; 40 comparable units currently listed for rent nearby; rentals at typical pace (median 20d on market — plan ~3-4 weeks tenant-placement turnaround); solid renter incomes; 5,270 units permitted in Hays County in 2024 (1,464 in 5+ unit buildings).
Forward outlook
- Local home prices are declining (-3.0%/yr); year-one equity from $829 of loan paydown is wiped out by about $4k of value loss. Plan a longer hold.
- Hays County population projected at +93% by 2050 — long-run rental-demand tailwind backs the buy-and-hold thesis.
- At projected returns (-3.0% appreciation + 0.0% rent growth), your $34k cash investment doubles in ~6 years — after that, you're playing with house money.
Negotiation context
- It's been on market 253 days — a 12% lower offer ($106k) is reasonable based on typical stale-listing flexibility.
Risks & watch-outs
- Climate carrying-cost: severe wind risk, 80% chance of damaging wind over 30y; extreme-heat days projected 7→23/yr by 2055 (HVAC capex compounding) — expect insurance premiums to compound above CPI over the hold.
Questions for the listing agent
- It's been on market 253 days. Have you received any prior offers? Is the seller open to a 12% concession, seller financing, or rate buy-down credit?
- Why hasn't it sold? Are there any deal-killer items the seller is aware of (foundation, flood, title, zoning, code violations)?
- Is there a deadline driving the sale (1031 exchange, divorce, estate, relocation)? That informs how much negotiation room exists.
- Schools are D-rated, which usually means shorter tenancies and higher turnover. Who's the typical renter profile here, and what's been the actual vacancy rate?
- What's the average days-on-market for RENTAL listings here right now (not sales)? A rising rental-DOM trend means longer vacancies and softer asking-rent achievability than the comps imply.
- What's the recent tenant-quality profile in this submarket — average credit score on applications, eviction rate, late-payment / NSF rate, and stable-employment percentage? A property-management company in the area should have these aggregated.
- How much new for-sale + rental construction is in the pipeline within 1–3 miles? Heavy new supply typically softens prices + rents 12–24 months out; constrained supply supports both.
Investment metrics
- 1% rule
- 1.63% ✓
- Cap rate
- 13.49%
- Cash-on-cash
- 25.69%
- DSCR
- 2.14
- GRM
- 5.1
CMA / ARV
- ARV (median comp)
- $308,103
- List price
- $119,995
- Delta
- -61.05%
- Verdict
- UNDERPRICED
- Comps
- 2 within 2.0 mi
Projected returns pro-forma
-3.0% appreciation · 0.0% rent growth · sell at horizon
- IRR
- 15.9%
- Equity multiple
- 1.61×
- Total profit
- $20,655
- Equity at exit
- $17,892
- IRR
- 22.2%
- Equity multiple
- 2.63×
- Total profit
- $54,899
- Equity at exit
- $10,375
Cash invested: $33,599 (down + closing). Projections, not guarantees.
Landlord ↔ Tenant lean methodology
- Overall (STATE)
- 87 Strongly Landlord-Friendly
- State Texas
- 87 Strongly Landlord-Friendly · R+5
- County
- — inherits STATE
- City
- — inherits STATE
ZIP-level market 78640
- Home prices YoY
- -33.8%
- Rents YoY
- -0.3%
- Active inventory
- 1820
- Price-to-rent
- 5.1×
Monthly cashflow live
- Estimated rent
- $1,960 high interval (Pro) →
- Mortgage (P&I)
- −$629
- Tax est. 1.5%
- −$150 /mo · $1,800/yr
- Insurance
- −$50
- HOA
- −$0
- Vacancy / Maint / Mgmt
- −$412
- Net cashflow
- $719
Break-even live
Sensitivity live
| Price | -10% $802 | -5% $761 | +0% $719 | +5% $678 | +10% $636 |
|---|---|---|---|---|---|
| Rent | -10% $564 | -5% $642 | +0% $719 | +5% $797 | +10% $874 |
| Rate | -1.0pp $780 | -0.5pp $750 | base $719 | +0.5pp $688 | +1.0pp $657 |
UW: 25.0% down · 7.5% · 30yr · 1.5% tax · 5.0% vac · 8.0% maint · 8.0% mgmt
Financing live
Cash to close
- Down payment
- $29,999
- Closing costs
- $3,600
- Reserves months
- —
- Total cash needed
- —
Loan-product check · same deal, 3 products live
Conventional
25% down · 7.5% · 30yr
- Down + closing
- —
- Monthly P&I
- —
- Monthly cashflow
- —
- DSCR
- —
- Eligible?
- —
Personal DTI + credit; lowest rate.
DSCR
20% down · 8.5% · 30yr
- Down + closing
- —
- Monthly P&I
- —
- Monthly cashflow
- —
- DSCR
- —
- Eligible?
- —
No personal income docs; deal must DSCR.
Hard money
10% down · 12.0% · 12mo
- Down + closing
- —
- Monthly P&I
- —
- Monthly cashflow
- —
- DSCR
- —
- Eligible?
- —
Short-term bridge; refi at stabilization.
Rent comps 40 comps
| Address | Beds | Baths | Sqft | Rent | $/sqft | DOM | Units | Dist |
|---|---|---|---|---|---|---|---|---|
| 526 Harvest Moon Pkwy Kyle, TX | 3.0–4.0 | 2.0–3.0 | 1624 | $1,699 | $1.05 | 3d | 1 | 0.04mi |
| 273 Tower Dr Kyle, TX | 3.0 | 2.0 | 1252 | $1,795 | $1.43 | 19d | 1 | 0.19mi |
| 140 Plum Path Kyle, TX | 4.0 | 2.5 | 1945 | $2,149 | $1.10 | 3d | 1 | 0.25mi |
| 410 Tower Dr Kyle, TX | 3.0 | 2.5 | 1665 | $1,795 | $1.08 | 45d | 1 | 0.27mi |
| 205 Beech Dr Kyle, TX | 3.0 | 2.0 | 1359 | $1,795 | $1.32 | 6d | 1 | 0.29mi |
| 205 Beech Dr Kyle, TX | 3.0 | 2.0 | 1359 | $1,825 | $1.34 | 45d | 1 | 0.29mi |
| 187 Rummel Dr Kyle, TX | 3.0 | 2.0 | 1240 | $1,795 | $1.45 | 45d | 1 | 0.30mi |
| 240 New Country Rd Kyle, TX | 3.0 | 2.0 | 1106 | $1,650 | $1.49 | 3d | 1 | 0.33mi |
| 240 New Country Rd Kyle, TX | 3.0 | 2.0 | 1106 | $1,650 | $1.49 | 13d | 1 | 0.33mi |
| 510 New Bridge Dr Kyle, TX | 4.0 | 2.0 | 1359 | $1,695 | $1.25 | 45d | 1 | 0.35mi |
| 120 Beech Dr Kyle, TX | 3.0 | 2.5 | 2058 | $1,945 | $0.95 | 19d | 1 | 0.36mi |
| 261 New Bridge Dr Kyle, TX | 4.0 | 2.0 | 1368 | $1,849 | $1.35 | 45d | 1 | 0.39mi |
| 270 Sheep Trail Dr Kyle, TX | 3.0 | 2.0 | 1584 | $1,785 | $1.13 | 45d | 1 | 0.42mi |
| 130 Peach Tree Pass Kyle, TX | 3.0 | 2.5 | 2198 | $1,900 | $0.86 | 19d | 1 | 0.46mi |
| 185 Creekside Villa Dr Kyle, TX | 3.0 | 2.5 | 1463 | $1,700 | $1.16 | 16d | 1 | 0.50mi |
| 155 Creekside Villa Dr Kyle, TX | 3.0 | 2.0 | 1266 | $1,695 | $1.34 | 25d | 1 | 0.53mi |
| 155 Creekside Villa Dr Kyle, TX | 3.0 | 2.0 | 1266 | $1,695 | $1.34 | 6d | 1 | 0.53mi |
| 155 Creekside Villa Dr Kyle, TX | 3.0 | 2.0 | 1266 | $1,495 | $1.18 | 16d | 1 | 0.53mi |
| 149 Creekside Villa Dr Kyle, TX | 3.0 | 2.0 | 1266 | $1,495 | $1.18 | 16d | 1 | 0.53mi |
| 850 Bunton Reserve Blvd Kyle, TX | 3.0 | 2.0 | 1109 | $1,800 | $1.62 | 25d | 1 | 0.58mi |
| 1685 Twin Cv Kyle, TX | 3.0 | 2.0 | 1740 | $2,200 | $1.26 | 45d | 1 | 0.58mi |
| 131 Connor Elkins Dr Kyle, TX | 3.0 | 2.0 | 2015 | $2,000 | $0.99 | 6d | 1 | 0.63mi |
| 106 Lakeview Ct Kyle, TX | 3.0 | 2.5 | 1765 | $1,795 | $1.02 | 19d | 1 | 0.63mi |
| 112 Lakeview Ct Kyle, TX | 3.0 | 2.5 | 1765 | $1,795 | $1.02 | 6d | 1 | 0.63mi |
| 1579 Violet Ln Kyle, TX | 3.0 | 2.5 | 1426 | $1,750 | $1.23 | 25d | 1 | 0.71mi |
| 1477 Treeta Trl Kyle, TX | 3.0 | 2.0 | 1560 | $1,759 | $1.13 | 23d | 1 | 0.72mi |
| 1469 Breanna Ln Kyle, TX | 3.0 | 2.0 | 1329 | $1,650 | $1.24 | 19d | 1 | 0.73mi |
| 1437 Treeta Trl Kyle, TX | 3.0 | 2.0 | 1262 | $1,895 | $1.50 | 45d | 1 | 0.77mi |
| 125 Voyager Cv Kyle, TX | 3.0 | 2.0 | 1476 | $1,800 | $1.22 | 45d | 1 | 0.78mi |
| 1628 Arbor Knot Dr Kyle, TX | 3.0 | 2.0 | 1620 | $2,180 | $1.35 | 45d | 1 | 0.87mi |
| 1180 Arbor Knot Dr Kyle, TX | 4.0 | 2.0 | 1822 | $1,999 | $1.10 | 6d | 1 | 0.89mi |
| 355 Evening Star Kyle, TX | 4.0 | 2.0 | 1900 | $2,300 | $1.21 | 45d | 1 | 0.89mi |
| 366 Silver Springs Bnd Kyle, TX | 3.0 | 2.5 | 1909 | $2,145 | $1.12 | 5d | 1 | 0.91mi |
| 521 Bunton Reserve Blvd Kyle, TX | 3.0–4.0 | 2.0–3.0 | 1870 | $2,341 | $1.25 | 0d | 15 | 0.92mi |
| 195 Salt Springs Rd Kyle, TX | 4.0 | 2.0 | 1818 | $2,100 | $1.16 | 19d | 1 | 0.97mi |
| 1441 Star Mdw Kyle, TX | 3.0 | 2.0 | 1607 | $1,900 | $1.18 | 0d | 1 | 1.01mi |
| 208 Discovery Kyle, TX | 3.0 | 2.0 | 1893 | $2,025 | $1.07 | 45d | 1 | 1.03mi |
| 208 Discovery Kyle, TX | 3.0 | 2.0 | 1893 | $1,895 | $1.00 | 0d | 1 | 1.03mi |
| 1187 Amy Dr Kyle, TX | 4.0 | 2.0 | 1904 | $2,100 | $1.10 | 19d | 1 | 1.03mi |
| 148 River Rise Rd Kyle, TX | 4.0 | 2.0 | 1622 | $1,800 | $1.11 | 45d | 1 | 1.05mi |
Listing history 15 events
-
2026-06-21days on market $119,995 Active 253 DOM
-
2026-06-18days on market $119,995 Active 250 DOM
-
2026-06-17days on market $119,995 Active 249 DOM
-
2026-06-16days on market $119,995 Active 248 DOM
-
2026-06-15days on market $119,995 Active 247 DOM
-
2026-06-13days on market $119,995 Active 245 DOM
-
2026-06-09days on market $119,995 Active 241 DOM
-
2026-06-08days on market $119,995 Active 240 DOM
-
2026-06-07days on market $119,995 Active 239 DOM
-
2026-06-05days on market $119,995 Active 236 DOM
-
2026-06-03days on market $119,995 Active 235 DOM
-
2026-06-02days on market $119,995 Active 234 DOM
-
2026-06-01days on market $119,995 Active 233 DOM
-
2026-05-31days on market $119,995 Active 232 DOM
-
2025-10-11$119,995 Active 486-char remark
Show marketing remark (486 chars)
This Champion model home delivers a generous 4-bedroom, 2-bath layout perfect for big families or anyone needing extra space. With an open kitchen, roomy living area, and private bedrooms, this home gives you plenty of room! Kitchen features a large island perfect for hosting. Call us today to schedule a tour of this beautiful home! * All home series, floor plans, specifications, dimensions, features, materials, pricing and availability shown on this website are subject to change.
ⓘ Source: listings_history table (triggers on properties + properties_extension) + one-shot
backfill from property_details.listing_events for pre-trigger history.
Climate risk First Street
- Flood 1/10 Low FEMA zone X (unshaded) · 0% chance over 30 yrs
- Wildfire 4/10 Moderate
- Heat 8/10 Severe 7 d/yr ≥108°F today · 23 d/yr by 30 yrs out
- Wind 8/10 Severe 80% chance of damaging wind over 30 yrs
- Air quality 1/10 Low 0 unhealthy d/yr today · 0 by 30 yrs out
Nearby sold comps map
Loading sold comps map…
Walkable amenities ~0.75 mi
Loading nearby amenities…
Taxation est. · year 1
- Rental income
- $23,523
- − Mortgage interest
- −$6,722
- − Property taxes
- −$1,800
- − Insurance
- −$600
- − Repairs & maintenance
- −$1,882
- − Management
- −$1,882
- − Depreciation
- −$3,491
- Taxable income
- $7,147
- Est. tax owed @ 24.0%
- −$1,715
- After-tax cash flow
- $6,917/yr
For passive investors: Depreciation is non-cash, so a rental often shows a tax loss while cash-flowing — sheltering income. Rental losses are passive: they offset passive income freely, and up to $25,000/yr can offset ordinary (W-2) income if you actively participate and your MAGI is under $100k (phasing out to $0 by $150k); unused losses carry forward. On sale, claimed depreciation is recaptured at up to 25%, and gains may owe capital-gains tax (a 1031 exchange can defer both). Figures are a year-1 estimate at your 24.0% rate — not tax advice; consult a CPA.
Condition & rehab AI · 10 photos
This Champion model home is in excellent condition with a good layout and modern finishes. It is move-in ready and has the potential for further value increases through minor updates.
Value-add opportunities
- Both Painting the exterior and interior walls — Fresh paint can enhance curb appeal and interior aesthetics.
- Both Landscaping the front yard — A well-maintained front yard can improve curb appeal and attract potential buyers/tenants.
- Both Adding smart home features — Smart home features can increase the home's value and appeal to tech-savvy buyers/tenants.
- Both Upgrading the kitchen appliances — Modern appliances can make the kitchen more functional and appealing to potential buyers/tenants.
Renovation cost estimate screening
Value-add ROI direction
- Both Painting the exterior and interior walls — Fresh paint can enhance curb appeal and interior aesthetics. ↑
- Both Landscaping the front yard — A well-maintained front yard can improve curb appeal and attract potential buyers/tenants. ↑
- Both Adding smart home features — Smart home features can increase the home's value and appeal to tech-savvy buyers/tenants. ↑
- Both Upgrading the kitchen appliances — Modern appliances can make the kitchen more functional and appealing to potential buyers/tenants. ↑
ⓘ Cost ranges are severity-bucket heuristics (US national rule-of-thumb). Get contractor quotes + a written scope before underwriting a rehab budget.
Schools (NCES district)
- District
- Hays CISD
- NCES district ID
- 4800010
- Math proficiency
- 35% ▼ -15.00%
- Reading proficiency
- 41% ▼ -5.00%
- Median HH income
- $70,570
- Composite
- 34.78/100
- National rank
- #5118
- State rank
- #390 of 826 in TX
Livability — Kyle
- Score
- 75/100
- State rank
- #138
- US rank
- #3993
Category grades
Schools grade is shown separately in the Schools card above.
Census & demographics
- Census place
- Kyle, TX
- County
- Hays County · 280,138 people
- City population
- 77,531
- Metro
- Austin-Round Rock-Georgetown, TX
- Population (ZIP)
- 77,531
- Household income
- $90,075
- Rent vs Own
- Severe rent burden
- 2552.0
Population outlook (Hays County) Hauer SSP2
- Today (2025)
- 286,948 people
- By 2030
- 336,923 · +17.4%
- By 2040
- 441,894 · +54.0%
- By 2050
- 553,462 · +92.9%
- By 2075
- 838,261 · +192.1%
- By 2100
- 1,063,658 · +270.7%
Race, ethnicity, and origin ACS 2023
- Neighborhood character
- Diverse neighborhood (Simpson 0.56)
- Race & ethnicity
- Hispanic / Latino 55% White 36% Two or more races 29% Black 5% Native American 1%
- Hispanic origin (detail)
- Mexican 47% Puerto Rican 1%
- Common ancestry
- Italian 2% Slovak 2% Lithuanian 1%
- Foreign-born
- 13% · Canada
- Languages at home
- 63% English-only · Spanish 35%
Political lean MEDSL · Hays
- 2024 margin
- Lean D (+5.7) · D 52.1% · R 46.5% · Other 1.4%
- 2008→2024 swing
- +7.7pp toward D · 2008: -2.0pp · 2024: 5.7pp
- All cycles
- 2024: D+5.7 2020: D+10.8 2016: R+0.9 2012: R+10.4 2008: R+2.0
Not yet ingested
- Civics
- —
Market trends
- HPI YoY
- ▼ -92.64%
- Current HPI
- 181.7969
- Rent YoY
- ▼ -0.34%
- Metro
- Austin-Round Rock-Georgetown, TX
- State GDP YoY
- ▲ 3.95%
- F500 in state
- 110
Industry mix (Fortune 500 HQ in TX)
| Industry | F500 HQs | Revenue |
|---|---|---|
| Energy | 16 | $1,198B |
|
||
| Technology | 5 | $198B |
|
||
| Engineering / Construction | 4 | $72B |
|
||
| Energy Services | 3 | $60B |
|
||
| Utilities | 3 | $41B |
|
||
| Healthcare | 2 | $330B |
|
||
Price history
1 event — show timeline
- 2025-10-11 Listed $119,995 Zillow
Cash-flow waterfall
monthlySold comps — $/sqft
last 12 mo · ≤1 miLoading sold comps…