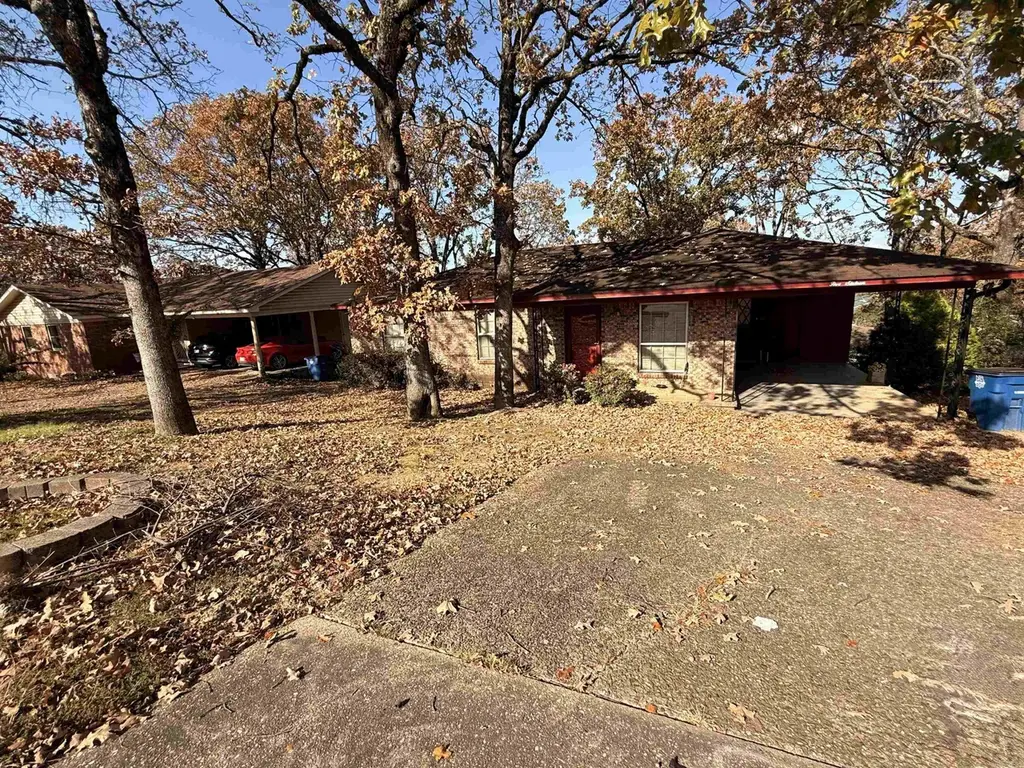
516 Paula Dr · North Little Rock, AR
Flood risk 1/10 · Minimal
- FEMA flood zone
- X (unshaded)
- Chance of flooding over 30 yrs
- 0.0%
- Est. flood insurance / yr
- $507 – $1,088
Fire risk 3/10 · Minor
- Est. fire insurance / yr
- $1,499 – $2,785
Heat risk 7/10 · Major
- Hot days now (above 110°F)
- 7 days/yr
- Hot days in 30 yrs
- 19 days/yr
Wind risk 4/10 · Minor
- Chance of severe wind over 30 yrs
- 10.0%
Air-quality risk 2/10 · Minimal
- Unhealthy air days now
- 1 days/yr
- Unhealthy air days in 30 yrs
- 1 days/yr
Risk factors via First Street. Map © Google.
Why this score? — see what drove the B grade
The composite is a weighted blend of 9 inputs, each scored 0–100. Each bar is that input's sub-score; the figure is the points it added to the 100-point composite (weight × sub-score).
- Cash flow +29.0/30.0
- ARV discount +15.0/15.0
- DSCR +10.0/10.0
- 1% rule +8.2/10.0
- Rent growth +3.9/5.0
- Livability +3.7/5.0
- Condition / age +2.5/5.0
- Schools +2.0/10.0
- Appreciation +0.0/10.0
$86,000
🖨 Deal sheet 📄 Offer letter ✓ Due diligence
Listing remarks
Welcome to this charming 3-bedroom, 1.5-bath home in North Little Rock! This home features a comfortable, functional layout with bright living spaces and a well-appointed kitchen. All bedrooms are generously sized, and the half bath adds extra convenience for everyday living. Step outside to a fully fenced backyard with a storage building—perfect for tools, hobbies, or additional storage. Conveniently located near shopping, dining, AGENTS PLEASE SEE REMARKS
Key facts
- Storage building
- Conveniently located
- 8,276 sq ft lot
Tags
Neighborhood map
What this means for you Summary
Snapshot
- This is a 3-bed/2.0-bath single-family listed at $86k.
Deal economics
- At list price, monthly cash flow is $294 ($4k/yr) — positive.
- The deal already cash-flows at list — no discount required.
- Meets the 1% rule at list price ($1k rent vs $86k).
- Cap rate 10.4% vs local median 5.1% in North Little Rock — top-decile yield for the area; either an underpriced asset or a hidden risk that comps aren't pricing in. Stress-test before assuming the spread holds.
Location & tenants
- Location reads 73/100 on livability (#24 in AR) — a middle-class / working-renter tenant base. Strengths: commute A+, cost of living A+, housing A+; Watch: schools D+, crime F, amenities F.
- N. Little Rock School District (urban): math 21% / reading 26% proficiency, ranked #191 of 238 in AR (top 80%) — low school quality limits family demand, transient renter base, plan for 1-2y turnover; 66% free/reduced lunch — lower-income household profile, screen leases tightly.
- Market conditions: Rents rising fast (+5.5%/yr); 105 active listings in the ZIP; 40 comparable units currently listed for rent nearby; rentals lingering (median 44d on market — plan ~5-8 weeks vacancy on turnover, expect pricing pressure); 52% of comp listings sitting > 30 days — soft ceiling on asking rent; 1,006 units permitted in Pulaski County in 2024 (0 in 5+ unit buildings).
Forward outlook
- Local home prices are declining (-3.0%/yr); year-one equity from $595 of loan paydown is wiped out by about $3k of value loss. Plan a longer hold.
- Pulaski County population projected at +6% by 2050 — modest demand growth; plan on rents tracking national, not racing it.
- At projected returns (-3.0% appreciation + 5.5% rent growth), your $24k cash investment doubles in ~7 years — after that, you're playing with house money.
Negotiation context
- Only 5 days on market — expect competitive offers; lowballing is unlikely to land.
- 3 sale attempts since 2y ago with the ask held roughly flat each time — persistent listings suggest the price (not the market) is what's stuck; bring a comps-based counter.
Risks & watch-outs
- Climate carrying-cost: extreme-heat days projected 7→19/yr by 2055 (HVAC capex compounding) — expect insurance premiums to compound above CPI over the hold.
Questions for the listing agent
- Built in 1975 — when were the roof, HVAC, electrical panel, plumbing, and water heater last replaced?
- Is there a deadline driving the sale (1031 exchange, divorce, estate, relocation)? That informs how much negotiation room exists.
- Schools are D-rated, which usually means shorter tenancies and higher turnover. Who's the typical renter profile here, and what's been the actual vacancy rate?
- Crime grade is F in this area — have there been break-ins, vandalism, or insurance claims at this property in the last 3 years? What carrier currently insures it and at what premium?
- What's the average days-on-market for RENTAL listings here right now (not sales)? A rising rental-DOM trend means longer vacancies and softer asking-rent achievability than the comps imply.
- What's the recent tenant-quality profile in this submarket — average credit score on applications, eviction rate, late-payment / NSF rate, and stable-employment percentage? A property-management company in the area should have these aggregated.
- How much new for-sale + rental construction is in the pipeline within 1–3 miles? Heavy new supply typically softens prices + rents 12–24 months out; constrained supply supports both.
Investment metrics
- 1% rule
- 1.32% ✓
- Cap rate
- 10.39%
- Cash-on-cash
- 14.64%
- DSCR
- 1.65
- GRM
- 6.3
CMA / ARV
- ARV (on-the-fly)
- $113,296
- Comps found
- 12
Show comp detail 12 sales within ~0.75 mi
| Address | Dist | Beds/Ba | Sqft | Sold | Price | $/sf | Match |
|---|---|---|---|---|---|---|---|
| 516 Paula Dr | 0.00mi | 3/1.5 | 1,168 (0%) | 0mo | $95,000 | $81 | 98 |
| 501 Melanie Dr | 0.22mi | 3/1.5 | 1,142 (-2%) | 0mo | $135,000 | $118 | 84 |
| 5517 Granby Rd | 0.31mi | 3/2.0 | 1,132 (-3%) | 2mo | $119,500 | $106 | 79 |
| 913 Nicole Dr | 0.24mi | 3/2.0 | 1,258 (+8%) | 2mo | $145,000 | $115 | 74 |
| 201 Lindenhurst Dr | 0.24mi | 2/1.0 (-1) | 1,248 (+7%) | 2mo | $91,000 | $73 | 67 |
| 1205 Nicole Dr | 0.45mi | 3/1.5 | 1,060 (-9%) | 0mo | $145,000 | $137 | 61 |
| 706 W 56th St | 0.35mi | 3/1.0 | 1,038 (-11%) | 3mo | $95,000 | $92 | 58 |
| 5701 Meadowbrook Ln | 0.44mi | 3/1.5 | 1,032 (-12%) | 1mo | $100,200 | $97 | 57 |
| 410 W 51st St | 0.67mi | 3/1.0 | 1,100 (-6%) | 2mo | $105,000 | $95 | 54 |
| 5301 Marion St | 0.57mi | 3/1.0 | 1,060 (-9%) | 4mo | $78,000 | $74 | 51 |
| 5901 Hacienda Dr | 0.61mi | 3/1.0 | 1,044 (-11%) | 1mo | $136,000 | $130 | 49 |
| 224 E 56th St B | 0.57mi | 2/1.0 (-1) | 1,262 (+8%) | 3mo | $68,000 | $54 | 48 |
Match score weights: distance 35% · size 25% · config 20% · recency 20%. Top-matched comps best support the ARV.
Projected returns pro-forma
-3.0% appreciation · 5.47% rent growth · sell at horizon
- IRR
- 7.9%
- Equity multiple
- 1.32×
- Total profit
- $7,684
- Equity at exit
- $12,823
- IRR
- 19.2%
- Equity multiple
- 2.80×
- Total profit
- $43,334
- Equity at exit
- $7,436
Cash invested: $24,080 (down + closing). Projections, not guarantees.
Landlord ↔ Tenant lean methodology
- Overall (STATE)
- 92 Strongly Landlord-Friendly
- State Arkansas
- 92 Strongly Landlord-Friendly · R+14
- County
- — inherits STATE
- City
- — inherits STATE
ZIP-level market 72118
- Home prices YoY
- -17.9%
- Rents YoY
- 5.5%
- Active inventory
- 105
- Price-to-rent
- 6.3×
Monthly cashflow live
- Estimated rent
- $1,134 high interval (Pro) →
- Mortgage (P&I)
- −$451
- Tax from tax record
- −$115 /mo · $1,379/yr
- Insurance
- −$36
- HOA
- −$0
- Vacancy / Maint / Mgmt
- −$238
- Net cashflow
- $294
Break-even live
UW: 25.0% down · 7.5% · 30yr · 1.5% tax · 5.0% vac · 8.0% maint · 8.0% mgmt
Financing live
Cash to close
- Down payment
- $21,500
- Closing costs
- $2,580
- Reserves months
- —
- Total cash needed
- —
Loan-product check · same deal, 3 products live
Conventional
25% down · 7.5% · 30yr
- Down + closing
- —
- Monthly P&I
- —
- Monthly cashflow
- —
- DSCR
- —
- Eligible?
- —
Personal DTI + credit; lowest rate.
DSCR
20% down · 8.5% · 30yr
- Down + closing
- —
- Monthly P&I
- —
- Monthly cashflow
- —
- DSCR
- —
- Eligible?
- —
No personal income docs; deal must DSCR.
Hard money
10% down · 12.0% · 12mo
- Down + closing
- —
- Monthly P&I
- —
- Monthly cashflow
- —
- DSCR
- —
- Eligible?
- —
Short-term bridge; refi at stabilization.
Rent comps 40 comps
| Address | Beds | Baths | Sqft | Rent | $/sqft | DOM | Units | Dist |
|---|---|---|---|---|---|---|---|---|
| 405 Paula Dr North Little Rock, AR | 3.0 | 1.0 | 962 | $1,095 | $1.14 | 43d | 1 | 0.09mi |
| 58 Somerset Dr North Little Rock, AR | 3.0 | 1.0 | 910 | $1,150 | $1.26 | 43d | 1 | 0.17mi |
| 5 Oakview Dr North Little Rock, AR | 3.0 | 1.0 | 884 | $995 | $1.13 | 43d | 1 | 0.27mi |
| 1 Oakview Dr North Little Rock, AR | 4.0 | 1.0 | 1196 | $1,275 | $1.07 | 43d | 1 | 0.29mi |
| 5612 Crescent Dr North Little Rock, AR | 3.0 | 2.0 | 1275 | $1,150 | $0.90 | 19d | 1 | 0.30mi |
| 5732 Camp Robinson Rd Unit 4 North Little Rock, AR | 2.0 | 1.5 | 1100 | $800 | $0.73 | 43d | 1 | 0.32mi |
| 5732 Camp Robinson Rd Apt 5 North Little Rock, AR | 2.0 | 1.5 | 1100 | $775 | $0.70 | 43d | 1 | 0.34mi |
| 5804 Foxboro Dr North Little Rock, AR | 3.0 | 2.0 | 1071 | $1,200 | $1.12 | 23d | 1 | 0.37mi |
| 5 Foxboro Ct North Little Rock, AR | 3.0 | 2.0 | 1270 | $1,350 | $1.06 | 43d | 1 | 0.43mi |
| 711 W 54th St North Little Rock, AR | 2.0 | 1.5 | 936 | $925 | $0.99 | 43d | 1 | 0.44mi |
| 5413 N Main St North Little Rock, AR | 3.0 | 1.0 | 1107 | $1,075 | $0.97 | 43d | 1 | 0.46mi |
| 5423 Pike Ave North Little Rock, AR | 3.0 | 2.0 | 1296 | $1,100 | $0.85 | 23d | 1 | 0.53mi |
| 5703 Del Prado St North Little Rock, AR | 3.0 | 1.5 | 1050 | $1,395 | $1.33 | 23d | 1 | 0.57mi |
| 109 Farmere Cir North Little Rock, AR | 3.0 | 1.0 | 1051 | $1,190 | $1.13 | 43d | 1 | 0.58mi |
| 508 Westfield Dr North Little Rock, AR | 4.0 | 2.0 | 1434 | $1,595 | $1.11 | 21d | 1 | 0.59mi |
| 5219 Pike Ave North Little Rock, AR | 3.0 | 1.0 | 1189 | $1,195 | $1.01 | 23d | 1 | 0.60mi |
| 407 W 51st St North Little Rock, AR | 3.0 | 2.0 | 1368 | $1,300 | $0.95 | 43d | 1 | 0.63mi |
| 5218 Nelbrook Dr North Little Rock, AR | 3.0 | 1.0 | 954 | $1,080 | $1.13 | 23d | 1 | 0.65mi |
| 31 Perin Rd North Little Rock, AR | 3.0 | 1.5 | 1170 | $1,103 | $0.94 | 43d | 1 | 0.70mi |
| 4912 Gum St North Little Rock, AR | 2.0 | 2.0 | 888 | $875 | $0.99 | 23d | 1 | 0.75mi |
| 4926 Francis St Unit B North Little Rock, AR | 2.0 | 1.0 | 900 | $700 | $0.78 | 23d | 1 | 0.87mi |
| 4748 Ridge Rd North Little Rock, AR | 2.0 | 1.0 | 869 | $1,125 | $1.29 | 14d | 1 | 0.98mi |
| 407 Rock St North Little Rock, AR | 3.0 | 1.0 | 1236 | $1,395 | $1.13 | 43d | 1 | 1.00mi |
| 4907 Augusta Cir North Little Rock, AR | 1.0–2.0 | 1.0–1.5 | 747 | $835 | $1.12 | 14d | 12 | 1.04mi |
| 1707 Arrowhead Rd North Little Rock, AR | 1.0–2.0 | 1.0–1.5 | 656 | $865 | $1.32 | 14d | 15 | 1.12mi |
| 5555 Springvale Rd Unit 5561 North Little Rock, AR | 2.0 | 2.0 | 1100 | $975 | $0.89 | 23d | 1 | 1.14mi |
| 2214 Coors Dr North Little Rock, AR | 3.0 | 2.0 | 1096 | $1,050 | $0.96 | 23d | 1 | 1.14mi |
| 4901 Hickory Ave Unit B North Little Rock, AR | 2.0 | 1.0 | 900 | $825 | $0.92 | 43d | 1 | 1.20mi |
| 4017 Mellene Dr North Little Rock, AR | 3.0 | 1.0 | 1094 | $1,150 | $1.05 | 43d | 1 | 1.23mi |
| 4815 Hickory Ave North Little Rock, AR | 2.0 | 1.5 | 900 | $775 | $0.86 | 43d | 1 | 1.23mi |
| 4805 Hickory Ave North Little Rock, AR | 2.0 | 1.0 | 900 | $850 | $0.94 | 14d | 1 | 1.24mi |
| 4805 Hickory Ave Apt 3 North Little Rock, AR | 2.0 | 1.0 | 900 | $850 | $0.94 | 43d | 1 | 1.24mi |
| 402 W K St North Little Rock, AR | 2.0 | 1.0 | 825 | $750 | $0.91 | 43d | 1 | 1.28mi |
| 4116 Moss St North Little Rock, AR | 2.0 | 1.0 | 1139 | $850 | $0.75 | 23d | 1 | 1.28mi |
| 114 Rim Rock Pl Unit D North Little Rock, AR | 2.0 | 1.5 | 1100 | $795 | $0.72 | 43d | 1 | 1.28mi |
| 2508 W 58th St North Little Rock, AR | 2.0 | 1.0 | 1048 | $825 | $0.79 | 43d | 1 | 1.28mi |
| 4000 Emerson Dr North Little Rock, AR | 3.0 | 2.0 | 1046 | $1,195 | $1.14 | 19d | 1 | 1.30mi |
| 1940 Arrowhead Rd North Little Rock, AR | 4.0 | 1.5 | 1136 | $1,400 | $1.23 | 21d | 1 | 1.33mi |
| 325 W I Ave North Little Rock, AR | 2.0 | 1.0 | 1100 | $1,300 | $1.18 | 14d | 1 | 1.35mi |
| 3017 Parkway Dr Unit 2 North Little Rock, AR | 2.0 | 1.5 | 850 | $750 | $0.88 | 43d | 1 | 1.35mi |
Listing history 9 events
-
2026-04-09status Under Contract
-
2026-04-03$86,000 New Listing
-
2026-01-07historical
-
2025-12-27historical Take Backups
-
2025-12-05price $120,000
-
2025-11-17$125,000 New Listing
-
2025-06-24historical
-
2025-01-12price $170,000
-
2024-12-23$195,000 New Listing
ⓘ Source: listings_history table (triggers on properties + properties_extension) + one-shot
backfill from property_details.listing_events for pre-trigger history.
Tax reassessment forecast AR · Resets to sale price
- Current annual tax
- $1,379 · $115/mo
- Projected year-2 tax
- $1,379 · $115/mo
- Expected delta
- $0/yr ($0/mo · -0.0%)
ⓘ Screening estimate from a state-policy table — verify with the county assessor before closing.
Climate risk First Street
- Flood 1/10 Low FEMA zone X (unshaded) · 0% chance over 30 yrs
- Wildfire 3/10 Moderate
- Heat 7/10 Severe 7 d/yr ≥110°F today · 19 d/yr by 30 yrs out
- Wind 4/10 Moderate 10% chance of damaging wind over 30 yrs
- Air quality 2/10 Low 1 unhealthy d/yr today · 1 by 30 yrs out
Nearby sold comps map
Loading sold comps map…
Walkable amenities ~0.75 mi
Loading nearby amenities…
Taxation est. · year 1
- Rental income
- $13,603
- − Mortgage interest
- −$4,817
- − Property taxes
- −$1,379
- − Insurance
- −$430
- − Repairs & maintenance
- −$1,088
- − Management
- −$1,088
- − Depreciation
- −$2,502
- Taxable income
- $2,298
- Est. tax owed @ 24.0%
- −$552
- After-tax cash flow
- $2,974/yr
For passive investors: Depreciation is non-cash, so a rental often shows a tax loss while cash-flowing — sheltering income. Rental losses are passive: they offset passive income freely, and up to $25,000/yr can offset ordinary (W-2) income if you actively participate and your MAGI is under $100k (phasing out to $0 by $150k); unused losses carry forward. On sale, claimed depreciation is recaptured at up to 25%, and gains may owe capital-gains tax (a 1031 exchange can defer both). Figures are a year-1 estimate at your 24.0% rate — not tax advice; consult a CPA.
Schools (NCES district)
- District
- N. Little Rock School District
- NCES district ID
- 0510680
- Math proficiency
- 21% ▼ -11.00%
- Reading proficiency
- 26% ▼ -9.00%
- Median HH income
- $38,325
- Composite
- 19.69/100
- National rank
- #8728
- State rank
- #191 of 238 in AR
Livability — North Little Rock
- Score
- 73/100
- State rank
- #24
- US rank
- #5452
Category grades
Schools grade is shown separately in the Schools card above.
Census & demographics
- Census place
- North Little Rock, AR
- County
- Pulaski County · 372,764 people
- City population
- 55,470
- Metro
- Little Rock-North Little Rock-Conway, AR
- Population (ZIP)
- 22,913
- Household income
- $49,559
- Rent vs Own
- Severe rent burden
- 1149.0
Population outlook (Pulaski County) Hauer SSP2
- Today (2025)
- 415,378 people
- By 2030
- 423,720 · +2.0%
- By 2040
- 435,182 · +4.8%
- By 2050
- 440,904 · +6.1%
- By 2075
- 445,521 · +7.3%
- By 2100
- 419,173 · +0.9%
Race, ethnicity, and origin ACS 2023
- Neighborhood character
- Diverse neighborhood (Simpson 0.64)
- Race & ethnicity
- Black 42% White 42% Hispanic / Latino 11% Two or more races 5%
- Hispanic origin (detail)
- Mexican 6%
- Common ancestry
- Lithuanian 2% Slovak 1% Italian 1%
- Foreign-born
- 7% · Canada
- Languages at home
- 89% English-only · Spanish 10%
Political lean MEDSL · Pulaski
- 2024 margin
- Strong D (+22.1) · D 59.8% · R 37.7% · Other 2.5%
- 2008→2024 swing
- +10.6pp toward D · 2008: 11.6pp · 2024: 22.1pp
- All cycles
- 2024: D+22.1 2020: D+22.5 2016: D+17.9 2012: D+11.4 2008: D+11.6
Not yet ingested
- Civics
- —
Market trends
- HPI YoY
- ▼ -39.32%
- Current HPI
- 180.6901
- Rent YoY
- ▲ 5.47%
- Metro
- Little Rock-North Little Rock-Conway, AR
- State GDP YoY
- ▲ 3.80%
- F500 in state
- 10
Industry mix (Fortune 500 HQ in AR)
| Industry | F500 HQs | Revenue |
|---|---|---|
| Retail | 1 | $681B |
|
||
| Food / Agriculture | 1 | $53B |
|
||
| Retail / Energy | 1 | $22B |
|
||
| Transportation / Logistics | 1 | $12B |
|
||
| Energy | 1 | $4B |
|
||
Price history
-55.9% since first listed9 events — show timeline
- 2026-04-09 Pending — CARMLS
- 2026-04-03 Listed $86,000 CARMLS
- 2026-01-07 Listing Removed — CARMLS
- 2025-12-27 Contingent — CARMLS
- 2025-12-05 Price Changed $120,000 CARMLS
- 2025-11-17 Listed $125,000 CARMLS
- 2025-06-24 Listing Removed — CARMLS
- 2025-01-12 Price Changed $170,000 CARMLS
- 2024-12-23 Listed $195,000 CARMLS
Property tax history
+4.1%/yrLatest (2025): $1,379 · +12.2% YoY. Source: county tax records.
Cash-flow waterfall
monthlySold comps — $/sqft
last 12 mo · ≤1 miLoading sold comps…