 🏗️ New Construction
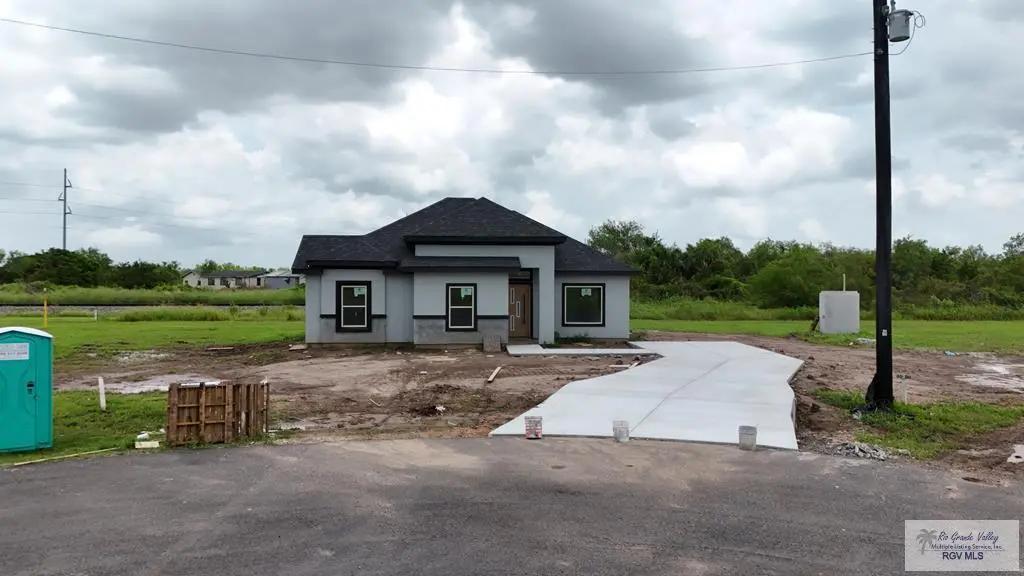
33675 Tejon Rd · Laureles, TX
Flood risk No data
- FEMA flood zone
- —
- Chance of flooding over 30 yrs
- —
- Est. flood insurance / yr
- —
Fire risk No data
- Est. fire insurance / yr
- —
Heat risk No data
- Hot days now (above threshold)
- —
- Hot days in 30 yrs
- —
Wind risk No data
- Chance of severe wind over 30 yrs
- —
Air-quality risk No data
- Unhealthy air days now
- —
- Unhealthy air days in 30 yrs
- —
Risk factors via First Street. Map © Google.
Why this score? — see what drove the C- grade
The composite is a weighted blend of 9 inputs, each scored 0–100. Each bar is that input's sub-score; the figure is the points it added to the 100-point composite (weight × sub-score).
- Cash flow +16.1/30.0
- Appreciation +7.9/10.0
- ARV discount +7.5/15.0
- DSCR +5.0/10.0
- Condition / age +4.8/5.0
- 1% rule +4.4/10.0
- Schools +3.3/10.0
- Livability +2.7/5.0
- Rent growth +2.5/5.0
$245,000
🖨 Deal sheet 📄 Offer letter ✓ Due diligence
Listing remarks
New Construction home with an enormous lot, almost half an acre. Property is located in very desirable neighborhood/area with convenient access to major roads, shopping centers, and schools. It features a beautiful kitchen with plenty of cabinet space and quartz countertops. This home also has a large window that looks out to the backyard and allows for great natural lightning. Home is located just 20 minutes away from South Padre Island, this home offers the perfect blend of comfort, convenience, and coastal living. Property will be ready by the end of June. Schedule your private showing today! Don't miss the opportunity to own this exceptional property.
Key facts
- Quartz countertops
- Beautiful kitchen
- Convenient access
Tags
Property features AI
Exterior
- Security: Smoke detector(s)
- Utilities: Public water; Public sewer; Cable available
- Home design: Single-family residence; House; One story; New construction
- Construction: Stone and stucco construction; Slab foundation
- Exterior features: Composition roof; Smoke detectors
Interior
- Flooring: Tile
- Bathrooms: 2 full bathrooms
- Heating & cooling: Central heating (electric); Central air; Ceiling fans
- Interior features: Electric water heater; Tile flooring
Neighborhood map
What this means for you Summary
Snapshot
- This is a 3-bed/2.0-bath single-family listed at $245k. Condition is rated excellent.
Deal economics
- At list price, monthly cash flow is $124 ($1k/yr) — positive.
- The deal already cash-flows at list — no discount required.
- To meet the 1% rule (rent ≥ 1% of price), the offer needs to be $230k (6.1% below list).
- Recommended offer: $230k (6.1% below list) — sets the bar for 1% rule.
Location & tenants
- Location reads 54/100 on livability (#1,404 in TX) — a working-class tenant base; expect higher turnover. Strengths: cost of living A+, housing A-; Watch: crime D, amenities F, commute F.
- Los Fresnos CISD (suburban): math 34% / reading 44% proficiency, ranked #444 of 826 in TX (top 54%) — families likely to look elsewhere, expect single-tenant / working-renter base with shorter leases.
- Zoned schools: Palmer-Laakso El (math 37% / reading 47%, grade F, #1,335 of 4,322 statewide, top 33%, 495 students, 78% FRL); Los Cuates Middle (math 32% / reading 35%, grade F, #911 of 1,662 statewide, top 56%, 809 students, 78% FRL); Los Fresnos H S (math 41% / reading 55%, grade D, #571 of 1,632 statewide, top 36%, 3,272 students, 82% FRL) — zoned schools average 79% FRL vs 43% district-wide (36 pts higher); higher-poverty schools than district average — tighter screening recommended.
- Market conditions: 231 active listings in the ZIP; 1 comparable units currently listed for rent nearby; 2,326 units permitted in Cameron County in 2024 (503 in 5+ unit buildings).
Forward outlook
- In year one you build about $16k of equity ($2k loan paydown + $14k appreciation (5.8% local appreciation)).
- Cameron County population projected at +3% by 2050 — modest demand growth; plan on rents tracking national, not racing it.
- At projected returns (5.8% appreciation + 3.0% rent growth), your $69k cash investment doubles in ~4 years — after that, you're playing with house money.
- By year 3, paydown + projected appreciation supports a ~$39k cash-out refi (75% LTV) — recoverable capital for the next deal without selling this one.
Negotiation context
- Only 11 days on market — expect competitive offers; lowballing is unlikely to land.
Questions for the listing agent
- Is there a deadline driving the sale (1031 exchange, divorce, estate, relocation)? That informs how much negotiation room exists.
- Schools are F-rated, which usually means shorter tenancies and higher turnover. Who's the typical renter profile here, and what's been the actual vacancy rate?
- Crime grade is D in this area — have there been break-ins, vandalism, or insurance claims at this property in the last 3 years? What carrier currently insures it and at what premium?
- What's the average days-on-market for RENTAL listings here right now (not sales)? A rising rental-DOM trend means longer vacancies and softer asking-rent achievability than the comps imply.
- What's the recent tenant-quality profile in this submarket — average credit score on applications, eviction rate, late-payment / NSF rate, and stable-employment percentage? A property-management company in the area should have these aggregated.
- How much new for-sale + rental construction is in the pipeline within 1–3 miles? Heavy new supply typically softens prices + rents 12–24 months out; constrained supply supports both.
Investment metrics
- 1% rule
- 0.94% ✗
- Cap rate
- 6.90%
- Cash-on-cash
- 2.17%
- DSCR
- 1.10
- GRM
- 8.9
CMA / ARV
No comps found within radius.
Projected returns pro-forma
5.78% appreciation · 3.0% rent growth · sell at horizon
- IRR
- 16.6%
- Equity multiple
- 2.10×
- Total profit
- $75,485
- Equity at exit
- $150,639
- IRR
- 16.6%
- Equity multiple
- 4.16×
- Total profit
- $216,805
- Equity at exit
- $270,307
Cash invested: $68,600 (down + closing). Projections, not guarantees.
Landlord ↔ Tenant lean methodology
- Overall (STATE)
- 87 Strongly Landlord-Friendly
- State Texas
- 87 Strongly Landlord-Friendly · R+5
- County
- — inherits STATE
- City
- — inherits STATE
ZIP-level market 78566
- Home prices YoY
- 2.7%
- Active inventory
- 231
- Price-to-rent
- 8.9×
Monthly cashflow live
- Estimated rent
- $2,300 medium interval (Pro) →
- Mortgage (P&I)
- −$1,285
- Tax est. 1.5%
- −$306 /mo · $3,675/yr
- Insurance
- −$102
- HOA
- −$0
- Vacancy / Maint / Mgmt
- −$483
- Net cashflow
- $124
Break-even live
UW: 25.0% down · 7.5% · 30yr · 1.5% tax · 5.0% vac · 8.0% maint · 8.0% mgmt
Financing live
Cash to close
- Down payment
- $61,250
- Closing costs
- $7,350
- Reserves months
- —
- Total cash needed
- —
Loan-product check · same deal, 3 products live
Conventional
25% down · 7.5% · 30yr
- Down + closing
- —
- Monthly P&I
- —
- Monthly cashflow
- —
- DSCR
- —
- Eligible?
- —
Personal DTI + credit; lowest rate.
DSCR
20% down · 8.5% · 30yr
- Down + closing
- —
- Monthly P&I
- —
- Monthly cashflow
- —
- DSCR
- —
- Eligible?
- —
No personal income docs; deal must DSCR.
Hard money
10% down · 12.0% · 12mo
- Down + closing
- —
- Monthly P&I
- —
- Monthly cashflow
- —
- DSCR
- —
- Eligible?
- —
Short-term bridge; refi at stabilization.
Rent comps 1 comps
| Address | Beds | Baths | Sqft | Rent | $/sqft | DOM | Units | Dist |
|---|---|---|---|---|---|---|---|---|
| 30816 Muraya St Los Fresnos, TX | 4.0 | 2.5 | 1770 | $2,300 | $1.30 | 43d | 1 | 0.39mi |
Listing history 10 events
-
2026-06-18days on market $245,000 Active 11 DOM
-
2026-06-17days on market $245,000 Active 10 DOM
-
2026-06-16days on market $245,000 Active 9 DOM
-
2026-06-15days on market $245,000 Active 8 DOM
-
2026-06-14days on market $245,000 Active 6 DOM
-
2026-06-13days on market $245,000 Active 5 DOM
-
2026-06-10days on market $245,000 Active 3 DOM
-
2026-06-09days on market $245,000 Active 2 DOM
-
2026-06-08remarks 663-char remark
-
2026-06-08$245,000 Active 1 DOM
ⓘ Source: listings_history table (triggers on properties + properties_extension) + one-shot
backfill from property_details.listing_events for pre-trigger history.
Nearby sold comps map
Loading sold comps map…
Walkable amenities ~0.75 mi
Loading nearby amenities…
Taxation est. · year 1
- Rental income
- $27,600
- − Mortgage interest
- −$13,724
- − Property taxes
- −$3,675
- − Insurance
- −$1,225
- − Repairs & maintenance
- −$2,208
- − Management
- −$2,208
- − Depreciation
- −$7,127
- Taxable loss
- −$2,567
- Est. tax savings @ 24.0%
- +$616
- After-tax cash flow
- $2,102/yr
For passive investors: Depreciation is non-cash, so a rental often shows a tax loss while cash-flowing — sheltering income. Rental losses are passive: they offset passive income freely, and up to $25,000/yr can offset ordinary (W-2) income if you actively participate and your MAGI is under $100k (phasing out to $0 by $150k); unused losses carry forward. On sale, claimed depreciation is recaptured at up to 25%, and gains may owe capital-gains tax (a 1031 exchange can defer both). Figures are a year-1 estimate at your 24.0% rate — not tax advice; consult a CPA.
Condition & rehab AI · 13 photos
This new construction home is in excellent condition with no visible repairs or maintenance needed. The property is located in a desirable neighborhood with convenient access to major roads, shopping centers, and schools. The home features a beautiful kitchen with plenty of cabinet space and quartz countertops, and a large window that looks out to the backyard and allows for great natural lighting. The property will be ready by the end of June.
Value-add opportunities
- Both Landscaping and curb appeal — A well-maintained landscape and curb appeal can enhance both the resale and rental value of the property.
Renovation cost estimate screening
Value-add ROI direction
- Both Landscaping and curb appeal — A well-maintained landscape and curb appeal can enhance both the resale and rental value of the property. ↑
ⓘ Cost ranges are severity-bucket heuristics (US national rule-of-thumb). Get contractor quotes + a written scope before underwriting a rehab budget.
Schools (NCES district)
- District
- Los Fresnos CISD
- NCES district ID
- 4828290
- Math proficiency
- 34% ▼ -30.00%
- Reading proficiency
- 44% ▼ -10.00%
- Median HH income
- $42,586
- Composite
- 32.92/100
- National rank
- #5601
- State rank
- #444 of 826 in TX
Livability — Laureles
- Score
- 54/100
- State rank
- #1404
- US rank
- #24046
Category grades
Schools grade is shown separately in the Schools card above.
Census & demographics
- Census place
- Laureles, TX
- Population (ZIP)
- 24,927
Population outlook (Cameron County) Hauer SSP2
- Today (2025)
- 441,603 people
- By 2030
- 448,113 · +1.5%
- By 2040
- 456,385 · +3.3%
- By 2050
- 456,294 · +3.3%
- By 2075
- 423,851 · -4.0%
- By 2100
- 342,787 · -22.4%
Race, ethnicity, and origin ACS 2023
- Neighborhood character
- Predominantly Hispanic (88%)
- Race & ethnicity
- Hispanic / Latino 88% Two or more races 45% White 10% Black 1%
- Hispanic origin (detail)
- Mexican 84%
- Foreign-born
- 22% · Canada
- Languages at home
- 33% English-only · Spanish 67%
Political lean MEDSL · Cameron
- 2024 margin
- Lean R (+5.8) · D 46.7% · R 52.5%
- 2008→2024 swing
- -34.6pp toward R · 2008: 28.8pp · 2024: -5.8pp
- All cycles
- 2024: R+5.8 2020: D+13.2 2016: D+32.5 2012: D+32.4 2008: D+28.8
Not yet ingested
- Civics
- —
Market trends
- HPI YoY
- ▲ 5.78%
- Current HPI
- 218.1236
- Rent YoY
- —
- Metro
- —
- State GDP YoY
- ▲ 3.95%
- F500 in state
- 110
Industry mix (Fortune 500 HQ in TX)
| Industry | F500 HQs | Revenue |
|---|---|---|
| Energy | 16 | $1,198B |
|
||
| Technology | 5 | $198B |
|
||
| Engineering / Construction | 4 | $72B |
|
||
| Energy Services | 3 | $60B |
|
||
| Utilities | 3 | $41B |
|
||
| Healthcare | 2 | $330B |
|
||
Price history
1 event — show timeline
- 2026-06-08 Listed $245,000 RGVMLS
Cash-flow waterfall
monthlySold comps — $/sqft
last 12 mo · ≤1 miLoading sold comps…