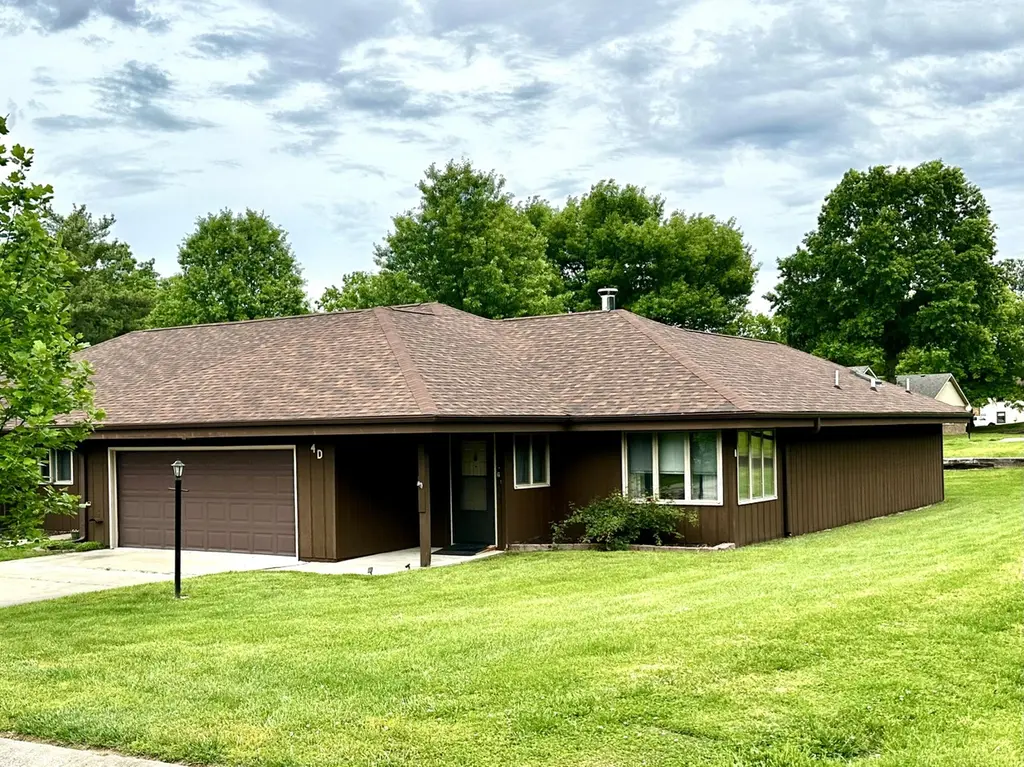
4 D Pinecrest Rd · Boonville, MO
Flood risk 1/10 · Minimal
- FEMA flood zone
- X (unshaded)
- Chance of flooding over 30 yrs
- 0.0%
- Est. flood insurance / yr
- $507 – $1,088
Fire risk 3/10 · Minor
- Est. fire insurance / yr
- $1,054 – $1,958
Heat risk 4/10 · Minor
- Hot days now (above 107°F)
- 7 days/yr
- Hot days in 30 yrs
- 18 days/yr
Wind risk 2/10 · Minimal
- Chance of severe wind over 30 yrs
- —
Air-quality risk 2/10 · Minimal
- Unhealthy air days now
- 0 days/yr
- Unhealthy air days in 30 yrs
- 1 days/yr
Risk factors via First Street. Map © Google.
Why this score? — see what drove the F grade
The composite is a weighted blend of 9 inputs, each scored 0–100. Each bar is that input's sub-score; the figure is the points it added to the 100-point composite (weight × sub-score).
- ARV discount +12.2/15.0
- 1% rule +6.3/10.0
- Livability +3.1/5.0
- Schools +3.0/10.0
- Rent growth +2.5/5.0
- Condition / age +2.2/5.0
- Cash flow +1.5/30.0
- DSCR +0.0/10.0
- Appreciation +0.0/10.0
$179,900
🖨 Deal sheet 📄 Offer letter ✓ Due diligence
Listing remarks MLS
READY TO ENJOY IN THIS QUIET NEIGHBORHOOD! This 2 BR, 2 BA Slab, Townhouse has 1,263 sq. ft. living space. Enjoy the two-sided fireplace that can be seen from LR or DR. Display your china or collectibles in glass enclosed built-in cabinet. HOA fees are $700 per year. 2-car attached garage has shelving, a closet and access to attic for storage. Home Warranty included.
Key facts
- Extra storage above
- Walk-in shower
- Lots of shelving
Tags
Property features AI
Finance
- Other: Zoning: R-2
Exterior
- Parking: Attached 2-car garage
- Home design: Single-family residence; Single-story
- Construction: Above-grade living area approximately 1,250
- Exterior features: Lot roughly 40 x 82; Subdivision: Boonville Village Estates
Interior
- Kitchen: Range; Oven; Dishwasher; Disposal; Microwave; Refrigerator
- Heating & cooling: Heating
- Interior features: Fireplace; Range; Oven; Dishwasher; Disposal; Microwave; Refrigerator
- Laundry & utility: Washer; Dryer
Neighborhood map
What this means for you Summary
Snapshot
- This is a 2-bed/2.0-bath condo listed at $180k. Condition is rated fair.
Deal economics
- At list price, monthly cash flow is $-700 ($-8k/yr) — negative.
- The deal already cash-flows at list — no discount required.
- Meets the 1% rule at list price ($2k rent vs $180k).
- Recommended offer: $175k (3.0% below list) — sets the bar for market timing.
- Cap rate 1.6% vs local median 4.6% in Boonville — below-typical yield; the buyer is paying a premium for something (appreciation thesis, condition, location) that the cap rate doesn't capture.
Location & tenants
- Location reads 61/100 on livability (#410 in MO) — a middle-class / working-renter tenant base. Strengths: cost of living A+, housing A+; Watch: schools D-, amenities F, commute F.
- Boonville R-I (town): math 31% / reading 39% proficiency, ranked #215 of 324 in MO (top 66%) — families likely to look elsewhere, expect single-tenant / working-renter base with shorter leases.
- Market conditions: 138 active listings in the ZIP; 2 comparable units currently listed for rent nearby; 10 units permitted in Cooper County in 2024 (0 in 5+ unit buildings).
Forward outlook
- Local home prices are declining (-3.0%/yr); year-one equity from $1k of loan paydown is wiped out by about $5k of value loss. Plan a longer hold.
- Cooper County population projected to shrink 4% by 2050 — rents likely to lag national; underwrite the cash flow, not the appreciation.
Negotiation context
- It's been on market 40 days — a 3% lower offer ($175k) is reasonable based on typical stale-listing flexibility.
- 2 sale attempts since 15y ago with the ask held roughly flat each time — persistent listings suggest the price (not the market) is what's stuck; bring a comps-based counter.
Risks & watch-outs
- Watch-outs: HOA is 52% of rent.
Questions for the listing agent
- What do current leases actually rent for vs. the listed asking? Can we see a recent rent roll and the last 12 months of T-12 income?
- It's been on market 40 days. Have you received any prior offers? Is the seller open to a 3% concession, seller financing, or rate buy-down credit?
- Have any recent inspections been done? Can we get a copy of the seller's disclosures and any deferred-maintenance estimates?
- Built in 1977 — when were the roof, HVAC, electrical panel, plumbing, and water heater last replaced?
- What does the HOA fee cover, when was the last increase, and are there any pending special assessments or reserve-fund shortfalls?
- Any open or pending special assessments — roof, HVAC, plumbing, elevator, façade? What's the per-unit balance and payoff schedule, and is the seller paying it off at close or rolling it to the buyer?
- Is there a deadline driving the sale (1031 exchange, divorce, estate, relocation)? That informs how much negotiation room exists.
- Schools are D-rated, which usually means shorter tenancies and higher turnover. Who's the typical renter profile here, and what's been the actual vacancy rate?
- The area grade is low — what's the realistic commute time and amenity access for the typical tenant pool here? Any planned neighborhood developments (good or bad) we should know about?
- What's the average days-on-market for RENTAL listings here right now (not sales)? A rising rental-DOM trend means longer vacancies and softer asking-rent achievability than the comps imply.
- What's the recent tenant-quality profile in this submarket — average credit score on applications, eviction rate, late-payment / NSF rate, and stable-employment percentage? A property-management company in the area should have these aggregated.
- How much new apartment / multifamily construction is in the pipeline within 1–3 miles? Heavy new supply (>2% of stock underway) typically softens rents 12–24 months out; light construction supports rent growth.
Investment metrics
- 1% rule
- 1.13% ✓
- Cap rate
- 1.62%
- Cash-on-cash
- -16.69%
- DSCR
- 0.26
- GRM
- 7.3
CMA / ARV
- ARV (median comp)
- $201,040
- List price
- $179,900
- Delta
- -7.98%
- Verdict
- FAIR
- Comps
- 20 within 1.0 mi
Projected returns pro-forma
-3.0% appreciation · 3.0% rent growth · sell at horizon
- IRR
- -48.2%
- Equity multiple
- -0.45×
- Total profit
- $-73,073
- Equity at exit
- $26,824
- IRR
- -87.3%
- Equity multiple
- -1.35×
- Total profit
- $-118,278
- Equity at exit
- $15,554
Cash invested: $50,372 (down + closing). Projections, not guarantees.
Landlord ↔ Tenant lean methodology
- Overall (STATE)
- 81 Strongly Landlord-Friendly
- State Missouri
- 81 Strongly Landlord-Friendly · R+10
- County
- — inherits STATE
- City
- — inherits STATE
ZIP-level market 65233
- Active inventory
- 138
- Price-to-rent
- 7.3×
Monthly cashflow live
- Estimated rent
- $2,042 medium interval (Pro) →
- Mortgage (P&I)
- −$943
- Tax est. 1.5%
- −$225 /mo · $2,698/yr
- Insurance
- −$75
- HOA est. from 1 same-building comp
- −$1,070
- Vacancy / Maint / Mgmt
- −$429
- Net cashflow
- $-700
Break-even live
UW: 25.0% down · 7.5% · 30yr · 1.5% tax · 5.0% vac · 8.0% maint · 8.0% mgmt
Financing live
Cash to close
- Down payment
- $44,975
- Closing costs
- $5,397
- Reserves months
- —
- Total cash needed
- —
Loan-product check · same deal, 3 products live
Conventional
25% down · 7.5% · 30yr
- Down + closing
- —
- Monthly P&I
- —
- Monthly cashflow
- —
- DSCR
- —
- Eligible?
- —
Personal DTI + credit; lowest rate.
DSCR
20% down · 8.5% · 30yr
- Down + closing
- —
- Monthly P&I
- —
- Monthly cashflow
- —
- DSCR
- —
- Eligible?
- —
No personal income docs; deal must DSCR.
Hard money
10% down · 12.0% · 12mo
- Down + closing
- —
- Monthly P&I
- —
- Monthly cashflow
- —
- DSCR
- —
- Eligible?
- —
Short-term bridge; refi at stabilization.
Rent comps 2 comps
| Address | Beds | Baths | Sqft | Rent | $/sqft | DOM | Units | Dist |
|---|---|---|---|---|---|---|---|---|
| 1048 Stonehaven Dr Boonville, MO | 3.0 | 2.0 | 1500 | $2,200 | $1.47 | 13d | 1 | 0.65mi |
| 1044 Stonehaven Dr Boonville, MO | 2.0 | 2.0 | 1309 | $1,900 | $1.45 | 13d | 1 | 0.67mi |
HOA detail condo
- Monthly dues
- $0 · $0/yr
- Assessments
- None detected in remarks — confirm with the listing agent.
Listing history 20 events
-
2026-06-19days on market $179,900 Active 40 DOM
-
2026-06-18days on market $179,900 Active 39 DOM
-
2026-06-17price $179,900 Active 38 DOM
-
2026-06-17days on market $185,000 Active 38 DOM
-
2026-06-16days on market $185,000 Active 37 DOM
-
2026-06-15days on market $185,000 Active 36 DOM
-
2026-06-14days on market $185,000 Active 34 DOM
-
2026-06-13days on market $185,000 Active 33 DOM
-
2026-06-10days on market $185,000 Active 31 DOM
-
2026-06-09days on market $185,000 Active 30 DOM
-
2026-06-08days on market $185,000 Active 29 DOM
-
2026-06-07days on market $185,000 Active 28 DOM
-
2026-06-05days on market $185,000 Active 25 DOM
-
2026-06-02days on market $185,000 Active 23 DOM
-
2026-06-01days on market $185,000 Active 22 DOM
-
2026-05-31days on market $185,000 Active 21 DOM
-
2026-05-30days on market $185,000 Active 20 DOM
-
2026-05-11$185,000 Active 467-char remark
-
2012-02-17soldstatus 369-char remark
Show marketing remark (369 chars)
READY TO ENJOY IN THIS QUIET NEIGHBORHOOD! This 2 BR, 2 BA Slab, Townhouse has 1,263 sq. ft. living space. Enjoy the two-sided fireplace that can be seen from LR or DR. Display your china or collectibles in glass enclosed built-in cabinet. HOA fees are $700 per year. 2-car attached garage has shelving, a closet and access to attic for storage. Home Warranty included.
-
2011-09-20$89,000 369-char remark
Show marketing remark (369 chars)
READY TO ENJOY IN THIS QUIET NEIGHBORHOOD! This 2 BR, 2 BA Slab, Townhouse has 1,263 sq. ft. living space. Enjoy the two-sided fireplace that can be seen from LR or DR. Display your china or collectibles in glass enclosed built-in cabinet. HOA fees are $700 per year. 2-car attached garage has shelving, a closet and access to attic for storage. Home Warranty included.
ⓘ Source: listings_history table (triggers on properties + properties_extension) + one-shot
backfill from property_details.listing_events for pre-trigger history.
Climate risk First Street
- Flood 1/10 Low FEMA zone X (unshaded) · 0% chance over 30 yrs
- Wildfire 3/10 Moderate
- Heat 4/10 Moderate 7 d/yr ≥107°F today · 18 d/yr by 30 yrs out
- Wind 2/10 Low
- Air quality 2/10 Low 0 unhealthy d/yr today · 1 by 30 yrs out
Nearby sold comps map
Loading sold comps map…
Walkable amenities ~0.75 mi
Loading nearby amenities…
Taxation est. · year 1
- Rental income
- $24,499
- − Mortgage interest
- −$10,077
- − Property taxes
- −$2,698
- − Insurance
- −$900
- − Repairs & maintenance
- −$1,960
- − Management
- −$1,960
- − HOA
- −$12,840
- − Depreciation
- −$5,233
- Taxable loss
- −$11,170
- Est. tax savings @ 24.0%
- +$2,681
- After-tax cash flow
- $-5,724/yr
For passive investors: Depreciation is non-cash, so a rental often shows a tax loss while cash-flowing — sheltering income. Rental losses are passive: they offset passive income freely, and up to $25,000/yr can offset ordinary (W-2) income if you actively participate and your MAGI is under $100k (phasing out to $0 by $150k); unused losses carry forward. On sale, claimed depreciation is recaptured at up to 25%, and gains may owe capital-gains tax (a 1031 exchange can defer both). Figures are a year-1 estimate at your 24.0% rate — not tax advice; consult a CPA.
Condition & rehab AI · 12 photos
This 2-bedroom, 2-bathroom condo requires moderate renovations to update the kitchen and bathrooms, which will significantly increase its resale and rental value.
Repairs flagged
- Major kitchen cabinets — severely dated and worn
- Major kitchen countertops — dated and worn
- Major kitchen appliances — dated and worn
- Major bathroom fixtures — basic and worn
- Major bathroom tile — dated and worn
Value-add opportunities
- Resale update kitchen cabinets, countertops, and appliances — modernizing the kitchen will attract more buyers
- Resale update bathrooms with new fixtures and tile — modernizing the bathrooms will attract more buyers
- Both paint interior walls and repair windows — improving the interior and exterior will increase both resale and rental value
Renovation cost estimate screening
| Repair item | Severity | Est. cost |
|---|---|---|
| kitchen cabinets · severely dated and worn | Major | $15,000–50,000 |
| kitchen countertops · dated and worn | Major | $15,000–50,000 |
| kitchen appliances · dated and worn | Major | $15,000–50,000 |
| bathroom fixtures · basic and worn | Major | $15,000–50,000 |
| bathroom tile · dated and worn | Major | $15,000–50,000 |
| Total estimated repair cost · 5 items | $75,000–250,000 |
Value-add ROI direction
- Resale update kitchen cabinets, countertops, and appliances — modernizing the kitchen will attract more buyers ↑
- Resale update bathrooms with new fixtures and tile — modernizing the bathrooms will attract more buyers ↑
- Both paint interior walls and repair windows — improving the interior and exterior will increase both resale and rental value ↑
ⓘ Cost ranges are severity-bucket heuristics (US national rule-of-thumb). Get contractor quotes + a written scope before underwriting a rehab budget.
Schools (NCES district)
- District
- Boonville R-I
- NCES district ID
- 2905580
- Math proficiency
- 31% ▼ -7.00%
- Reading proficiency
- 39% ▼ -5.00%
- Median HH income
- $44,038
- Composite
- 29.75/100
- National rank
- #6441
- State rank
- #215 of 324 in MO
Livability — Boonville
- Score
- 61/100
- State rank
- #410
- US rank
- #17337
Category grades
Schools grade is shown separately in the Schools card above.
Census & demographics
- Census place
- Boonville, MO
- Population (ZIP)
- 10,853
Population outlook (Cooper County) Hauer SSP2
- Today (2025)
- 17,611 people
- By 2030
- 17,665 · +0.3%
- By 2040
- 17,445 · -0.9%
- By 2050
- 16,916 · -3.9%
- By 2075
- 15,807 · -10.2%
- By 2100
- 13,148 · -25.3%
Race, ethnicity, and origin ACS 2023
- Neighborhood character
- Predominantly White (85%)
- Race & ethnicity
- White 85% Black 8% Two or more races 5% Hispanic / Latino 2%
- Common ancestry
- Slovak 3% Lithuanian 2% Iranian 2%
- Foreign-born
- 1%
- Languages at home
- 96% English-only · Spanish 1% German/W. Germanic 1% Chinese 1%
Political lean MEDSL · Cooper
- 2024 margin
- Solid R (+45.8) · D 26.6% · R 72.4% · Other 1.1%
- 2008→2024 swing
- -22.1pp toward R · 2008: -23.8pp · 2024: -45.8pp
- All cycles
- 2024: R+45.8 2020: R+46.3 2016: R+46.3 2012: R+32.1 2008: R+23.8
Not yet ingested
- Civics
- —
Market trends
- HPI YoY
- ▼ -214.93%
- Current HPI
- 213.6529
- Rent YoY
- —
- Metro
- —
- State GDP YoY
- ▲ 1.84%
- F500 in state
- 20
Industry mix (Fortune 500 HQ in MO)
| Industry | F500 HQs | Revenue |
|---|---|---|
| Healthcare | 1 | $163B |
|
||
| Insurance | 1 | $21B |
|
||
| Industrial Technology | 1 | $17B |
|
||
| Retail | 1 | $16B |
|
||
| Industrial Distribution | 1 | $10B |
|
||
| Utilities | 1 | $9B |
|
||
Price history
+102.1% since first listed4 events — show timeline
- 2026-06-17 Price Changed $179,900 CMBR
- 2026-05-11 Listed $185,000 CMBR
- 2012-02-17 Sold (MLS) — CMBR
- 2011-09-20 Listed $89,000 CMBR
Cash-flow waterfall
monthlySold comps — $/sqft
last 12 mo · ≤1 miLoading sold comps…