 🏗️ New Construction
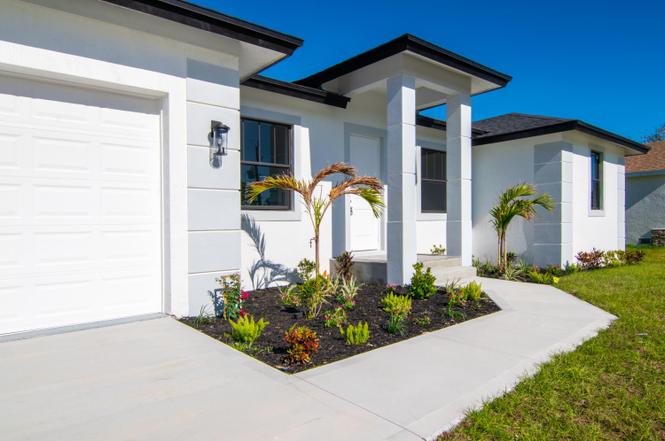
8126 Thruso Rd · Rotonda, FL
Flood risk 9/10 · Severe
- FEMA flood zone
- AE
- Chance of flooding over 30 yrs
- 0.99%
- Est. flood insurance / yr
- $1,737 – $8,500
Fire risk 2/10 · Minimal
- Est. fire insurance / yr
- $947 – $1,759
Heat risk 10/10 · Severe
- Hot days now (above 107°F)
- 7 days/yr
- Hot days in 30 yrs
- 29 days/yr
Wind risk 10/10 · Severe
- Chance of severe wind over 30 yrs
- 99.0%
Air-quality risk 2/10 · Minimal
- Unhealthy air days now
- 1 days/yr
- Unhealthy air days in 30 yrs
- 1 days/yr
Risk factors via First Street. Map © Google.
Why this score? — see what drove the D+ grade
The composite is a weighted blend of 9 inputs, each scored 0–100. Each bar is that input's sub-score; the figure is the points it added to the 100-point composite (weight × sub-score).
- Cash flow +15.8/30.0
- ARV discount +7.5/15.0
- DSCR +4.9/10.0
- Schools +4.6/10.0
- Rent growth +3.8/5.0
- Livability +3.4/5.0
- 1% rule +3.0/10.0
- Condition / age +2.5/5.0
- Appreciation +0.0/10.0
$340,000
🖨 Deal sheet (PDF) 📄 Offer letter ✓ Due diligence
Listing remarks MLS
Wonderful opportunity to build the home of your dreams. Available homesite in growing waterfront community of South Gulf Cove. New houses being built all around. Fishing, boating, golfing, hiking and bike trails are all in vicinity. Access to parks, boat ramp and bike trails. Quiet community but still close to shopping, restaurants, Tampa Bay spring training, County Fairgrounds, Charlotte Harbor/Gulf of Mexico and state parks. Nearby beaches include Stump Pass, Englewood , Boca Grande, and Manasota Key. Seller has many more lots, will consider package.
Key facts
- Modern design
- Single family home
- Modern appliances
Tags
Property features AI
Finance
- Financial info: Pets allowed with no restrictions
- HOA & community: No association amenities
Exterior
- Parking: Attached 2-car garage; Two covered parking spaces; Two open parking spaces
- Utilities: Public water; Public sewer; Three phase electric; Sewer and water available
- Home design: Single-family home; One-story; Entry level living area; North-facing
- Construction: Built with concrete block (CBS); New construction
- Exterior features: Open patio; Patio
Interior
- Kitchen: Dishwasher; Electric range; Microwave; Refrigerator
- Bedrooms: Four bedrooms on the main level
- Flooring: Ceramic tile
- Bathrooms: Two full bathrooms (both on the main level)
- Heating & cooling: Central electric heating; Central electric cooling (central air)
- Interior features: Kitchen island; Walk-in closets; Closet cabinetry
- Laundry & utility: Laundry inside the home
Neighborhood map
What this means for you Summary
Snapshot
- This is a 4-bed/2.0-bath land listed at $340k.
Deal economics
- At list price, monthly cash flow is $-272 ($-3k/yr) — negative.
- To cash-flow at today's rent, offer at most $292k (14.1% below list).
- To meet the 1% rule (rent ≥ 1% of price), the offer needs to be $273k (19.7% below list).
- Recommended offer: $273k (19.7% below list) — sets the bar for 1% rule.
- Cap rate 6.8% vs local median 3.1% in Rotonda — top-decile yield for the area; either an underpriced asset or a hidden risk that comps aren't pricing in. Stress-test before assuming the spread holds.
Location & tenants
- Location reads 67/100 on livability (#548 in FL) — a middle-class / working-renter tenant base. Strengths: crime A+, housing A-, cost of living B+; Watch: amenities F, commute F, health & safety D-.
- Charlotte (suburban): math 54% / reading 54% proficiency, ranked #22 of 73 in FL (top 30%) — acceptable for families but not a draw, mixed tenant base, ~2y average lease.
- Zoned schools: Myakka River Elementary School (math 65% / reading 60%, grade B, #601 of 2,144 statewide, top 28%, 608 students, 51% FRL); L. A. Ainger Middle School (math 65% / reading 53%, grade B, #144 of 571 statewide, top 26%, 720 students, 40% FRL); Lemon Bay High School (math 50% / reading 56%, grade C-, #148 of 667 statewide, top 23%, 1,360 students, 28% FRL).
- Market conditions: Rents rising fast (+5.3%/yr); 2198 active listings in the ZIP; 13 comparable units currently listed for rent nearby; rentals at typical pace (median 23d on market — plan ~3-4 weeks tenant-placement turnaround); solid renter incomes; 4,585 units permitted in Charlotte County in 2024 (703 in 5+ unit buildings).
- This rent runs 39% of the median local income ($84k/yr) — at the standard rent-burdened threshold; future hikes will face affordability resistance.
Forward outlook
- Local home prices are declining (-3.0%/yr); year-one equity from $2k of loan paydown is wiped out by about $10k of value loss. Plan a longer hold.
- Charlotte County population projected at +24% by 2050 — long-run rental-demand tailwind backs the buy-and-hold thesis.
Negotiation context
- It's been on market 472 days — a 12% lower offer ($299k) is reasonable based on typical stale-listing flexibility.
- 13 sale attempts since 22y ago; this cycle's ask is 15011% above the opening price — seller raised mid-cycle; expect resistance to lowballs.
- Current owner paid $10k; list at $340k implies a 3300% gain — meaningful room to come down on a strong offer.
Risks & watch-outs
- Watch-outs: flood insurance adds $427/mo.
- Climate carrying-cost: in FEMA flood zone AE (mandatory federal flood insurance); severe wind risk, 99% chance of damaging wind over 30y; extreme-heat days projected 7→29/yr by 2055 (HVAC capex compounding) — expect insurance premiums to compound above CPI over the hold.
Questions for the listing agent
- What do current leases actually rent for vs. the listed asking? Can we see a recent rent roll and the last 12 months of T-12 income?
- It's been on market 472 days. Have you received any prior offers? Is the seller open to a 20% concession, seller financing, or rate buy-down credit?
- What's the actual annual flood-insurance premium (NFIP or private), and is the property in a SFHA with mandatory coverage?
- Why hasn't it sold? Are there any deal-killer items the seller is aware of (foundation, flood, title, zoning, code violations)?
- Is there a deadline driving the sale (1031 exchange, divorce, estate, relocation)? That informs how much negotiation room exists.
- Schools are D-rated, which usually means shorter tenancies and higher turnover. Who's the typical renter profile here, and what's been the actual vacancy rate?
- The area grade is low — what's the realistic commute time and amenity access for the typical tenant pool here? Any planned neighborhood developments (good or bad) we should know about?
- What's the average days-on-market for RENTAL listings here right now (not sales)? A rising rental-DOM trend means longer vacancies and softer asking-rent achievability than the comps imply.
- What's the recent tenant-quality profile in this submarket — average credit score on applications, eviction rate, late-payment / NSF rate, and stable-employment percentage? A property-management company in the area should have these aggregated.
- How much new for-sale + rental construction is in the pipeline within 1–3 miles? Heavy new supply typically softens prices + rents 12–24 months out; constrained supply supports both.
Investment metrics
- 1% rule
- 0.80% ✗
- Cap rate
- 6.84%
- Cash-on-cash
- 1.95%
- DSCR
- 1.09
- GRM
- 10.4
CMA / ARV
No comps found within radius.
Projected returns pro-forma
-3.0% appreciation · 5.29% rent growth · sell at horizon
- IRR
- -19.4%
- Equity multiple
- 0.31×
- Total profit
- $-65,861
- Equity at exit
- $50,695
- IRR
- -7.8%
- Equity multiple
- 0.46×
- Total profit
- $-51,568
- Equity at exit
- $29,397
Cash invested: $95,200 (down + closing). Projections, not guarantees.
Landlord ↔ Tenant lean methodology
- Overall (STATE)
- 87 Strongly Landlord-Friendly
- State Florida
- 87 Strongly Landlord-Friendly · R+3
- County
- — inherits STATE
- City
- — inherits STATE
ZIP-level market 33981
- Home prices YoY
- -7.5%
- Rents YoY
- 5.3%
- Active inventory
- 2198
- Price-to-rent
- 10.4×
Monthly cashflow live
- Estimated rent
- $2,732 high interval (Pro) →
- Mortgage (P&I)
- −$1,783
- Tax from tax record
- −$78 /mo · $939/yr
- Insurance
- −$142
- Flood insurance flood zone
- −$427 /mo · $5,118/yr
- HOA
- −$0
- Vacancy / Maint / Mgmt
- −$574
- Net cashflow
- $-272
Break-even live
Sensitivity live
| Price | -10% $-79 | -5% $-175 | +0% $-272 | +5% $-368 | +10% $-464 |
|---|---|---|---|---|---|
| Rent | -10% $-487 | -5% $-379 | +0% $-272 | +5% $-164 | +10% $-56 |
| Rate | -1.0pp $-100 | -0.5pp $-185 | base $-272 | +0.5pp $-360 | +1.0pp $-449 |
UW: 25.0% down · 7.5% · 30yr · 1.5% tax · 5.0% vac · 8.0% maint · 8.0% mgmt
Financing live
Cash to close
- Down payment
- $85,000
- Closing costs
- $10,200
- Reserves months
- —
- Total cash needed
- —
Loan-product check · same deal, 3 products live
Conventional
25% down · 7.5% · 30yr
- Down + closing
- —
- Monthly P&I
- —
- Monthly cashflow
- —
- DSCR
- —
- Eligible?
- —
Personal DTI + credit; lowest rate.
DSCR
20% down · 8.5% · 30yr
- Down + closing
- —
- Monthly P&I
- —
- Monthly cashflow
- —
- DSCR
- —
- Eligible?
- —
No personal income docs; deal must DSCR.
Hard money
10% down · 12.0% · 12mo
- Down + closing
- —
- Monthly P&I
- —
- Monthly cashflow
- —
- DSCR
- —
- Eligible?
- —
Short-term bridge; refi at stabilization.
Rent comps 13 comps
| Address | Beds | Baths | Sqft | Rent | $/sqft | DOM | Units | Dist |
|---|---|---|---|---|---|---|---|---|
| 15153 Spanish Point Dr Port Charlotte, FL | 4.0 | 3.0 | 2006 | $3,575 | $1.78 | 23d | 1 | 0.38mi |
| 14295 Overlook Ave Port Charlotte, FL | 3.0 | 2.0 | 1450 | $1,700 | $1.17 | 23d | 1 | 0.57mi |
| 7415 Beckley St Port Charlotte, FL | 3.0 | 2.0 | 1405 | $1,400 | $1.00 | 23d | 1 | 0.60mi |
| 8362 Santa Cruz Dr Port Charlotte, FL | 3.0 | 2.5 | 2016 | $3,500 | $1.74 | 23d | 1 | 0.68mi |
| 7869 Lakes Edge Ln Port Charlotte, FL | 4.0 | 3.0 | 2006 | $2,950 | $1.47 | 23d | 1 | 0.70mi |
| 15077 Acorn Cir Port Charlotte, FL | 3.0 | 2.0 | 2044 | $2,000 | $0.98 | 15d | 1 | 0.73mi |
| 7913 Lakes Edge Ln Port Charlotte, FL | 4.0 | 3.0 | 2006 | $2,950 | $1.47 | 15d | 1 | 0.77mi |
| 14073 Naylor Ave Port Charlotte, FL | 3.0 | 2.0 | 1818 | $2,250 | $1.24 | 23d | 1 | 0.80mi |
| 9379 Snapper Cir Port Charlotte, FL | 4.0 | 2.0 | 2013 | $2,690 | $1.34 | 15d | 1 | 1.27mi |
| 8373 Agate St Unit 8375 Port Charlotte, FL | 3.0 | 2.0 | 1379 | $1,747 | $1.27 | 23d | 1 | 1.33mi |
| 9108 Santa Lucia Dr Port Charlotte, FL | 4.0 | 2.0 | 1917 | $3,100 | $1.62 | 15d | 1 | 1.34mi |
| 13376 Yager Ln Port Charlotte, FL | 3.0 | 2.0 | 2002 | $3,500 | $1.75 | 15d | 1 | 1.42mi |
| 8479 Agate St Port Charlotte, FL | 3.0 | 2.0 | 1379 | $2,495 | $1.81 | 23d | 1 | 1.48mi |
Listing history 50 events
-
2026-06-22days on market $340,000 Active 472 DOM
-
2026-06-18days on market $340,000 Active 469 DOM
-
2026-06-17days on market $340,000 Active 468 DOM
-
2026-06-16days on market $340,000 Active 467 DOM
-
2026-06-15days on market $340,000 Active 466 DOM
-
2026-06-14days on market $340,000 Active 464 DOM
-
2026-06-13pricedays on market $340,000 Active 463 DOM
-
2026-06-10days on market $340,100 Active 461 DOM
-
2026-06-09days on market $340,100 Active 460 DOM
-
2026-06-08pricedays on market $340,100 Active 459 DOM
-
2026-06-05days on market $340,000 Active 455 DOM
-
2026-06-02days on market $340,000 Active 453 DOM
-
2026-06-01days on market $340,000 Active 452 DOM
-
2026-05-31days on market $340,000 Active 451 DOM
-
2026-05-30days on market $340,000 Active 450 DOM
-
2026-05-21price $340,100
-
2026-05-07price $340,000
-
2026-05-01price $2,275
-
2026-04-30price $340,100
-
2026-04-23price $340,000
-
2026-04-16price $340,100
-
2026-04-15$2,250
-
2026-04-15historical $2,275
-
2026-04-09price $340,000
-
2026-03-26price $340,300
-
2026-03-11status Active
-
2026-03-07historical $2,275
-
2026-03-06$2,275
-
2026-02-25historical
-
2026-02-13price $340,200
-
2026-02-05price $340,100
-
2026-01-31price $2,250
-
2026-01-17$2,100
-
2026-01-17historical $2,325
-
2026-01-16price $340,000
-
2026-01-15price $367,500
-
2026-01-10$2,325
-
2026-01-09historical $2,300
-
2026-01-08price $367,400
-
2025-12-25price $2,300
-
2025-12-24price $367,500
-
2025-12-18price $367,400
-
2025-12-16$2,500
-
2025-12-16historical $2,500
-
2025-12-11price $367,500
-
2025-12-06$2,500
-
2025-12-04price $367,400
-
2025-11-27price $367,500
-
2025-11-20price $367,400
-
2025-11-13price $367,500
ⓘ Source: listings_history table (triggers on properties + properties_extension) + one-shot
backfill from property_details.listing_events for pre-trigger history.
Tax reassessment forecast FL · Resets to sale price
- Current annual tax
- $939 · $78/mo
- Projected year-2 tax
- $2,822 · $235/mo
- Expected delta
- +$1,883/yr (+$157/mo · 200.5%)
ⓘ Screening estimate from a state-policy table — verify with the county assessor before closing.
Climate risk First Street
- Flood 9/10 Extreme FEMA zone AE · 99% chance over 30 yrs
- Wildfire 2/10 Low
- Heat 10/10 Extreme 7 d/yr ≥107°F today · 29 d/yr by 30 yrs out
- Wind 10/10 Extreme 99% chance of damaging wind over 30 yrs
- Air quality 2/10 Low 1 unhealthy d/yr today · 1 by 30 yrs out
Nearby sold comps map
Loading sold comps map…
Walkable amenities ~0.75 mi
Loading nearby amenities…
Taxation est. · year 1
- Rental income
- $32,779
- − Mortgage interest
- −$19,045
- − Property taxes
- −$939
- − Insurance
- −$6,818
- − Repairs & maintenance
- −$2,622
- − Management
- −$2,622
- − Depreciation
- −$9,891
- Taxable loss
- −$9,160
- Est. tax savings @ 24.0%
- +$2,198
- After-tax cash flow
- $-1,060/yr
For passive investors: Depreciation is non-cash, so a rental often shows a tax loss while cash-flowing — sheltering income. Rental losses are passive: they offset passive income freely, and up to $25,000/yr can offset ordinary (W-2) income if you actively participate and your MAGI is under $100k (phasing out to $0 by $150k); unused losses carry forward. On sale, claimed depreciation is recaptured at up to 25%, and gains may owe capital-gains tax (a 1031 exchange can defer both). Figures are a year-1 estimate at your 24.0% rate — not tax advice; consult a CPA.
Schools (NCES district)
- District
- Charlotte
- NCES district ID
- 1200240
- Math proficiency
- 54% ▼ -6.00%
- Reading proficiency
- 54% ▼ -1.00%
- Median HH income
- $44,864
- Composite
- 45.62/100
- National rank
- #2586
- State rank
- #22 of 73 in FL
Livability — Rotonda
- Score
- 67/100
- State rank
- #548
- US rank
- #10359
Category grades
Schools grade is shown separately in the Schools card above.
Census & demographics
- County
- Charlotte County · 196,994 people
- City population
- 75,324
- Metro
- Punta Gorda, FL
- Population (ZIP)
- 15,622
- Household income
- $84,098
- Rent vs Own
- Severe rent burden
- 105.0
Population outlook (Charlotte County) Hauer SSP2
- Today (2025)
- 198,646 people
- By 2030
- 210,507 · +6.0%
- By 2040
- 230,857 · +16.2%
- By 2050
- 247,148 · +24.4%
- By 2075
- 281,777 · +41.8%
- By 2100
- 293,609 · +47.8%
Race, ethnicity, and origin ACS 2023
- Neighborhood character
- Predominantly White (89%)
- Race & ethnicity
- White 89% Two or more races 4% Hispanic / Latino 4% Black 2% Asian 1%
- Common ancestry
- Romanian 4% Lithuanian 3% Italian 2%
- Foreign-born
- 6% · Canada
- Languages at home
- 96% English-only · Spanish 1% German/W. Germanic 1% Tagalog/Filipino 1%
Political lean MEDSL · Charlotte
- 2024 margin
- Solid R (+34.0) · D 32.7% · R 66.7%
- 2008→2024 swing
- -26.7pp toward R · 2008: -7.2pp · 2024: -34.0pp
- All cycles
- 2024: R+34.0 2020: R+26.6 2016: R+27.8 2012: R+14.3 2008: R+7.2
Not yet ingested
- Civics
- —
Market trends
- HPI YoY
- ▼ -28.09%
- Current HPI
- 346.5247
- Rent YoY
- ▲ 5.29%
- Metro
- Punta Gorda, FL
- State GDP YoY
- ▲ 3.28%
- F500 in state
- 36
Industry mix (Fortune 500 HQ in FL)
| Industry | F500 HQs | Revenue |
|---|---|---|
| Industrial Technology | 2 | $29B |
|
||
| Insurance | 2 | $17B |
|
||
| Retail | 1 | $60B |
|
||
| Technology Distribution | 1 | $58B |
|
||
| Homebuilding | 1 | $35B |
|
||
| Technology Manufacturing | 1 | $35B |
|
||
Price history
+581.6% since first listed97 events — show timeline
- 2026-05-21 Price Changed $340,100 Beaches MLS
- 2026-05-07 Price Changed $340,000 Beaches MLS
- 2026-05-01 Price Changed $2,275 RMLSFL
- 2026-04-30 Price Changed $340,100 Beaches MLS
- 2026-04-23 Price Changed $340,000 Beaches MLS
- 2026-04-16 Price Changed $340,100 Beaches MLS
- 2026-04-15 Listed for Rent $2,250 RMLSFL
- 2026-04-15 Rental Removed $2,275 STELLARMLS
- 2026-04-09 Price Changed $340,000 Beaches MLS
- 2026-03-26 Price Changed $340,300 Beaches MLS
- 2026-03-11 Relisted — Beaches MLS
- 2026-03-07 Rental Removed $2,275 GFLMLS
- 2026-03-06 Listed for Rent $2,275 GFLMLS
- 2026-02-25 Listing Removed — Beaches MLS
- 2026-02-13 Price Changed $340,200 Beaches MLS
- 2026-02-05 Price Changed $340,100 Beaches MLS
- 2026-01-31 Price Changed $2,250 STELLARMLS
- 2026-01-17 Listed for Rent $2,100 STELLARMLS
- 2026-01-17 Rental Removed $2,325 GFLMLS
- 2026-01-16 Price Changed $340,000 Beaches MLS
- 2026-01-15 Price Changed $367,500 Beaches MLS
- 2026-01-10 Listed for Rent $2,325 GFLMLS
- 2026-01-09 Rental Removed $2,300 STELLARMLS
- 2026-01-08 Price Changed $367,400 Beaches MLS
- 2025-12-25 Price Changed $2,300 STELLARMLS
- 2025-12-24 Price Changed $367,500 Beaches MLS
- 2025-12-18 Price Changed $367,400 Beaches MLS
- 2025-12-16 Listed for Rent $2,500 STELLARMLS
- 2025-12-16 Rental Removed $2,500 GFLMLS
- 2025-12-11 Price Changed $367,500 Beaches MLS
- 2025-12-06 Listed for Rent $2,500 GFLMLS
- 2025-12-04 Price Changed $367,400 Beaches MLS
- 2025-11-27 Price Changed $367,500 Beaches MLS
- 2025-11-20 Price Changed $367,400 Beaches MLS
- 2025-11-13 Price Changed $367,500 Beaches MLS
- 2025-11-06 Price Changed $367,000 Beaches MLS
- 2025-11-04 Price Changed $367,500 Beaches MLS
- 2025-10-28 Price Changed $368,000 Beaches MLS
- 2025-10-16 Price Changed $368,500 Beaches MLS
- 2025-10-02 Price Changed $368,400 Beaches MLS
- 2025-09-25 Price Changed $368,500 Beaches MLS
- 2025-09-18 Price Changed $368,000 Beaches MLS
- 2025-09-11 Price Changed $368,500 Beaches MLS
- 2025-09-04 Price Changed $368,000 Beaches MLS
- 2025-08-28 Price Changed $368,900 Beaches MLS
- 2025-08-21 Price Changed $369,000 Beaches MLS
- 2025-08-21 Relisted — Beaches MLS
- 2025-08-19 Listing Removed — Beaches MLS
- 2025-08-15 Price Changed $368,900 Beaches MLS
- 2025-07-31 Price Changed $369,000 Beaches MLS
- 2025-07-24 Price Changed $368,900 Beaches MLS
- 2025-07-17 Price Changed $369,000 Beaches MLS
- 2025-07-17 Price Changed $369,000 Stellar MLS as Distributed by MLS Grid
- 2025-07-10 Price Changed $365,000 Beaches MLS
- 2025-07-03 Price Changed $360,000 Beaches MLS
- 2025-07-03 Price Changed $360,000 Stellar MLS as Distributed by MLS Grid
- 2025-06-26 Price Changed $368,700 Beaches MLS
- 2025-06-26 Price Changed $368,700 Stellar MLS as Distributed by MLS Grid
- 2025-06-19 Price Changed $368,800 Beaches MLS
- 2025-06-19 Price Changed $368,800 Stellar MLS as Distributed by MLS Grid
- 2025-06-12 Price Changed $368,700 Beaches MLS
- 2025-06-12 Price Changed $368,700 Stellar MLS as Distributed by MLS Grid
- 2025-06-05 Price Changed $368,600 Beaches MLS
- 2025-06-05 Price Changed $368,600 Stellar MLS as Distributed by MLS Grid
- 2025-05-29 Price Changed $368,700 Beaches MLS
- 2025-05-29 Price Changed $368,700 Stellar MLS as Distributed by MLS Grid
- 2025-05-22 Price Changed $368,800 Stellar MLS as Distributed by MLS Grid
- 2025-05-22 Price Changed $368,800 Beaches MLS
- 2025-05-15 Price Changed $368,900 Stellar MLS as Distributed by MLS Grid
- 2025-05-15 Price Changed $368,900 Beaches MLS
- 2025-05-08 Price Changed $369,000 Beaches MLS
- 2025-05-08 Price Changed $369,000 Stellar MLS as Distributed by MLS Grid
- 2025-05-02 Price Changed $368,900 Beaches MLS
- 2025-05-02 Price Changed $368,900 Stellar MLS as Distributed by MLS Grid
- 2025-04-17 Price Changed $369,100 Beaches MLS
- 2025-04-10 Price Changed $369,000 Beaches MLS
- 2025-04-10 Price Changed $369,000 Stellar MLS as Distributed by MLS Grid
- 2025-04-03 Price Changed $378,500 Beaches MLS
- 2025-04-03 Price Changed $378,500 Stellar MLS as Distributed by MLS Grid
- 2025-03-27 Price Changed $378,600 Beaches MLS
- 2025-03-27 Price Changed $378,600 Stellar MLS as Distributed by MLS Grid
- 2025-03-13 Price Changed $378,500 Beaches MLS
- 2025-03-10 Price Changed $378,000 Beaches MLS
- 2025-02-27 Price Changed $378,500 Beaches MLS
- 2025-02-27 Price Changed $378,500 Stellar MLS as Distributed by MLS Grid
- 2025-02-18 Listed $379,000 Beaches MLS
- 2021-07-14 Sold (MLS) $10,000 Stellar MLS as Distributed by MLS Grid
- 2021-07-09 Sold (Public Records) $10,000 Public Records
- 2021-04-20 Pending — Stellar MLS as Distributed by MLS Grid
- 2021-04-07 Price Changed $15,000 Stellar MLS as Distributed by MLS Grid
- 2021-03-15 Price Changed $13,800 Stellar MLS as Distributed by MLS Grid
- 2020-06-15 Listed $11,500 Stellar MLS as Distributed by MLS Grid
- 2009-12-14 Listed $5,500 Stellar MLS as Distributed by MLS Grid
- 2006-02-13 Listed $79,900 Stellar MLS as Distributed by MLS Grid
- 2005-07-06 Sold (Public Records) $49,000 Public Records
- 2005-03-31 Sold (MLS) $49,000 Stellar MLS as Distributed by MLS Grid
- 2004-12-22 Listed $49,900 Stellar MLS as Distributed by MLS Grid
Property tax history
+7.9%/yrLatest (2025): $939 · +51.3% YoY. Source: county tax records.
Cash-flow waterfall
monthlySold comps — $/sqft
last 12 mo · ≤1 miLoading sold comps…