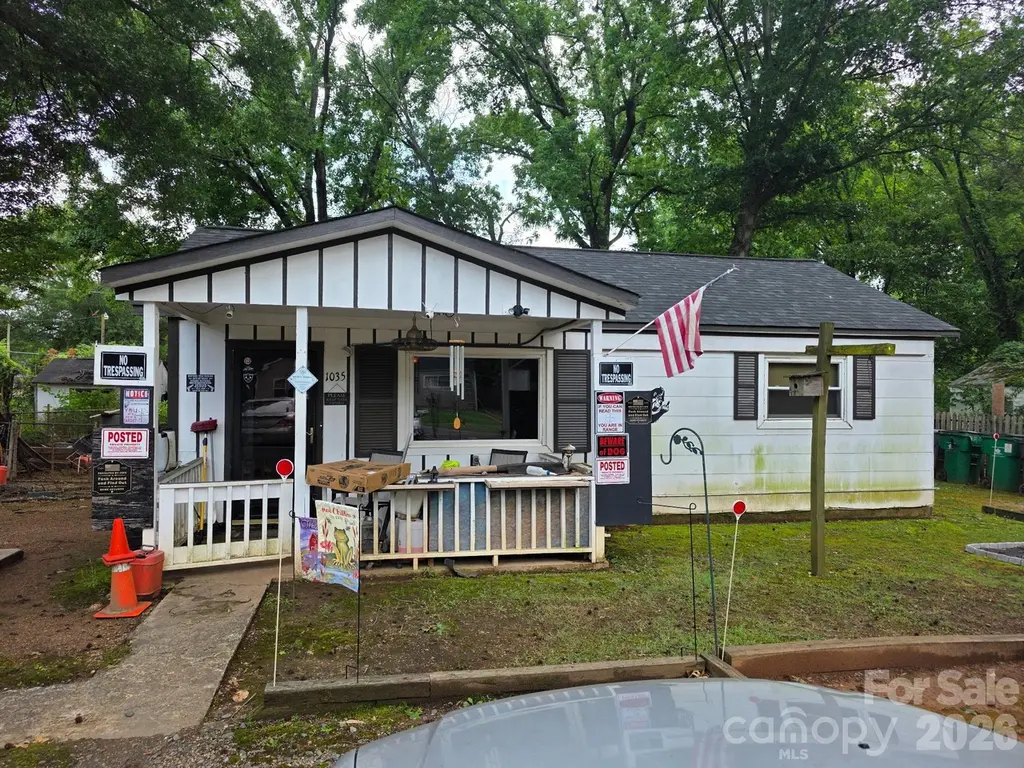
1035 Nations Dr · Charlotte, NC
Flood risk 1/10 · Minimal
- FEMA flood zone
- X (unshaded)
- Chance of flooding over 30 yrs
- 0.0%
- Est. flood insurance / yr
- $507 – $1,088
Fire risk 1/10 · Minimal
- Est. fire insurance / yr
- $906 – $1,684
Heat risk 6/10 · Moderate
- Hot days now (above 104°F)
- 7 days/yr
- Hot days in 30 yrs
- 16 days/yr
Wind risk 6/10 · Moderate
- Chance of severe wind over 30 yrs
- 27.0%
Air-quality risk 3/10 · Minor
- Unhealthy air days now
- 3 days/yr
- Unhealthy air days in 30 yrs
- 4 days/yr
Risk factors via First Street. Map © Google.
Why this score? — see what drove the D grade
The composite is a weighted blend of 9 inputs, each scored 0–100. Each bar is that input's sub-score; the figure is the points it added to the 100-point composite (weight × sub-score).
- Cash flow +14.2/30.0
- ARV discount +9.3/15.0
- DSCR +4.3/10.0
- Livability +3.9/5.0
- Schools +3.8/10.0
- 1% rule +3.0/10.0
- Rent growth +2.5/5.0
- Condition / age +2.5/5.0
- Appreciation +0.0/10.0
$170,000
🖨 Deal sheet (PDF) 📄 Offer letter ✓ Due diligence
Listing remarks
Welcome home! This charming property is perfectly situated in southwest Charlotte, just 15 minutes from uptown and 15 minutes from Charlotte Douglas International Airport. Conveniently located to I-77 and nearby shopping, everything you need is within easy reach. Enjoy peace of mind with a brand new roof covering installed in 2023 and freshly painted bedrooms ready for your personal touch. Whether you are looking to renovate for resale or build your rental portfolio, this property is full of potential. Do not wait -- schedule your showing before it is gone!
Key facts
- 0.25 acre lot
- Built 1951
- Listed 6 days
Property features AI
Finance
- HOA & community: No HOA
Exterior
- Parking: Driveway
- Utilities: City water; Public sewer
- Home design: Single-family residence; Site-built construction; One story; N1-B zoning
- Construction: Asbestos, wood, and shingle/shake exterior materials; Slab foundation
- Exterior features: Concrete and paved road frontage; Publicly maintained road
Interior
- Kitchen: Electric oven
- Bedrooms: Two bedrooms on the main level
- Bathrooms: One full bathroom on the main level
- Heating & cooling: No central heating; Window unit(s) for cooling
- Interior features: Four total rooms; Electric oven
- Laundry & utility: Washer hookup; Electric dryer hookup
Neighborhood map
What this means for you Summary
Snapshot
- This is a 2-bed/1.0-bath single-family listed at $170k.
Deal economics
- At list price, monthly cash flow is $29 ($352/yr) — positive.
- The deal already cash-flows at list — no discount required.
- To meet the 1% rule (rent ≥ 1% of price), the offer needs to be $137k (19.7% below list).
- Recommended offer: $137k (19.7% below list) — sets the bar for 1% rule.
- Cap rate 6.5% vs local median 3.1% in Charlotte — top-decile yield for the area; either an underpriced asset or a hidden risk that comps aren't pricing in. Stress-test before assuming the spread holds.
Location & tenants
- Location reads 78/100 on livability (#26 in NC, #2,502 nationally) — a middle-class / working-renter tenant base. Strengths: amenities A+, commute A+, housing A+; Watch: crime F.
- Charlotte-Mecklenburg Schools (urban): math 42% / reading 46% proficiency, ranked #85 of 178 in NC (top 48%) — families likely to look elsewhere, expect single-tenant / working-renter base with shorter leases.
- Zoned schools: Nations Ford Elementary (math 12% / reading 13%, grade F, #1,360 of 1,410 statewide, top 97%, 624 students, 98% FRL); Olympic High School (math 50% / reading 55%, grade C-, #287 of 535 statewide, top 54%, 1,729 students, 41% FRL) — zoned schools average 70% FRL vs 49% district-wide (21 pts higher); higher-poverty schools than district average — tighter screening recommended.
- Market conditions: Rents flat; 177 active listings in the ZIP; 18 comparable units currently listed for rent nearby; rentals leasing fast (median 8d on market — plan ~1-2 weeks tenant-placement turnaround); 11,969 units permitted in Mecklenburg County in 2024 (5,377 in 5+ unit buildings).
Forward outlook
- Local home prices are declining (-3.0%/yr); year-one equity from $1k of loan paydown is wiped out by about $5k of value loss. Plan a longer hold.
- Mecklenburg County population projected at +53% by 2050 — long-run rental-demand tailwind backs the buy-and-hold thesis.
Negotiation context
- Only 7 days on market — expect competitive offers; lowballing is unlikely to land.
- Current owner paid $48k; list at $170k implies a 254% gain — meaningful room to come down on a strong offer.
Risks & watch-outs
- Watch-outs: built in 1951 — expect roof / HVAC / electrical / plumbing capex.
- Climate carrying-cost: major wind risk, 27% chance of damaging wind over 30y; extreme-heat days projected 7→16/yr by 2055 (HVAC capex compounding) — expect insurance premiums to compound above CPI over the hold.
Questions for the listing agent
- Built in 1951 — when were the roof, HVAC, electrical panel, plumbing, and water heater last replaced?
- Is there a deadline driving the sale (1031 exchange, divorce, estate, relocation)? That informs how much negotiation room exists.
- Schools are D-rated, which usually means shorter tenancies and higher turnover. Who's the typical renter profile here, and what's been the actual vacancy rate?
- Crime grade is F in this area — have there been break-ins, vandalism, or insurance claims at this property in the last 3 years? What carrier currently insures it and at what premium?
- The area grade is low — what's the realistic commute time and amenity access for the typical tenant pool here? Any planned neighborhood developments (good or bad) we should know about?
- What's the average days-on-market for RENTAL listings here right now (not sales)? A rising rental-DOM trend means longer vacancies and softer asking-rent achievability than the comps imply.
- What's the recent tenant-quality profile in this submarket — average credit score on applications, eviction rate, late-payment / NSF rate, and stable-employment percentage? A property-management company in the area should have these aggregated.
- How much new for-sale + rental construction is in the pipeline within 1–3 miles? Heavy new supply typically softens prices + rents 12–24 months out; constrained supply supports both.
Investment metrics
- 1% rule
- 0.80% ✗
- Cap rate
- 6.50%
- Cash-on-cash
- 0.74%
- DSCR
- 1.03
- GRM
- 10.4
CMA / ARV
- ARV (on-the-fly)
- $177,072
- Comps found
- 4
Show comp detail 4 sales within ~0.75 mi
| Address | Dist | Beds/Ba | Sqft | Sold | Price | $/sf | Match |
|---|---|---|---|---|---|---|---|
| 1017 Nations Dr | 0.04mi | 2/1.0 | 712 (-0%) | 5mo | $120,000 | $169 | 94 |
| 1127 Nations Dr | 0.08mi | 2/1.0 | 714 (0%) | 8mo | $180,000 | $252 | 90 |
| 1145 Nations Dr | 0.12mi | 2/1.0 | 722 (+1%) | 16mo | $145,000 | $201 | 80 |
| 1356 Choyce Ave | 0.35mi | 2/1.0 | 808 (+13%) | 6mo | $200,000 | $248 | 57 |
Match score weights: distance 35% · size 25% · config 20% · recency 20%. Top-matched comps best support the ARV.
Projected returns pro-forma
-3.0% appreciation · 0.04% rent growth · sell at horizon
- IRR
- -18.2%
- Equity multiple
- 0.38×
- Total profit
- $-29,685
- Equity at exit
- $25,348
- IRR
- -16.8%
- Equity multiple
- 0.18×
- Total profit
- $-38,949
- Equity at exit
- $14,698
Cash invested: $47,600 (down + closing). Projections, not guarantees.
Landlord ↔ Tenant lean methodology
- Overall (STATE)
- 85 Strongly Landlord-Friendly
- State North Carolina
- 85 Strongly Landlord-Friendly · R+3
- County
- — inherits STATE
- City
- — inherits STATE
ZIP-level market 28217
- Home prices YoY
- -14.8%
- Rents YoY
- 0.0%
- Active inventory
- 177
- Price-to-rent
- 10.4×
Monthly cashflow live
- Estimated rent
- $1,366 high interval (Pro) →
- Mortgage (P&I)
- −$891
- Tax from tax record
- −$87 /mo · $1,046/yr
- Insurance
- −$71
- HOA
- −$0
- Vacancy / Maint / Mgmt
- −$287
- Net cashflow
- $29
Break-even live
Sensitivity live
| Price | -10% $126 | -5% $77 | +0% $29 | +5% $-19 | +10% $-67 |
|---|---|---|---|---|---|
| Rent | -10% $-79 | -5% $-25 | +0% $29 | +5% $83 | +10% $137 |
| Rate | -1.0pp $115 | -0.5pp $73 | base $29 | +0.5pp $-15 | +1.0pp $-60 |
UW: 25.0% down · 7.5% · 30yr · 1.5% tax · 5.0% vac · 8.0% maint · 8.0% mgmt
Financing live
Cash to close
- Down payment
- $42,500
- Closing costs
- $5,100
- Reserves months
- —
- Total cash needed
- —
Loan-product check · same deal, 3 products live
Conventional
25% down · 7.5% · 30yr
- Down + closing
- —
- Monthly P&I
- —
- Monthly cashflow
- —
- DSCR
- —
- Eligible?
- —
Personal DTI + credit; lowest rate.
DSCR
20% down · 8.5% · 30yr
- Down + closing
- —
- Monthly P&I
- —
- Monthly cashflow
- —
- DSCR
- —
- Eligible?
- —
No personal income docs; deal must DSCR.
Hard money
10% down · 12.0% · 12mo
- Down + closing
- —
- Monthly P&I
- —
- Monthly cashflow
- —
- DSCR
- —
- Eligible?
- —
Short-term bridge; refi at stabilization.
Rent comps 18 comps
| Address | Beds | Baths | Sqft | Rent | $/sqft | DOM | Units | Dist |
|---|---|---|---|---|---|---|---|---|
| 825 Farmhurst Dr Unit 839-C Charlotte, NC | 1.0 | 1.0 | 679 | $975 | $1.44 | 24d | 1 | 0.51mi |
| 825 Farmhurst Dr Unit 700-J Charlotte, NC | 1.0 | 1.0 | 721 | $1,050 | $1.46 | 8d | 1 | 0.51mi |
| 825 Farmhurst Dr Unit 700-P Charlotte, NC | 1.0 | 1.0 | 679 | $960 | $1.41 | 24d | 1 | 0.51mi |
| 825 Farmhurst Dr Unit 720-X Charlotte, NC | 1.0 | 1.0 | 679 | $975 | $1.44 | 11d | 1 | 0.51mi |
| 825 Farmhurst Dr Unit 829-B Charlotte, NC | 1.0 | 1.0 | 721 | $1,050 | $1.46 | 24d | 1 | 0.51mi |
| 639 Archdale Dr Charlotte, NC | 1.0–3.0 | 1.0–2.0 | 1030 | $1,346 | $1.31 | 4d | 16 | 0.53mi |
| 711 Farmhurst Dr Charlotte, NC | 1.0–2.0 | 1.0 | 780 | $1,199 | $1.54 | 24d | 1 | 0.59mi |
| 5816 Westpark Dr Charlotte, NC | 2.0 | 1.0–2.0 | 677 | $1,709 | $2.52 | 2d | 17 | 0.72mi |
| 6310 Ansley Falls Dr Charlotte, NC | 1.0–3.0 | 1.0–2.0 | 964 | $1,701 | $1.76 | 2d | 36 | 0.76mi |
| 6530 Free Throw Ln Charlotte, NC | 1.0–2.0 | 1.0–2.0 | 908 | $1,705 | $1.88 | 2d | 30 | 0.78mi |
| 5029 Cherrycrest Ln Charlotte, NC | 1.0–3.0 | 1.0–2.0 | 1000 | $1,465 | $1.47 | 3d | 19 | 0.84mi |
| 905 Pineville Point Ave Charlotte, NC | 1.0–3.0 | 1.0–2.0 | 1019 | $1,562 | $1.53 | 2d | 73 | 0.91mi |
| 103 Dinadan Dr Charlotte, NC | 1.0–3.0 | 1.0–2.0 | 928 | $1,362 | $1.47 | 24d | 1 | 0.96mi |
| 220 Branchview Dr Charlotte, NC | 1.0–2.0 | 1.0–1.5 | 855 | $1,725 | $2.02 | 24d | 1 | 1.04mi |
| 8508 Lodge South Cir Charlotte, NC | 3.0 | 1.0–2.0 | 897 | $1,431 | $1.59 | 3d | 17 | 1.14mi |
| 1525 W Arrowood Rd Charlotte, NC | 1.0–3.0 | 1.0–2.0 | 737 | $1,699 | $2.30 | 16d | 7 | 1.16mi |
| 9056 Arborgate Dr Charlotte, NC | 1.0–2.0 | 1.0–2.0 | 786 | $1,499 | $1.91 | 4d | 1 | 1.35mi |
| 1322 Beacon Ridge Rd Charlotte, NC | 1.0–2.0 | 1.0–2.0 | 804 | $1,757 | $2.18 | 2d | 49 | 1.46mi |
Listing history 9 events
-
2026-06-18days on market $170,000 Active 7 DOM
-
2026-06-17days on market $170,000 Active 6 DOM
-
2026-06-16days on market $170,000 Active 5 DOM
-
2026-06-15days on market $170,000 Active 4 DOM
-
2026-06-13statusdays on market $170,000 Active 2 DOM
-
2026-06-09days on market $170,000 Coming Soon 5 DOM
-
2026-06-08days on market $170,000 Coming Soon 4 DOM
-
2026-06-07remarks 563-char remark
-
2026-06-07$170,000 Coming Soon 3 DOM
ⓘ Source: listings_history table (triggers on properties + properties_extension) + one-shot
backfill from property_details.listing_events for pre-trigger history.
Tax reassessment forecast NC · Resets to sale price
- Current annual tax
- $1,046 · $87/mo
- Projected year-2 tax
- $1,394 · $116/mo
- Expected delta
- +$348/yr (+$29/mo · 33.3%)
ⓘ Screening estimate from a state-policy table — verify with the county assessor before closing.
Climate risk First Street
- Flood 1/10 Low FEMA zone X (unshaded) · 0% chance over 30 yrs
- Wildfire 1/10 Low
- Heat 6/10 Major 7 d/yr ≥104°F today · 16 d/yr by 30 yrs out
- Wind 6/10 Major 27% chance of damaging wind over 30 yrs
- Air quality 3/10 Moderate 3 unhealthy d/yr today · 4 by 30 yrs out
Nearby sold comps map
Loading sold comps map…
Walkable amenities ~0.75 mi
Loading nearby amenities…
Taxation est. · year 1
- Rental income
- $16,387
- − Mortgage interest
- −$9,523
- − Property taxes
- −$1,046
- − Insurance
- −$850
- − Repairs & maintenance
- −$1,311
- − Management
- −$1,311
- − Depreciation
- −$4,945
- Taxable loss
- −$2,599
- Est. tax savings @ 24.0%
- +$624
- After-tax cash flow
- $976/yr
For passive investors: Depreciation is non-cash, so a rental often shows a tax loss while cash-flowing — sheltering income. Rental losses are passive: they offset passive income freely, and up to $25,000/yr can offset ordinary (W-2) income if you actively participate and your MAGI is under $100k (phasing out to $0 by $150k); unused losses carry forward. On sale, claimed depreciation is recaptured at up to 25%, and gains may owe capital-gains tax (a 1031 exchange can defer both). Figures are a year-1 estimate at your 24.0% rate — not tax advice; consult a CPA.
Schools (NCES district)
- District
- Charlotte-Mecklenburg Schools
- NCES district ID
- 3702970
- Math proficiency
- 42% ▼ -6.00%
- Reading proficiency
- 46% ▲ 1.00%
- Median HH income
- $57,175
- Composite
- 38.49/100
- National rank
- #4183
- State rank
- #85 of 178 in NC
Livability — Charlotte
- Score
- 78/100
- State rank
- #26
- US rank
- #2502
Category grades
Schools grade is shown separately in the Schools card above.
Census & demographics
- Census place
- Charlotte, NC
- County
- Mecklenburg County · 1,167,319 people
- City population
- 920,422
- Metro
- Charlotte-Concord-Gastonia, NC-SC
- Population (ZIP)
- 32,064
- Household income
- $64,028
- Rent vs Own
- Severe rent burden
- 2144.0
Population outlook (Mecklenburg County) Hauer SSP2
- Today (2025)
- 1,305,740 people
- By 2030
- 1,442,752 · +10.5%
- By 2040
- 1,722,441 · +31.9%
- By 2050
- 1,999,450 · +53.1%
- By 2075
- 2,642,495 · +102.4%
- By 2100
- 3,106,755 · +137.9%
Race, ethnicity, and origin ACS 2023
- Neighborhood character
- Highly diverse neighborhood (Simpson 0.71)
- Race & ethnicity
- Hispanic / Latino 37% Black 35% Two or more races 19% White 17% Asian 8%
- Hispanic origin (detail)
- Mexican 7% Dominican 2%
- Common ancestry
- Swiss 2% Italian 1% Slovak 1%
- Foreign-born
- 34% · Canada, Jamaica, Vietnam
- Languages at home
- 58% English-only · Spanish 35% Other Indo-European 2% Other Asian/Pacific 2%
Political lean MEDSL · Mecklenburg
- 2024 margin
- Solid D (+32.9) · D 65.6% · R 32.7% · Other 1.6%
- 2008→2024 swing
- +8.5pp toward D · 2008: 24.4pp · 2024: 32.9pp
- All cycles
- 2024: D+32.9 2020: D+35.1 2016: D+29.9 2012: D+22.5 2008: D+24.4
Not yet ingested
- Civics
- —
Market trends
- HPI YoY
- ▼ -57.23%
- Current HPI
- 330.7033
- Rent YoY
- ▬ 0.04%
- Metro
- Charlotte-Concord-Gastonia, NC-SC
- State GDP YoY
- ▲ 3.28%
- F500 in state
- 26
Industry mix (Fortune 500 HQ in NC)
| Industry | F500 HQs | Revenue |
|---|---|---|
| Financial Services | 2 | $213B |
|
||
| Retail | 2 | $95B |
|
||
| Industrial Conglomerate | 1 | $38B |
|
||
| Metals / Steel | 1 | $35B |
|
||
| Utilities | 1 | $30B |
|
||
| Industrial Machinery | 1 | $19B |
|
||
Price history
+359.5% since first listed3 events — show timeline
- 2026-06-05 Coming Soon $170,000 CANOPYMLS as Distributed by MLS Grid
- 2006-07-31 Sold (Public Records) $48,000 Public Records
- 1994-09-06 Sold (Public Records) $37,000 Public Records
Property tax history
+3.3%/yrLatest (2025): $1,046 · +3.2% YoY. Source: county tax records.
Cash-flow waterfall
monthlySold comps — $/sqft
last 12 mo · ≤1 miLoading sold comps…