15252 Seneca Rd #13 · Victorville, CA
Flood risk 1/10 · Minimal
- FEMA flood zone
- X (unshaded)
- Chance of flooding over 30 yrs
- 0.0%
- Est. flood insurance / yr
- $507 – $1,088
Fire risk 5/10 · Moderate
- Est. fire insurance / yr
- $659 – $1,223
Heat risk 7/10 · Major
- Hot days now (above 99°F)
- 1 days/yr
- Hot days in 30 yrs
- 4 days/yr
Wind risk 1/10 · Minimal
- Chance of severe wind over 30 yrs
- —
Air-quality risk 9/10 · Severe
- Unhealthy air days now
- 22 days/yr
- Unhealthy air days in 30 yrs
- 28 days/yr
Risk factors via First Street. Map © Google.
Why this score? — see what drove the C+ grade
The composite is a weighted blend of 9 inputs, each scored 0–100. Each bar is that input's sub-score; the figure is the points it added to the 100-point composite (weight × sub-score).
- Cash flow +30.0/30.0
- 1% rule +10.0/10.0
- DSCR +10.0/10.0
- Rent growth +4.1/5.0
- Livability +2.7/5.0
- Condition / age +2.5/5.0
- Appreciation +2.4/10.0
- Schools +2.2/10.0
- ARV discount +0.0/15.0
$109,000
🖨 Deal sheet 📄 Offer letter ✓ Due diligence
Listing remarks
Gorgeous BRAND NEW manufactured home in a nice gated family park! 5% down available and low monthly payments! Excellent location! Nice, gated family park.
Key facts
- 2 parking spots
- Built 2025
- Listed 231 days
Property features AI
Finance
- Other: Park name: Gold West; Located north of Seneca
- HOA & community: Street lighting in the community; Land lease applies (approximately $800)
Exterior
- Parking: 2 parking spaces; 2 carport spaces; Located in Gold West park
- Utilities: Public sewer; District/public water
- Home design: Single-story manufactured/mobile home (model: Canyon Lake); Mobile home remains on site; Mobile dimensions approximately 15 ft wide by 56 ft long
- Construction: Year built reported by seller
- Exterior features: Front yard; No pool
Interior
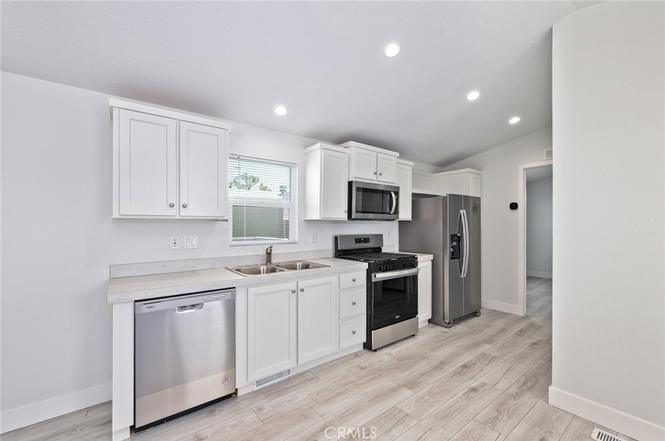
- Kitchen: No specific kitchen appliance details provided
- Bedrooms: Single-level layout
- Bathrooms: 2 full bathrooms
- Heating & cooling: Has cooling (details in remarks)
- Interior features: One-level home; Entry on the main level
- Laundry & utility: Laundry area inside the home
Neighborhood map
What this means for you Summary
Snapshot
- This is a 3-bed/2.0-bath manufactured listed at $109k.
Deal economics
- At list price, monthly cash flow is $1k ($14k/yr) — positive.
- The deal already cash-flows at list — no discount required.
- Meets the 1% rule at list price ($2k rent vs $109k).
- Recommended offer: $96k (12.0% below list) — sets the bar for market timing.
- Cap rate 19.0% vs local median 4.2% in Victorville — top-decile yield for the area; either an underpriced asset or a hidden risk that comps aren't pricing in. Stress-test before assuming the spread holds.
Location & tenants
- Location reads 54/100 on livability (#906 in CA) — a working-class tenant base; expect higher turnover. Strengths: housing A+; Watch: employment D+, schools D-, crime F.
- Victor Elementary (urban): math 25% / reading 25% proficiency, ranked #408 of 517 in CA (top 79%) — low school quality limits family demand, transient renter base, plan for 1-2y turnover; 70% free/reduced lunch — lower-income household profile, screen leases tightly.
- Market conditions: Rents rising fast (+6.5%/yr); 166 active listings in the ZIP; 7 comparable units currently listed for rent nearby; rentals leasing fast (median 2d on market — plan ~1-2 weeks tenant-placement turnaround); solid renter incomes; 5,458 units permitted in San Bernardino County in 2024 (1,500 in 5+ unit buildings).
- This rent runs 37% of the median local income ($78k/yr) — at the standard rent-burdened threshold; future hikes will face affordability resistance.
Forward outlook
- Local home prices are declining (-3.0%/yr); year-one equity from $754 of loan paydown is wiped out by about $3k of value loss. Plan a longer hold.
- San Bernardino County population projected at +15% by 2050 — modest demand growth; plan on rents tracking national, not racing it.
- At projected returns (-3.0% appreciation + 6.5% rent growth), your $31k cash investment doubles in ~3 years — after that, you're playing with house money.
Negotiation context
- It's been on market 231 days — a 12% lower offer ($96k) is reasonable based on typical stale-listing flexibility.
- 2 sale attempts; this cycle's ask has dropped $20k (16%) from the opening price — seller is motivated, your offer sets the floor, not the list.
Risks & watch-outs
- Climate carrying-cost: moderate wildfire risk; extreme-heat days projected 1→4/yr by 2055 (HVAC capex compounding) — expect insurance premiums to compound above CPI over the hold.
Questions for the listing agent
- It's been on market 231 days. Have you received any prior offers? Is the seller open to a 12% concession, seller financing, or rate buy-down credit?
- Why hasn't it sold? Are there any deal-killer items the seller is aware of (foundation, flood, title, zoning, code violations)?
- Is there a deadline driving the sale (1031 exchange, divorce, estate, relocation)? That informs how much negotiation room exists.
- Schools are D-rated, which usually means shorter tenancies and higher turnover. Who's the typical renter profile here, and what's been the actual vacancy rate?
- Crime grade is F in this area — have there been break-ins, vandalism, or insurance claims at this property in the last 3 years? What carrier currently insures it and at what premium?
- What's the average days-on-market for RENTAL listings here right now (not sales)? A rising rental-DOM trend means longer vacancies and softer asking-rent achievability than the comps imply.
- What's the recent tenant-quality profile in this submarket — average credit score on applications, eviction rate, late-payment / NSF rate, and stable-employment percentage? A property-management company in the area should have these aggregated.
- How much new for-sale + rental construction is in the pipeline within 1–3 miles? Heavy new supply typically softens prices + rents 12–24 months out; constrained supply supports both.
Investment metrics
- 1% rule
- 2.21% ✓
- Cap rate
- 18.98%
- Cash-on-cash
- 45.32%
- DSCR
- 3.02
- GRM
- 3.8
CMA / ARV
- ARV (on-the-fly)
- $74,646
- Comps found
- 4
Show comp detail 4 sales within ~0.75 mi
| Address | Dist | Beds/Ba | Sqft | Sold | Price | $/sf | Match |
|---|---|---|---|---|---|---|---|
| 15252 Seneca Rd #297 | 0.00mi | 2/2.0 (-1) | 800 (-7%) | 4mo | $85,000 | $106 | 80 |
| 15252 Seneca Rd #144 | 0.17mi | 2/2.0 (-1) | 840 (-2%) | 9mo | $72,500 | $86 | 76 |
| 15252 Seneca Rd #57 | 0.00mi | 2/1.0 (-1) | 780 (-9%) | 12mo | $50,000 | $64 | 66 |
| 15252 Seneca Rd #36 | 0.00mi | 2/2.0 (-1) | 744 (-13%) | 15mo | $65,000 | $87 | 60 |
Match score weights: distance 35% · size 25% · config 20% · recency 20%. Top-matched comps best support the ARV.
Projected returns pro-forma
-3.0% appreciation · 6.46% rent growth · sell at horizon
- IRR
- 46.3%
- Equity multiple
- 3.11×
- Total profit
- $64,480
- Equity at exit
- $16,252
- IRR
- 53.6%
- Equity multiple
- 7.20×
- Total profit
- $189,125
- Equity at exit
- $9,424
Cash invested: $30,520 (down + closing). Projections, not guarantees.
Landlord ↔ Tenant lean methodology
- Overall (STATE)
- 18 Strongly Tenant-Friendly
- State California
- 18 Strongly Tenant-Friendly · D+13
- County
- — inherits STATE
- City
- — inherits STATE
ZIP-level market 92394
- Home prices YoY
- -1.3%
- Rents YoY
- 6.5%
- Active inventory
- 166
- Price-to-rent
- 3.8×
Monthly cashflow live
- Estimated rent
- $2,413 high interval (Pro) →
- Mortgage (P&I)
- −$572
- Tax est. 1.5%
- −$136 /mo · $1,635/yr
- Insurance
- −$45
- HOA
- −$0
- Vacancy / Maint / Mgmt
- −$507
- Net cashflow
- $1,153
Break-even live
UW: 25.0% down · 7.5% · 30yr · 1.5% tax · 5.0% vac · 8.0% maint · 8.0% mgmt
Financing live
Cash to close
- Down payment
- $27,250
- Closing costs
- $3,270
- Reserves months
- —
- Total cash needed
- —
Loan-product check · same deal, 3 products live
Conventional
25% down · 7.5% · 30yr
- Down + closing
- —
- Monthly P&I
- —
- Monthly cashflow
- —
- DSCR
- —
- Eligible?
- —
Personal DTI + credit; lowest rate.
DSCR
20% down · 8.5% · 30yr
- Down + closing
- —
- Monthly P&I
- —
- Monthly cashflow
- —
- DSCR
- —
- Eligible?
- —
No personal income docs; deal must DSCR.
Hard money
10% down · 12.0% · 12mo
- Down + closing
- —
- Monthly P&I
- —
- Monthly cashflow
- —
- DSCR
- —
- Eligible?
- —
Short-term bridge; refi at stabilization.
Rent comps 7 comps
| Address | Beds | Baths | Sqft | Rent | $/sqft | DOM | Units | Dist |
|---|---|---|---|---|---|---|---|---|
| 15230 Seneca Rd Victorville, CA | 1.0–3.0 | 1.0–2.0 | 805 | $2,005 | $2.49 | 1d | 12 | 0.04mi |
| 14374 Borego Rd Victorville, CA | 1.0–2.0 | 1.0–2.0 | 842 | $2,080 | $2.47 | 1d | 12 | 0.21mi |
| 14344 Mcart Rd Victorville, CA | 2.0–3.0 | 2.0 | 1042 | $2,395 | $2.30 | 1d | 5 | 0.23mi |
| 14485 Seneca Rd Victorville, CA | 2.0–3.0 | 2.0 | 1123 | $2,545 | $2.27 | 1d | 6 | 0.91mi |
| 14440 Stivers Rd Victorville, CA | 3.0 | 2.0 | 994 | $1,950 | $1.96 | 10d | 1 | 0.93mi |
| 14450 El Evado Rd Victorville, CA | 2.0–3.0 | 1.0–2.0 | 895 | $2,075 | $2.32 | 1d | 3 | 0.95mi |
| 14299 La Paz Dr Unit 3A Victorville, CA | 2.0 | 1.5 | 880 | $1,495 | $1.70 | 1d | 1 | 1.20mi |
Listing history 29 events
-
2026-06-18days on market $109,000 Active 231 DOM
-
2026-06-17days on market $109,000 Active 230 DOM
-
2026-06-16days on market $109,000 Active 229 DOM
-
2026-06-15days on market $109,000 Active 228 DOM
-
2026-06-13days on market $109,000 Active 226 DOM
-
2026-06-13days on market $109,000 Active 225 DOM
-
2026-06-09days on market $109,000 Active 222 DOM
-
2026-06-08days on market $109,000 Active 221 DOM
-
2026-06-07days on market $109,000 Active 220 DOM
-
2026-06-04days on market $109,000 Active 217 DOM
-
2026-06-03days on market $109,000 Active 216 DOM
-
2026-06-02days on market $109,000 Active 215 DOM
-
2026-06-01days on market $109,000 Active 214 DOM
-
2026-05-31days on market $109,000 Active 213 DOM
-
2026-05-11price $109,000
-
2026-04-28price $115,000
-
2026-04-06price $117,000
-
2026-03-18price $119,000
-
2026-03-13price $122,000
-
2026-03-07price $125,000
-
2026-03-04price $127,000
-
2026-02-16price $129,000
-
2026-02-10price $131,000
-
2026-01-22price $134,000
-
2026-01-15price $136,000
-
2025-12-17price $139,000
-
2025-10-30$129,000 Active
-
2025-10-24historical
-
2025-07-11$129,000 Active
ⓘ Source: listings_history table (triggers on properties + properties_extension) + one-shot
backfill from property_details.listing_events for pre-trigger history.
Climate risk First Street
- Flood 1/10 Low FEMA zone X (unshaded) · 0% chance over 30 yrs
- Wildfire 5/10 Major
- Heat 7/10 Severe 1 d/yr ≥99°F today · 4 d/yr by 30 yrs out
- Wind 1/10 Low
- Air quality 9/10 Extreme 22 unhealthy d/yr today · 28 by 30 yrs out
Nearby sold comps map
Loading sold comps map…
Walkable amenities ~0.75 mi
Loading nearby amenities…
Taxation est. · year 1
- Rental income
- $28,952
- − Mortgage interest
- −$6,106
- − Property taxes
- −$1,635
- − Insurance
- −$545
- − Repairs & maintenance
- −$2,316
- − Management
- −$2,316
- − Depreciation
- −$3,171
- Taxable income
- $12,863
- Est. tax owed @ 24.0%
- −$3,087
- After-tax cash flow
- $10,745/yr
For passive investors: Depreciation is non-cash, so a rental often shows a tax loss while cash-flowing — sheltering income. Rental losses are passive: they offset passive income freely, and up to $25,000/yr can offset ordinary (W-2) income if you actively participate and your MAGI is under $100k (phasing out to $0 by $150k); unused losses carry forward. On sale, claimed depreciation is recaptured at up to 25%, and gains may owe capital-gains tax (a 1031 exchange can defer both). Figures are a year-1 estimate at your 24.0% rate — not tax advice; consult a CPA.
Schools (NCES district)
- District
- Victor Elementary
- NCES district ID
- 0641040
- Math proficiency
- 25% ▬ 0.00%
- Reading proficiency
- 25% ▼ -9.00%
- Median HH income
- $44,949
- Composite
- 21.58/100
- National rank
- #8304
- State rank
- #408 of 517 in CA
Livability — Victorville
- Score
- 54/100
- State rank
- #906
- US rank
- #24038
Category grades
Schools grade is shown separately in the Schools card above.
Census & demographics
- Census place
- Victorville, CA
- County
- San Bernardino County · 2,030,291 people
- City population
- 154,418
- Metro
- Riverside-San Bernardino-Ontario, CA
- Population (ZIP)
- 41,614
- Household income
- $78,466
- Rent vs Own
- Severe rent burden
- 1485.0
Population outlook (San Bernardino County) Hauer SSP2
- Today (2025)
- 2,300,329 people
- By 2030
- 2,378,907 · +3.4%
- By 2040
- 2,523,137 · +9.7%
- By 2050
- 2,642,388 · +14.9%
- By 2075
- 2,880,769 · +25.2%
- By 2100
- 2,909,436 · +26.5%
Race, ethnicity, and origin ACS 2023
- Neighborhood character
- Diverse neighborhood (Simpson 0.61)
- Race & ethnicity
- Hispanic / Latino 57% Two or more races 24% Black 20% White 15% Asian 4% Native American 2%
- Hispanic origin (detail)
- Mexican 44% Puerto Rican 1%
- Common ancestry
- Italian 1% Romanian 1% Lithuanian 1%
- Foreign-born
- 20% · Canada, South Korea
- Languages at home
- 58% English-only · Spanish 38% Tagalog/Filipino 2% Arabic 1%
Political lean MEDSL · San Bernardino
- 2024 margin
- Toss-up / Even · D 47.5% · R 49.7% · Other 2.8%
- 2008→2024 swing
- -8.5pp toward R · 2008: 6.3pp · 2024: -2.1pp
- All cycles
- 2024: R+2.1 2020: D+10.7 2016: D+9.8 2012: D+5.4 2008: D+6.3
Not yet ingested
- Civics
- —
Market trends
- HPI YoY
- ▼ -5.17%
- Current HPI
- 384.3185
- Rent YoY
- ▲ 6.46%
- Metro
- Riverside-San Bernardino-Ontario, CA
- State GDP YoY
- ▲ 3.21%
- F500 in state
- 116
Industry mix (Fortune 500 HQ in CA)
| Industry | F500 HQs | Revenue |
|---|---|---|
| Technology | 27 | $1,492B |
|
||
| Financial Services | 3 | $174B |
|
||
| Retail | 3 | $44B |
|
||
| Insurance | 3 | $26B |
|
||
| Media / Entertainment | 2 | $115B |
|
||
| Pharmaceuticals / Biotech | 2 | $62B |
|
||
Price history
-15.5% since first listed15 events — show timeline
- 2026-05-11 Price Changed $109,000 CRMLS
- 2026-04-28 Price Changed $115,000 CRMLS
- 2026-04-06 Price Changed $117,000 CRMLS
- 2026-03-18 Price Changed $119,000 CRMLS
- 2026-03-13 Price Changed $122,000 CRMLS
- 2026-03-07 Price Changed $125,000 CRMLS
- 2026-03-04 Price Changed $127,000 CRMLS
- 2026-02-16 Price Changed $129,000 CRMLS
- 2026-02-10 Price Changed $131,000 CRMLS
- 2026-01-22 Price Changed $134,000 CRMLS
- 2026-01-15 Price Changed $136,000 CRMLS
- 2025-12-17 Price Changed $139,000 CRMLS
- 2025-10-30 Listed $129,000 CRMLS
- 2025-10-24 Listing Removed — CRMLS
- 2025-07-11 Listed $129,000 CRMLS
Property tax history
-12.6%/yrLatest (2015): $173 · +0.0% YoY. Source: county tax records.
Cash-flow waterfall
monthlySold comps — $/sqft
last 12 mo · ≤1 miLoading sold comps…