 🌊 Lakefront
12661 Kelly Sands Way #106 · Iona, FL
Flood risk 8/10 · Major
- FEMA flood zone
- AE
- Chance of flooding over 30 yrs
- 0.99%
- Est. flood insurance / yr
- $1,737 – $8,500
Fire risk 2/10 · Minimal
- Est. fire insurance / yr
- $947 – $1,759
Heat risk 10/10 · Severe
- Hot days now (above 107°F)
- 7 days/yr
- Hot days in 30 yrs
- 29 days/yr
Wind risk 10/10 · Severe
- Chance of severe wind over 30 yrs
- 99.0%
Air-quality risk 2/10 · Minimal
- Unhealthy air days now
- 1 days/yr
- Unhealthy air days in 30 yrs
- 1 days/yr
Risk factors via First Street. Map © Google.
Why this score? — see what drove the F grade
The composite is a weighted blend of 9 inputs, each scored 0–100. Each bar is that input's sub-score; the figure is the points it added to the 100-point composite (weight × sub-score).
- ARV discount +7.5/15.0
- 1% rule +5.3/10.0
- Schools +4.1/10.0
- Livability +3.6/5.0
- Cash flow +2.9/30.0
- Condition / age +2.5/5.0
- Rent growth +2.2/5.0
- DSCR +0.0/10.0
- Appreciation +0.0/10.0
$215,000
🖨 Deal sheet (PDF) 📄 Offer letter ✓ Due diligence
Listing remarks MLS
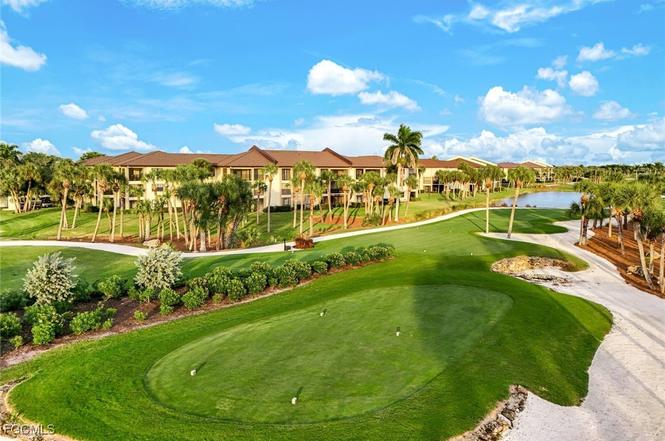
Stunning views from this first floor condo in Kelly Greens! This condo was damaged with Hurrican Ian, which means you get to customize it with your own finishes. Enjoy watching the golfers tee off at the 14th hole or catch a sunset from your screened in lanai. This condo has two bedrooms and two bathrooms, with an eat in kitchen, tile floors, covered parking and two exterior storage closets. Kelly Greens is a bundled golf community with tennis, pickleball, fitness center, restaurant and pools. Kelly Greens is located just minutes to Fort Myers Beach and Sanibel Island.
Key facts
- Tree-lined streets
- Heated pool
- Parking
Tags
Property features AI
Finance
- Financial info: Pets allowed with conditions (call)
- HOA & community: Homeowners association (amenities include clubhouse, fitness center, sport courts, golf course access, pickleball, racquetball, sauna, pool, restaurant, tennis courts, trails, management); Association includes internet and trash; Community of 210 units; Gated community with golf
Exterior
- Parking: Attached carport; 1 covered carport space
- Security: Smoke detectors
- Utilities: Cable available; High-speed internet available; Sewer assessment paid; Water assessment paid
- Home design: Resale property; North-facing; Entry level on level 1; 3 stories total; Has view; Rectangular lot with southern exposure
- Construction: Block, concrete and stucco construction; Tile roof
- Exterior features: Lanai / screened porch; Open patio; Porch; Patio; Community tennis courts; Community pool; Tennis court(s)
Interior
- Kitchen: Dishwasher; Electric cooktop; Microwave; Refrigerator with ice maker; Freezer; Disposal; Icemaker
- Bedrooms: 2 bedrooms
- Flooring: Tile
- Bathrooms: 2 full bathrooms
- Heating & cooling: Central heating (electric); Central air conditioning (electric)
- Interior features: Eat-in kitchen; High-speed internet available; Split bedrooms; Unfurnished; See remarks
- Laundry & utility: Washer hookup; Dryer; Dryer hookup
Neighborhood map
What this means for you Summary
Snapshot
- This is a 2-bed/2.0-bath condo listed at $215k.
Deal economics
- At list price, monthly cash flow is $-1k ($-14k/yr) — negative.
- To cash-flow at today's rent, offer at most $203k (5.6% below list).
- Meets the 1% rule at list price ($2k rent vs $215k).
- Recommended offer: $189k (12.0% below list) — sets the bar for market timing.
Location & tenants
- Location reads 72/100 on livability (#359 in FL) — a middle-class / working-renter tenant base. Strengths: crime A+, housing A, health & safety A; Watch: schools D-, amenities F, commute F.
- Lee (suburban): math 47% / reading 50% proficiency, ranked #42 of 73 in FL (top 58%) — families likely to look elsewhere, expect single-tenant / working-renter base with shorter leases.
- Market conditions: Rents soft (-1.2%/yr); 1244 active listings in the ZIP; 40 comparable units currently listed for rent nearby; rentals at typical pace (median 24d on market — plan ~3-4 weeks tenant-placement turnaround); solid renter incomes; 15,411 units permitted in Lee County in 2024 (4,686 in 5+ unit buildings).
- This rent runs 35% of the median local income ($75k/yr) — at the standard rent-burdened threshold; future hikes will face affordability resistance.
Forward outlook
- Local home prices are declining (-3.0%/yr); year-one equity from $1k of loan paydown is wiped out by about $6k of value loss. Plan a longer hold.
- Lee County population projected at +44% by 2050 — long-run rental-demand tailwind backs the buy-and-hold thesis.
Negotiation context
- It's been on market 212 days — a 12% lower offer ($189k) is reasonable based on typical stale-listing flexibility.
- 5 sale attempts since 11y ago with the ask held roughly flat each time — persistent listings suggest the price (not the market) is what's stuck; bring a comps-based counter.
- Current owner paid $185k; 16% above their basis — modest negotiation headroom, anchor on the comps not their cost.
Risks & watch-outs
- Watch-outs: flood insurance adds $427/mo; HOA is 48% of rent.
- Climate carrying-cost: in FEMA flood zone AE (mandatory federal flood insurance); severe wind risk, 99% chance of damaging wind over 30y; extreme-heat days projected 7→29/yr by 2055 (HVAC capex compounding) — expect insurance premiums to compound above CPI over the hold.
Questions for the listing agent
- What do current leases actually rent for vs. the listed asking? Can we see a recent rent roll and the last 12 months of T-12 income?
- It's been on market 212 days. Have you received any prior offers? Is the seller open to a 12% concession, seller financing, or rate buy-down credit?
- What's the actual annual flood-insurance premium (NFIP or private), and is the property in a SFHA with mandatory coverage?
- What does the HOA fee cover, when was the last increase, and are there any pending special assessments or reserve-fund shortfalls?
- Any open or pending special assessments — roof, HVAC, plumbing, elevator, façade? What's the per-unit balance and payoff schedule, and is the seller paying it off at close or rolling it to the buyer?
- Why hasn't it sold? Are there any deal-killer items the seller is aware of (foundation, flood, title, zoning, code violations)?
- Is there a deadline driving the sale (1031 exchange, divorce, estate, relocation)? That informs how much negotiation room exists.
- Schools are D-rated, which usually means shorter tenancies and higher turnover. Who's the typical renter profile here, and what's been the actual vacancy rate?
- The area grade is low — what's the realistic commute time and amenity access for the typical tenant pool here? Any planned neighborhood developments (good or bad) we should know about?
- This sits on a lake — are riparian / water-frontage rights deeded with the parcel? Any dock permits, shoreline easements, or HOA water-use restrictions?
- What's the documented flood / surge / shoreline-erosion history here (FEMA AND non-FEMA — e.g., storm surge, creek backup, septic-field saturation)?
- Any water-quality or seasonal algae-bloom issues that affect tenant satisfaction or short-term-rental demand?
- What's the average days-on-market for RENTAL listings here right now (not sales)? A rising rental-DOM trend means longer vacancies and softer asking-rent achievability than the comps imply.
- What's the recent tenant-quality profile in this submarket — average credit score on applications, eviction rate, late-payment / NSF rate, and stable-employment percentage? A property-management company in the area should have these aggregated.
- How much new apartment / multifamily construction is in the pipeline within 1–3 miles? Heavy new supply (>2% of stock underway) typically softens rents 12–24 months out; light construction supports rent growth.
Investment metrics
- 1% rule
- 1.03% ✓
- Cap rate
- 2.33%
- Cash-on-cash
- -14.14%
- DSCR
- 0.37
- GRM
- 8.1
CMA / ARV
No comps found within radius.
Projected returns pro-forma
-3.0% appreciation · 0.0% rent growth · sell at horizon
- IRR
- -74.6%
- Equity multiple
- -0.87×
- Total profit
- $-112,768
- Equity at exit
- $32,057
- IRR
- —
- Equity multiple
- -2.53×
- Total profit
- $-212,763
- Equity at exit
- $18,589
Cash invested: $60,200 (down + closing). Projections, not guarantees.
Landlord ↔ Tenant lean methodology
- Overall (STATE)
- 87 Strongly Landlord-Friendly
- State Florida
- 87 Strongly Landlord-Friendly · R+3
- County
- — inherits STATE
- City
- — inherits STATE
ZIP-level market 33908
- Home prices YoY
- -32.8%
- Rents YoY
- -1.2%
- Active inventory
- 1244
- Price-to-rent
- 8.1×
Monthly cashflow live
- Estimated rent
- $2,211 high interval (Pro) →
- Mortgage (P&I)
- −$1,127
- Tax from tax record
- −$171 /mo · $2,048/yr
- Insurance
- −$90
- Flood insurance flood zone
- −$427 /mo · $5,118/yr
- HOA est. from 2 same-building comps
- −$1,068
- Vacancy / Maint / Mgmt
- −$464
- Net cashflow
- $-1,136
Break-even live
Sensitivity live
| Price | -10% $-1,014 | -5% $-1,075 | +0% $-1,136 | +5% $-1,197 | +10% $-1,258 |
|---|---|---|---|---|---|
| Rent | -10% $-1,310 | -5% $-1,223 | +0% $-1,136 | +5% $-1,049 | +10% $-961 |
| Rate | -1.0pp $-1,028 | -0.5pp $-1,081 | base $-1,136 | +0.5pp $-1,192 | +1.0pp $-1,248 |
UW: 25.0% down · 7.5% · 30yr · 1.5% tax · 5.0% vac · 8.0% maint · 8.0% mgmt
Financing live
Cash to close
- Down payment
- $53,750
- Closing costs
- $6,450
- Reserves months
- —
- Total cash needed
- —
Loan-product check · same deal, 3 products live
Conventional
25% down · 7.5% · 30yr
- Down + closing
- —
- Monthly P&I
- —
- Monthly cashflow
- —
- DSCR
- —
- Eligible?
- —
Personal DTI + credit; lowest rate.
DSCR
20% down · 8.5% · 30yr
- Down + closing
- —
- Monthly P&I
- —
- Monthly cashflow
- —
- DSCR
- —
- Eligible?
- —
No personal income docs; deal must DSCR.
Hard money
10% down · 12.0% · 12mo
- Down + closing
- —
- Monthly P&I
- —
- Monthly cashflow
- —
- DSCR
- —
- Eligible?
- —
Short-term bridge; refi at stabilization.
Rent comps 40 comps
| Address | Beds | Baths | Sqft | Rent | $/sqft | DOM | Units | Dist |
|---|---|---|---|---|---|---|---|---|
| 12641 Kelly Sands Way #225 Fort Myers, FL | 2.0 | 2.0 | 1069 | $5,000 | $4.68 | 24d | 1 | 0.10mi |
| 12621 Kelly Sands Way #305 Fort Myers, FL | 2.0 | 2.0 | 1106 | $5,000 | $4.52 | 24d | 1 | 0.14mi |
| 12540 Kelly Greens Blvd #331 Fort Myers, FL | 2.0 | 2.0 | 1440 | $2,100 | $1.46 | 24d | 1 | 0.15mi |
| 11596 Palm Dr Fort Myers, FL | 3.0 | 2.0 | 1394 | $2,450 | $1.76 | 24d | 1 | 0.36mi |
| 12250 Kelly Greens Blvd #57 Fort Myers, FL | 2.0 | 2.0 | 1336 | $1,999 | $1.50 | 24d | 1 | 0.38mi |
| 12171 Kelly Sands Way #1577 Fort Myers, FL | 2.0 | 2.0 | 1160 | $4,500 | $3.88 | 24d | 1 | 0.39mi |
| 12150 Kelly Sands Way Fort Myers, FL | 2.0 | 2.0 | 1087 | $4,700 | $4.32 | 24d | 2 | 0.43mi |
| 12150 Kelly Sands Way Fort Myers, FL | 2.0 | 2.0 | 1087 | $3,325 | $3.06 | 3d | 3 | 0.43mi |
| 7 Birch Blvd Fort Myers, FL | 3.0 | 2.0 | 1280 | $1,600 | $1.25 | 24d | 1 | 0.51mi |
| 16500 Kelly Cove Dr #2880 Fort Myers, FL | 2.0 | 2.0 | 1283 | $4,800 | $3.74 | 24d | 1 | 0.58mi |
| 16470 Kelly Cove Dr #2850 Fort Myers, FL | 2.0 | 2.0 | 1216 | $5,000 | $4.11 | 24d | 1 | 0.59mi |
| 16470 Kelly Cove Dr Fort Myers, FL | 2.0 | 2.0 | 1214 | $3,550 | $2.92 | 3d | 2 | 0.59mi |
| 16301 Kelly Woods Dr #205 Fort Myers, FL | 2.0 | 2.0 | 1336 | $5,000 | $3.74 | 24d | 1 | 0.66mi |
| 20021 Sanibel View Cir #105 Fort Myers, FL | 2.0 | 2.0 | 1417 | $4,800 | $3.39 | 24d | 1 | 0.69mi |
| 11140 Caravel Cir #109 Fort Myers, FL | 2.0 | 2.0 | 1050 | $4,200 | $4.00 | 24d | 1 | 0.77mi |
| 11110 Caravel Cir #201 Fort Myers, FL | 2.0 | 2.0 | 1050 | $3,500 | $3.33 | 24d | 1 | 0.77mi |
| 11220 Caravel Cir #306 Fort Myers, FL | 1.0 | 1.5 | 836 | $2,500 | $2.99 | 24d | 1 | 0.78mi |
| 11861 Caraway Ln #116 Fort Myers, FL | 2.0 | 2.0 | 1056 | $1,995 | $1.89 | 20d | 1 | 0.81mi |
| 16821 Sanibel Sunset Ct #203 Fort Myers, FL | 2.0 | 2.0 | 1271 | $1,750 | $1.38 | 11d | 1 | 0.81mi |
| 13426 Pine Needle Ln Fort Myers, FL | 2.0 | 1.0 | 922 | $1,275 | $1.38 | 22d | 1 | 0.91mi |
| 16881 Davis Rd Fort Myers, FL | 1.0–2.0 | 1.0–2.0 | 767 | $1,800 | $2.35 | 16d | 3 | 0.91mi |
| 16881 Davis Rd Fort Myers, FL | 2.0 | 1.0–2.0 | 837 | $1,600 | $1.91 | 3d | 2 | 0.91mi |
| 13430 Pine Needle Ln Fort Myers, FL | 2.0 | 1.0 | 922 | $1,200 | $1.30 | 3d | 1 | 0.92mi |
| 11540 Caravel Cir #3012 Fort Myers, FL | 2.0 | 2.0 | 1050 | $1,250 | $1.19 | 22d | 1 | 0.93mi |
| 13502 Siesta Pines Ct #402 Fort Myers, FL | 2.0 | 2.0 | 955 | $1,475 | $1.54 | 14d | 1 | 0.95mi |
| 16805 Davis Rd #123 Fort Myers, FL | 2.0 | 2.0 | 808 | $1,399 | $1.73 | 24d | 1 | 0.96mi |
| 13401 Pine Needle Ln Unit 13405 Fort Myers, FL | 2.0 | 1.0 | 852 | $1,300 | $1.53 | 3d | 1 | 0.98mi |
| 13405 Pine Needle Ln Fort Myers, FL | 2.0 | 1.0 | 852 | $1,300 | $1.53 | 3d | 1 | 0.98mi |
| 13403 Pine Needle Ln Fort Myers, FL | 2.0 | 1.0 | 852 | $1,300 | $1.53 | 3d | 1 | 0.98mi |
| 13527 Siesta Pines Ct Fort Myers, FL | 2.0 | 2.5 | 1244 | $1,900 | $1.53 | 24d | 1 | 0.99mi |
| 13420 Hidden Palms Cv Fort Myers, FL | 2.0 | 2.0 | 1450 | $1,600 | $1.10 | 24d | 1 | 0.99mi |
| 16599 Davis Rd Fort Myers, FL | 2.0 | 2.0 | 851 | $1,800 | $2.12 | 24d | 1 | 0.99mi |
| 13533 Siesta Pines Ct Fort Myers, FL | 2.0 | 3.0 | 1246 | $1,800 | $1.44 | 24d | 1 | 1.00mi |
| 16580 Ginger Ln #3242 Fort Myers, FL | 2.0 | 2.0 | 982 | $1,800 | $1.83 | 24d | 1 | 1.00mi |
| 16001 Bayside Pointe Fort Myers, FL | 1.0–3.0 | 1.0–2.0 | 1135 | $1,888 | $1.66 | 2d | 18 | 1.01mi |
| 158 Nanaimo Trl Fort Myers Beach, FL | 2.0 | 2.0 | 1200 | $6,570 | $5.47 | 24d | 1 | 1.01mi |
| 15999 Mandolin Bay Dr #202 Fort Myers, FL | 2.0 | 2.0 | 1152 | $1,775 | $1.54 | 24d | 1 | 1.05mi |
| 15989 Mandolin Bay Dr Fort Myers, FL | 2.0 | 2.0 | 1152 | $1,695 | $1.47 | 24d | 1 | 1.08mi |
| 16007 Davis Rd #614 Fort Myers, FL | 2.0 | 2.0 | 820 | $3,500 | $4.27 | 24d | 1 | 1.09mi |
| 15761 Windward Way Cir #3302 Fort Myers, FL | 2.0 | 2.0 | 1050 | $4,500 | $4.29 | 3d | 1 | 1.10mi |
HOA detail condo
- Monthly dues
- $0 · $0/yr
- Likely covers
- poolgym
- Assessments
- None detected in remarks — confirm with the listing agent.
Listing history 27 events
-
2026-06-17days on market $215,000 Active 212 DOM
-
2026-06-16days on market $215,000 Active 211 DOM
-
2026-06-16days on market $215,000 Active 210 DOM
-
2026-06-13days on market $215,000 Active 208 DOM
-
2026-06-09days on market $215,000 Active 204 DOM
-
2026-06-07days on market $215,000 Active 202 DOM
-
2026-06-02days on market $215,000 Active 197 DOM
-
2026-06-01days on market $215,000 Active 196 DOM
-
2026-06-01days on market $215,000 Active 195 DOM
-
2025-11-07$215,000 Active
-
2024-05-16historical $2,700
-
2024-04-19$2,700
-
2024-02-24historical $2,700
-
2023-05-17$2,700
-
2023-01-31soldstatus $185,000
-
2023-01-27soldstatus $185,000 Closed 575-char remark
Show marketing remark (575 chars)
Stunning views from this first floor condo in Kelly Greens! This condo was damaged with Hurrican Ian, which means you get to customize it with your own finishes. Enjoy watching the golfers tee off at the 14th hole or catch a sunset from your screened in lanai. This condo has two bedrooms and two bathrooms, with an eat in kitchen, tile floors, covered parking and two exterior storage closets. Kelly Greens is a bundled golf community with tennis, pickleball, fitness center, restaurant and pools. Kelly Greens is located just minutes to Fort Myers Beach and Sanibel Island.
-
2023-01-05status Pending 575-char remark
Show marketing remark (575 chars)
Stunning views from this first floor condo in Kelly Greens! This condo was damaged with Hurrican Ian, which means you get to customize it with your own finishes. Enjoy watching the golfers tee off at the 14th hole or catch a sunset from your screened in lanai. This condo has two bedrooms and two bathrooms, with an eat in kitchen, tile floors, covered parking and two exterior storage closets. Kelly Greens is a bundled golf community with tennis, pickleball, fitness center, restaurant and pools. Kelly Greens is located just minutes to Fort Myers Beach and Sanibel Island.
-
2022-12-11$199,000 Active 575-char remark
Show marketing remark (575 chars)
Stunning views from this first floor condo in Kelly Greens! This condo was damaged with Hurrican Ian, which means you get to customize it with your own finishes. Enjoy watching the golfers tee off at the 14th hole or catch a sunset from your screened in lanai. This condo has two bedrooms and two bathrooms, with an eat in kitchen, tile floors, covered parking and two exterior storage closets. Kelly Greens is a bundled golf community with tennis, pickleball, fitness center, restaurant and pools. Kelly Greens is located just minutes to Fort Myers Beach and Sanibel Island.
-
2016-02-26historical
-
2015-11-13$179,900 Active
-
2004-12-21soldstatus $181,000
-
2004-12-13soldstatus $181,000
-
2004-11-04price $189,900
-
2001-05-09soldstatus $132,900
-
2000-05-01soldstatus $116,000
-
1994-02-01soldstatus $104,000
-
1992-06-15soldstatus $115,000
ⓘ Source: listings_history table (triggers on properties + properties_extension) + one-shot
backfill from property_details.listing_events for pre-trigger history.
Tax reassessment forecast FL · Resets to sale price
- Current annual tax
- $2,048 · $171/mo
- Projected year-2 tax
- $2,048 · $171/mo
- Expected delta
- $0/yr ($0/mo · 0.0%)
ⓘ Screening estimate from a state-policy table — verify with the county assessor before closing.
Climate risk First Street
- Flood 8/10 Severe FEMA zone AE · 99% chance over 30 yrs
- Wildfire 2/10 Low
- Heat 10/10 Extreme 7 d/yr ≥107°F today · 29 d/yr by 30 yrs out
- Wind 10/10 Extreme 99% chance of damaging wind over 30 yrs
- Air quality 2/10 Low 1 unhealthy d/yr today · 1 by 30 yrs out
Nearby sold comps map
Loading sold comps map…
Walkable amenities ~0.75 mi
Loading nearby amenities…
Taxation est. · year 1
- Rental income
- $26,528
- − Mortgage interest
- −$12,043
- − Property taxes
- −$2,048
- − Insurance
- −$6,194
- − Repairs & maintenance
- −$2,122
- − Management
- −$2,122
- − HOA
- −$12,816
- − Depreciation
- −$6,255
- Taxable loss
- −$17,072
- Est. tax savings @ 24.0%
- +$4,097
- After-tax cash flow
- $-9,533/yr
For passive investors: Depreciation is non-cash, so a rental often shows a tax loss while cash-flowing — sheltering income. Rental losses are passive: they offset passive income freely, and up to $25,000/yr can offset ordinary (W-2) income if you actively participate and your MAGI is under $100k (phasing out to $0 by $150k); unused losses carry forward. On sale, claimed depreciation is recaptured at up to 25%, and gains may owe capital-gains tax (a 1031 exchange can defer both). Figures are a year-1 estimate at your 24.0% rate — not tax advice; consult a CPA.
Schools (NCES district)
- District
- Lee
- NCES district ID
- 1201080
- Math proficiency
- 47% ▼ -11.00%
- Reading proficiency
- 50% ▼ -4.00%
- Median HH income
- $49,518
- Composite
- 41.49/100
- National rank
- #3458
- State rank
- #42 of 73 in FL
Livability — Iona
- Score
- 72/100
- State rank
- #359
- US rank
- #6253
Category grades
Schools grade is shown separately in the Schools card above.
Census & demographics
- Census place
- Iona, FL
- County
- Lee County · 788,662 people
- Metro
- Cape Coral-Fort Myers, FL
- Population (ZIP)
- 37,423
- Household income
- $75,396
- Rent vs Own
- Severe rent burden
- 1944.0
Population outlook (Lee County) Hauer SSP2
- Today (2025)
- 871,946 people
- By 2030
- 955,468 · +9.6%
- By 2040
- 1,113,587 · +27.7%
- By 2050
- 1,256,891 · +44.1%
- By 2075
- 1,560,270 · +78.9%
- By 2100
- 1,726,848 · +98.0%
Race, ethnicity, and origin ACS 2023
- Neighborhood character
- Predominantly White (88%)
- Race & ethnicity
- White 88% Hispanic / Latino 6% Two or more races 5% Black 3% Asian 1%
- Hispanic origin (detail)
- Mexican 1% Puerto Rican 2%
- Common ancestry
- Romanian 5% Lithuanian 4% Slovak 3%
- Foreign-born
- 10% · Canada, Jamaica
- Languages at home
- 90% English-only · Spanish 4% Russian/Polish/Slavic 1% Other Indo-European 1%
Political lean MEDSL · Lee
- 2024 margin
- Strong R (+28.4) · D 35.5% · R 63.9%
- 2008→2024 swing
- -18.0pp toward R · 2008: -10.4pp · 2024: -28.4pp
- All cycles
- 2024: R+28.4 2020: R+19.2 2016: R+20.4 2012: R+16.6 2008: R+10.4
Not yet ingested
- Civics
- —
Market trends
- HPI YoY
- ▼ -102.22%
- Current HPI
- 209.7595
- Rent YoY
- ▼ -1.18%
- Metro
- Cape Coral-Fort Myers, FL
- State GDP YoY
- ▲ 3.28%
- F500 in state
- 36
Industry mix (Fortune 500 HQ in FL)
| Industry | F500 HQs | Revenue |
|---|---|---|
| Industrial Technology | 2 | $29B |
|
||
| Insurance | 2 | $17B |
|
||
| Retail | 1 | $60B |
|
||
| Technology Distribution | 1 | $58B |
|
||
| Homebuilding | 1 | $35B |
|
||
| Technology Manufacturing | 1 | $35B |
|
||
Price history
+87.0% since first listed18 events — show timeline
- 2025-11-07 Listed $215,000 FORTMLS
- 2024-05-16 Rental Removed $2,700 FORTMLS
- 2024-04-19 Listed for Rent $2,700 FORTMLS
- 2024-02-24 Rental Removed $2,700 FORTMLS
- 2023-05-17 Listed for Rent $2,700 FORTMLS
- 2023-01-31 Sold (Public Records) $185,000 Public Records
- 2023-01-27 Sold (MLS) $185,000 FORTMLS
- 2023-01-05 Pending — FORTMLS
- 2022-12-11 Listed $199,000 FORTMLS
- 2016-02-26 Listing Removed — FORTMLS
- 2015-11-13 Listed $179,900 FORTMLS
- 2004-12-21 Sold (Public Records) $181,000 Public Records
- 2004-12-13 Sold (MLS) $181,000 FORTMLS
- 2004-11-04 Price Changed $189,900 FORTMLS
- 2001-05-09 Sold (Public Records) $132,900 Public Records
- 2000-05-01 Sold (Public Records) $116,000 Public Records
- 1994-02-01 Sold (Public Records) $104,000 Public Records
- 1992-06-15 Sold (Public Records) $115,000 Public Records
Property tax history
+1.9%/yrLatest (2025): $2,048 · -30.2% YoY. Source: county tax records.
Cash-flow waterfall
monthlySold comps — $/sqft
last 12 mo · ≤1 miLoading sold comps…