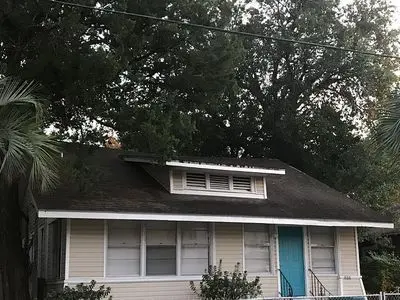
406 W 19th St · Jacksonville, FL
Flood risk 1/10 · Minimal
- FEMA flood zone
- X (unshaded)
- Chance of flooding over 30 yrs
- 0.0%
- Est. flood insurance / yr
- $507 – $1,088
Fire risk 1/10 · Minimal
- Est. fire insurance / yr
- $947 – $1,759
Heat risk 9/10 · Severe
- Hot days now (above 107°F)
- 7 days/yr
- Hot days in 30 yrs
- 20 days/yr
Wind risk 9/10 · Severe
- Chance of severe wind over 30 yrs
- 99.0%
Air-quality risk 4/10 · Minor
- Unhealthy air days now
- 6 days/yr
- Unhealthy air days in 30 yrs
- 6 days/yr
Risk factors via First Street. Map © Google.
Why this score? — see what drove the C grade
The composite is a weighted blend of 9 inputs, each scored 0–100. Each bar is that input's sub-score; the figure is the points it added to the 100-point composite (weight × sub-score).
- Cash flow +20.9/30.0
- ARV discount +9.6/15.0
- DSCR +6.6/10.0
- 1% rule +5.3/10.0
- Livability +4.2/5.0
- Schools +3.9/10.0
- Rent growth +2.7/5.0
- Condition / age +2.5/5.0
- Appreciation +0.0/10.0
$150,000
🖨 Deal sheet 📄 Offer letter ✓ Due diligence
Listing remarks MLS
COME AND SEE THIS WELL MAINTAINED 4 BEDROOM 1 BATHROOM HOME IN THE SPRINGFIELD AREA OF JACKSONVILLE. HARDWOOD FLOORS AND THE HVAC WAS REPLACED IN MAY 2024. GREAT INVESTMENT PROPERTY.
Key facts
- New hvac
- Sewer line replaced
- Non-leaky roof
Tags
Property features AI
Exterior
- Home design: Built in 1970
- Construction: Living area approximately 1,458
- Exterior features: Located in the Springfield subdivision
Neighborhood map
What this means for you Summary
Snapshot
- This is a 4-bed/1.0-bath single-family listed at $150k.
Deal economics
- At list price, monthly cash flow is $207 ($2k/yr) — positive.
- The deal already cash-flows at list — no discount required.
- Meets the 1% rule at list price ($2k rent vs $150k).
- Recommended offer: $148k (1.5% below list) — sets the bar for market timing.
- Cap rate 8.0% vs local median 4.0% in Jacksonville — top-decile yield for the area; either an underpriced asset or a hidden risk that comps aren't pricing in. Stress-test before assuming the spread holds.
Location & tenants
- Location reads 83/100 on livability (#50 in FL, #911 nationally) — a professional / high-income tenant draw. Strengths: amenities A+, commute A+, housing A+.
- Duval (urban): math 46% / reading 45% proficiency, ranked #48 of 73 in FL (top 66%) — families likely to look elsewhere, expect single-tenant / working-renter base with shorter leases.
- Market conditions: Rents flat; 194 active listings in the ZIP; 40 comparable units currently listed for rent nearby; rentals at typical pace (median 24d on market — plan ~3-4 weeks tenant-placement turnaround); lower-income renter base — watch delinquency; 6,503 units permitted in Duval County in 2024 (1,131 in 5+ unit buildings).
- At $1,545/mo this rent would consume 47% of the median local household income ($39k/yr) (locally 1057% of renters already pay >50% of income on rent) — very limited rent-growth headroom before tenants either downsize or default.
Forward outlook
- Local home prices are declining (-3.0%/yr); year-one equity from $1k of loan paydown is wiped out by about $4k of value loss. Plan a longer hold.
- Duval County population projected at +19% by 2050 — long-run rental-demand tailwind backs the buy-and-hold thesis.
Negotiation context
- It's been on market 28 days — a 2% lower offer ($148k) is reasonable based on typical stale-listing flexibility.
- 7 sale attempts since 19y ago with the ask held roughly flat each time — persistent listings suggest the price (not the market) is what's stuck; bring a comps-based counter.
- Current owner paid $63k; list at $150k implies a 138% gain — meaningful room to come down on a strong offer.
Risks & watch-outs
- Climate carrying-cost: severe wind risk, 99% chance of damaging wind over 30y; extreme-heat days projected 7→20/yr by 2055 (HVAC capex compounding) — expect insurance premiums to compound above CPI over the hold.
Questions for the listing agent
- Built in 1970 — when were the roof, HVAC, electrical panel, plumbing, and water heater last replaced?
- Is there a deadline driving the sale (1031 exchange, divorce, estate, relocation)? That informs how much negotiation room exists.
- Schools are B-rated — typically a magnet for longer-tenancy family renters. What's the average tenant stay here, and is there a school-zone premium baked into asking?
- What's the average days-on-market for RENTAL listings here right now (not sales)? A rising rental-DOM trend means longer vacancies and softer asking-rent achievability than the comps imply.
- What's the recent tenant-quality profile in this submarket — average credit score on applications, eviction rate, late-payment / NSF rate, and stable-employment percentage? A property-management company in the area should have these aggregated.
- How much new for-sale + rental construction is in the pipeline within 1–3 miles? Heavy new supply typically softens prices + rents 12–24 months out; constrained supply supports both.
Investment metrics
- 1% rule
- 1.03% ✓
- Cap rate
- 7.95%
- Cash-on-cash
- 5.92%
- DSCR
- 1.26
- GRM
- 8.1
CMA / ARV
- ARV (on-the-fly)
- $157,464
- Comps found
- 12
Show comp detail 12 sales within ~0.75 mi
| Address | Dist | Beds/Ba | Sqft | Sold | Price | $/sf | Match |
|---|---|---|---|---|---|---|---|
| 37 22nd St | 0.37mi | 3/1.0 (-1) | 1,440 (-1%) | 11mo | $155,000 | $108 | 66 |
| 3317 N Laura St | 0.38mi | 4/2.0 | 1,364 (-6%) | 3mo | $65,000 | $48 | 65 |
| 1039 Scriven St | 0.70mi | 4/1.0 | 1,492 (+2%) | 1mo | $23,000 | $15 | 62 |
| 2724 Hubbard St | 0.47mi | 3/1.0 (-1) | 1,574 (+8%) | 7mo | $50,000 | $32 | 54 |
| 119 W 22nd St | 0.31mi | 4/2.0 | 1,284 (-12%) | 13mo | $181,125 | $141 | 51 |
| 141 22nd St | 0.27mi | 3/2.0 (-1) | 1,260 (-14%) | 8mo | $80,000 | $63 | 49 |
| 104 W 26th St | 0.43mi | 4/2.0 | 1,266 (-13%) | 8mo | $168,000 | $133 | 47 |
| 125 W 11th St | 0.44mi | 3/3.0 (-1) | 1,588 (+9%) | 10mo | $419,200 | $264 | 44 |
| 1046 W 17th St | 0.60mi | 4/2.0 | 1,335 (-8%) | 17mo | $73,900 | $55 | 40 |
| 111 Long Branch Blvd | 0.73mi | 3/1.5 (-1) | 1,368 (-6%) | 10mo | $150,000 | $110 | 40 |
| 934 Scriven St | 0.60mi | 3/2.5 (-1) | 1,300 (-11%) | 13mo | $226,020 | $174 | 32 |
| 1095 W 12th St | 0.73mi | 3/2.0 (-1) | 1,287 (-12%) | 12mo | $93,750 | $73 | 27 |
Match score weights: distance 35% · size 25% · config 20% · recency 20%. Top-matched comps best support the ARV.
Projected returns pro-forma
-3.0% appreciation · 0.94% rent growth · sell at horizon
- IRR
- -9.4%
- Equity multiple
- 0.66×
- Total profit
- $-14,229
- Equity at exit
- $22,365
- IRR
- -3.0%
- Equity multiple
- 0.82×
- Total profit
- $-7,704
- Equity at exit
- $12,969
Cash invested: $42,000 (down + closing). Projections, not guarantees.
Landlord ↔ Tenant lean methodology
- Overall (STATE)
- 87 Strongly Landlord-Friendly
- State Florida
- 87 Strongly Landlord-Friendly · R+3
- County
- — inherits STATE
- City
- — inherits STATE
ZIP-level market 32206
- Home prices YoY
- -23.7%
- Rents YoY
- 0.9%
- Active inventory
- 194
- Price-to-rent
- 8.1×
Monthly cashflow live
- Estimated rent
- $1,545 high interval (Pro) →
- Mortgage (P&I)
- −$787
- Tax from tax record
- −$164 /mo · $1,969/yr
- Insurance
- −$62
- HOA
- −$0
- Vacancy / Maint / Mgmt
- −$324
- Net cashflow
- $207
Break-even live
UW: 25.0% down · 7.5% · 30yr · 1.5% tax · 5.0% vac · 8.0% maint · 8.0% mgmt
Financing live
Cash to close
- Down payment
- $37,500
- Closing costs
- $4,500
- Reserves months
- —
- Total cash needed
- —
Loan-product check · same deal, 3 products live
Conventional
25% down · 7.5% · 30yr
- Down + closing
- —
- Monthly P&I
- —
- Monthly cashflow
- —
- DSCR
- —
- Eligible?
- —
Personal DTI + credit; lowest rate.
DSCR
20% down · 8.5% · 30yr
- Down + closing
- —
- Monthly P&I
- —
- Monthly cashflow
- —
- DSCR
- —
- Eligible?
- —
No personal income docs; deal must DSCR.
Hard money
10% down · 12.0% · 12mo
- Down + closing
- —
- Monthly P&I
- —
- Monthly cashflow
- —
- DSCR
- —
- Eligible?
- —
Short-term bridge; refi at stabilization.
Rent comps 40 comps
| Address | Beds | Baths | Sqft | Rent | $/sqft | DOM | Units | Dist |
|---|---|---|---|---|---|---|---|---|
| 503 W 16th St Jacksonville, FL | 4.0 | 1.5 | 1216 | $1,420 | $1.17 | 23d | 1 | 0.13mi |
| 522 W 21st St Jacksonville, FL | 3.0 | 2.0 | 1045 | $1,350 | $1.29 | 23d | 1 | 0.17mi |
| 347 W 23rd St Jacksonville, FL | 3.0 | 1.5 | 1176 | $1,112 | $0.95 | 7d | 1 | 0.26mi |
| 204 W 23rd St Jacksonville, FL | 3.0 | 1.0 | 960 | $1,225 | $1.28 | 1d | 1 | 0.28mi |
| 3020 N Laura St Jacksonville, FL | 3.0 | 1.0 | 1162 | $1,300 | $1.12 | 23d | 1 | 0.28mi |
| 34 W 23rd St Jacksonville, FL | 3.0 | 1.5 | 962 | $1,400 | $1.46 | 23d | 1 | 0.38mi |
| 231 W 10th St Jacksonville, FL | 3.0 | 1.0 | 1200 | $1,500 | $1.25 | 23d | 1 | 0.44mi |
| 30 W 12th St Jacksonville, FL | 4.0 | 3.0 | 1792 | $2,580 | $1.44 | 1d | 1 | 0.44mi |
| 421 Golfair Blvd Jacksonville, FL | 4.0 | 2.5 | 1761 | $1,381 | $0.78 | 16d | 1 | 0.48mi |
| 118 W 28th St Jacksonville, FL | 3.0 | 2.0 | 1332 | $1,250 | $0.94 | 23d | 1 | 0.52mi |
| 26 W 27th St Jacksonville, FL | 3.0 | 2.0 | 1512 | $1,300 | $0.86 | 23d | 1 | 0.52mi |
| 1018 W 23rd St Jacksonville, FL | 3.0 | 2.5 | 1161 | $1,600 | $1.38 | 23d | 1 | 0.60mi |
| 2313 Janette St Jacksonville, FL | 4.0 | 2.0 | 1148 | $1,349 | $1.18 | 16d | 1 | 0.62mi |
| 326 Basswood St Jacksonville, FL | 3.0 | 2.0 | 1317 | $1,550 | $1.18 | 23d | 1 | 0.62mi |
| 1025 W 25th St Unit 1 Jacksonville, FL | 5.0 | 2.0 | 1500 | $2,000 | $1.33 | 23d | 1 | 0.67mi |
| 1029 W 25th St Unit 1 Jacksonville, FL | 5.0 | 2.0 | 1410 | $2,200 | $1.56 | 23d | 1 | 0.67mi |
| 1031 W 26th St Jacksonville, FL | 3.0 | 2.0 | 1261 | $1,445 | $1.15 | 23d | 1 | 0.70mi |
| 55 E 9th St Jacksonville, FL | 3.0 | 1.5 | 1246 | $1,675 | $1.34 | 14d | 1 | 0.71mi |
| 28 W 33rd St Jacksonville, FL | 4.0 | 1.0 | 1395 | $898 | $0.64 | 7d | 1 | 0.73mi |
| 666 Basswood St Jacksonville, FL | 3.0 | 1.0 | 1002 | $1,400 | $1.40 | 23d | 1 | 0.75mi |
| 2904 Moncrief Rd Jacksonville, FL | 3.0 | 1.0 | 952 | $1,100 | $1.16 | 23d | 1 | 0.79mi |
| 146 W 6th St Jacksonville, FL | 3.0 | 1.0 | 1600 | $1,475 | $0.92 | 19d | 1 | 0.83mi |
| 1514 Silver St Jacksonville, FL | 3.0 | 2.0 | 1726 | $2,275 | $1.32 | 23d | 1 | 0.87mi |
| 1173 W 27th St Jacksonville, FL | 3.0 | 1.0 | 1080 | $1,145 | $1.06 | 13d | 1 | 0.88mi |
| 3747 Peachtree St Jacksonville, FL | 3.0 | 2.0 | 1082 | $1,410 | $1.30 | 3d | 1 | 0.88mi |
| 1149 W 28th St Jacksonville, FL | 4.0 | 2.0 | 1344 | $1,302 | $0.97 | 23d | 1 | 0.88mi |
| 1926 Walnut St Jacksonville, FL | 3.0 | 2.0 | 1338 | $1,418 | $1.06 | 14d | 1 | 0.91mi |
| 1201 W 27th St Jacksonville, FL | 3.0 | 2.0 | 1120 | $1,145 | $1.02 | 23d | 1 | 0.92mi |
| 643 Linwood Ave Jacksonville, FL | 3.0 | 2.0 | 1232 | $1,325 | $1.08 | 2d | 1 | 0.93mi |
| 1220 W 28th St Jacksonville, FL | 3.0 | 1.0 | 1122 | $1,299 | $1.16 | 23d | 1 | 0.95mi |
| 4721 E Castlewood Dr Jacksonville, FL | 3.0 | 1.0 | 1008 | $1,250 | $1.24 | 23d | 1 | 0.96mi |
| 331 W 40th St Jacksonville, FL | 4.0 | 2.0 | 1536 | $1,375 | $0.90 | 3d | 1 | 1.02mi |
| 1288 W 28th St Jacksonville, FL | 4.0 | 1.5 | 1449 | $1,267 | $0.87 | 13d | 1 | 1.03mi |
| 1454 Francis St Jacksonville, FL | 3.0 | 2.0 | 1084 | $1,243 | $1.15 | 23d | 1 | 1.04mi |
| 1010 E 13th St Jacksonville, FL | 3.0 | 2.0 | 1220 | $1,275 | $1.05 | 13d | 1 | 1.05mi |
| 424 Walnut Ct Jacksonville, FL | 3.0 | 2.0 | 1530 | $1,688 | $1.10 | 14d | 1 | 1.06mi |
| 424 Walnut Ct Jacksonville, FL | 3.0 | 2.0 | 1530 | $1,688 | $1.10 | 14d | 1 | 1.06mi |
| 1410 W 20th St Jacksonville, FL | 3.0 | 2.0 | 1170 | $1,485 | $1.27 | 13d | 1 | 1.08mi |
| 1431 W 21st St Jacksonville, FL | 3.0 | 2.0 | 1199 | $1,425 | $1.19 | 14d | 1 | 1.11mi |
| 5035 N Main St Jacksonville, FL | 3.0 | 1.0–2.0 | 816 | $1,459 | $1.79 | 23d | 69 | 1.16mi |
Listing history 32 events
-
2026-06-18days on market $150,000 Active 28 DOM
-
2026-06-17days on market $150,000 Active 27 DOM
-
2026-06-16days on market $150,000 Active 26 DOM
-
2026-06-15days on market $150,000 Active 25 DOM
-
2026-06-10days on market $150,000 Active 19 DOM
-
2026-06-08days on market $150,000 Active 18 DOM
-
2026-06-08days on market $150,000 Active 17 DOM
-
2026-06-03days on market $150,000 Active 13 DOM
-
2026-06-02days on market $150,000 Active 12 DOM
-
2026-06-01days on market $150,000 Active 11 DOM
-
2026-05-31days on market $150,000 Active 10 DOM
-
2026-05-22$150,000 Active
-
2024-09-06historical 182-char remark
Show marketing remark (182 chars)
COME AND SEE THIS WELL MAINTAINED 4 BEDROOM 1 BATHROOM HOME IN THE SPRINGFIELD AREA OF JACKSONVILLE. HARDWOOD FLOORS AND THE HVAC WAS REPLACED IN MAY 2024. GREAT INVESTMENT PROPERTY.
-
2024-07-01$175,000 Active 182-char remark
Show marketing remark (182 chars)
COME AND SEE THIS WELL MAINTAINED 4 BEDROOM 1 BATHROOM HOME IN THE SPRINGFIELD AREA OF JACKSONVILLE. HARDWOOD FLOORS AND THE HVAC WAS REPLACED IN MAY 2024. GREAT INVESTMENT PROPERTY.
-
2019-07-12soldstatus $63,000 Sold 267-char remark
Show marketing remark (267 chars)
Spacious 4 bedroom home located in Springfield, features everything new including granite counter tops,stainless steel appliances, luxury vinyl flooring,fully updated kitchen and bathroom,remote controlled ceiling fans, newer water heater and A/C units and much more!
-
2019-07-12soldstatus $63,000
Show marketing remark (267 chars)
Spacious 4 bedroom home located in Springfield, features everything new including granite counter tops,stainless steel appliances, luxury vinyl flooring,fully updated kitchen and bathroom,remote controlled ceiling fans, newer water heater and A/C units and much more!
-
2019-06-25status Pending 267-char remark
Show marketing remark (267 chars)
Spacious 4 bedroom home located in Springfield, features everything new including granite counter tops,stainless steel appliances, luxury vinyl flooring,fully updated kitchen and bathroom,remote controlled ceiling fans, newer water heater and A/C units and much more!
-
2019-06-21$64,900 Active 267-char remark
Show marketing remark (267 chars)
Spacious 4 bedroom home located in Springfield, features everything new including granite counter tops,stainless steel appliances, luxury vinyl flooring,fully updated kitchen and bathroom,remote controlled ceiling fans, newer water heater and A/C units and much more!
-
2019-04-16status Pending
-
2019-04-16historical
-
2019-04-01price $64,900
-
2019-03-23price $67,500
-
2019-03-16price $69,900
-
2019-03-09$75,000 Active
-
2018-12-13soldstatus $30,000 Sold
-
2018-11-30status Pending
-
2018-11-22$29,900 Active
-
2008-06-11historical
-
2008-06-06soldstatus $24,000
-
2008-01-03$27,000
-
2007-12-21historical
-
2007-11-14$39,900
ⓘ Source: listings_history table (triggers on properties + properties_extension) + one-shot
backfill from property_details.listing_events for pre-trigger history.
Tax reassessment forecast FL · Resets to sale price
- Current annual tax
- $1,969 · $164/mo
- Projected year-2 tax
- $1,969 · $164/mo
- Expected delta
- $0/yr ($0/mo · 0.0%)
ⓘ Screening estimate from a state-policy table — verify with the county assessor before closing.
Climate risk First Street
- Flood 1/10 Low FEMA zone X (unshaded) · 0% chance over 30 yrs
- Wildfire 1/10 Low
- Heat 9/10 Extreme 7 d/yr ≥107°F today · 20 d/yr by 30 yrs out
- Wind 9/10 Extreme 99% chance of damaging wind over 30 yrs
- Air quality 4/10 Moderate 6 unhealthy d/yr today · 6 by 30 yrs out
Nearby sold comps map
Loading sold comps map…
Walkable amenities ~0.75 mi
Loading nearby amenities…
Taxation est. · year 1
- Rental income
- $18,540
- − Mortgage interest
- −$8,402
- − Property taxes
- −$1,969
- − Insurance
- −$750
- − Repairs & maintenance
- −$1,483
- − Management
- −$1,483
- − Depreciation
- −$4,364
- Taxable income
- $89
- Est. tax owed @ 24.0%
- −$21
- After-tax cash flow
- $2,467/yr
For passive investors: Depreciation is non-cash, so a rental often shows a tax loss while cash-flowing — sheltering income. Rental losses are passive: they offset passive income freely, and up to $25,000/yr can offset ordinary (W-2) income if you actively participate and your MAGI is under $100k (phasing out to $0 by $150k); unused losses carry forward. On sale, claimed depreciation is recaptured at up to 25%, and gains may owe capital-gains tax (a 1031 exchange can defer both). Figures are a year-1 estimate at your 24.0% rate — not tax advice; consult a CPA.
Schools (NCES district)
- District
- Duval
- NCES district ID
- 1200480
- Math proficiency
- 46% ▼ -11.00%
- Reading proficiency
- 45% ▼ -4.00%
- Median HH income
- $48,987
- Composite
- 38.97/100
- National rank
- #4076
- State rank
- #48 of 73 in FL
Livability — Jacksonville
- Score
- 83/100
- State rank
- #50
- US rank
- #911
Category grades
Schools grade is shown separately in the Schools card above.
Census & demographics
- Census place
- Jacksonville, FL
- County
- Duval County · 1,015,274 people
- City population
- 979,034
- Metro
- Jacksonville, FL
- Population (ZIP)
- 17,105
- Household income
- $39,242
- Rent vs Own
- Severe rent burden
- 1057.0
Population outlook (Duval County) Hauer SSP2
- Today (2025)
- 1,013,010 people
- By 2030
- 1,059,228 · +4.6%
- By 2040
- 1,141,439 · +12.7%
- By 2050
- 1,205,258 · +19.0%
- By 2075
- 1,324,282 · +30.7%
- By 2100
- 1,319,620 · +30.3%
Race, ethnicity, and origin ACS 2023
- Neighborhood character
- Predominantly Black (65%)
- Race & ethnicity
- Black 65% White 22% Two or more races 8% Hispanic / Latino 6%
- Hispanic origin (detail)
- Mexican 1% Puerto Rican 2%
- Common ancestry
- Italian 2% Romanian 1% Slovak 1%
- Foreign-born
- 5% · Canada
- Languages at home
- 93% English-only · Spanish 3% Arabic 1% German/W. Germanic 1%
Political lean MEDSL · Duval
- 2024 margin
- Toss-up / Even · D 48.7% · R 50.1% · Other 1.2%
- 2008→2024 swing
- +0.4pp no change · 2008: -1.9pp · 2024: -1.5pp
- All cycles
- 2024: R+1.5 2020: D+3.8 2016: R+1.5 2012: R+3.6 2008: R+1.9
Not yet ingested
- Civics
- —
Market trends
- HPI YoY
- ▼ -64.55%
- Current HPI
- 208.1852
- Rent YoY
- ▲ 0.94%
- Metro
- Jacksonville, FL
- State GDP YoY
- ▲ 3.28%
- F500 in state
- 36
Industry mix (Fortune 500 HQ in FL)
| Industry | F500 HQs | Revenue |
|---|---|---|
| Industrial Technology | 2 | $29B |
|
||
| Insurance | 2 | $17B |
|
||
| Retail | 1 | $60B |
|
||
| Technology Distribution | 1 | $58B |
|
||
| Homebuilding | 1 | $35B |
|
||
| Technology Manufacturing | 1 | $35B |
|
||
Price history
+275.9% since first listed21 events — show timeline
- 2026-05-22 Listed $150,000 FSBO.com
- 2024-09-06 Listing Removed — realMLS
- 2024-07-01 Listed $175,000 realMLS
- 2019-07-12 Sold (Public Records) $63,000 Public Records
- 2019-07-12 Sold (MLS) $63,000 realMLS
- 2019-06-25 Pending — realMLS
- 2019-06-21 Listed $64,900 realMLS
- 2019-04-16 Pending — realMLS
- 2019-04-16 Listing Removed — realMLS
- 2019-04-01 Price Changed $64,900 realMLS
- 2019-03-23 Price Changed $67,500 realMLS
- 2019-03-16 Price Changed $69,900 realMLS
- 2019-03-09 Listed $75,000 realMLS
- 2018-12-13 Sold (MLS) $30,000 realMLS
- 2018-11-30 Pending — realMLS
- 2018-11-22 Listed $29,900 realMLS
- 2008-06-11 Listing Removed — realMLS
- 2008-06-06 Sold (MLS) $24,000 realMLS
- 2008-01-03 Listed $27,000 realMLS
- 2007-12-21 Listing Removed — realMLS
- 2007-11-14 Listed $39,900 realMLS
Property tax history
+10.9%/yrLatest (2025): $1,969 · +19.3% YoY. Source: county tax records.
Cash-flow waterfall
monthlySold comps — $/sqft
last 12 mo · ≤1 miLoading sold comps…