16969 Hazelnut Dr · Grangerland, TX
Flood risk No data
- FEMA flood zone
- —
- Chance of flooding over 30 yrs
- —
- Est. flood insurance / yr
- —
Fire risk No data
- Est. fire insurance / yr
- —
Heat risk No data
- Hot days now (above threshold)
- —
- Hot days in 30 yrs
- —
Wind risk No data
- Chance of severe wind over 30 yrs
- —
Air-quality risk No data
- Unhealthy air days now
- —
- Unhealthy air days in 30 yrs
- —
Risk factors via First Street. Map © Google.
Why this score? — see what drove the D+ grade
The composite is a weighted blend of 9 inputs, each scored 0–100. Each bar is that input's sub-score; the figure is the points it added to the 100-point composite (weight × sub-score).
- Cash flow +18.4/30.0
- ARV discount +7.5/15.0
- DSCR +5.8/10.0
- Schools +5.1/10.0
- 1% rule +3.9/10.0
- Rent growth +3.3/5.0
- Livability +2.5/5.0
- Condition / age +2.5/5.0
- Appreciation +0.0/10.0
$269,900
🖨 Deal sheet (PDF) 📄 Offer letter ✓ Due diligence
Listing remarks MLS
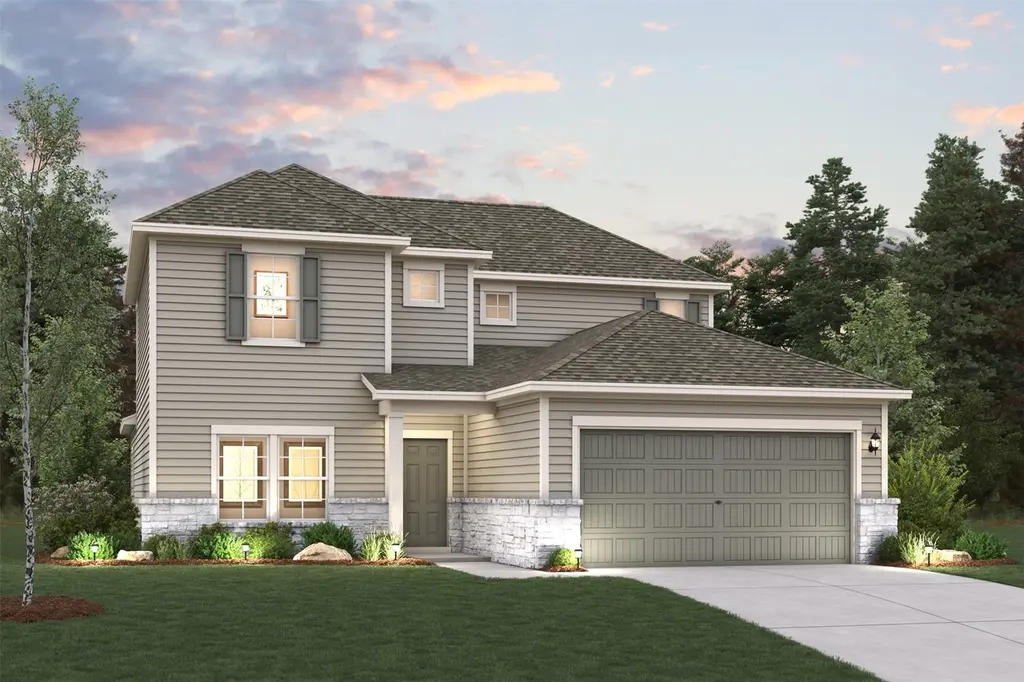
The two-story Lassen floor plan opens with an inviting porch entry that leads past private study and a powder room. An impressive open kitchen with a center island is adjacent and flows into a dining area and an airy great room, creating the perfect space for entertaining and everyday living. The owner’s suite is conveniently located on the main level and offers a walk-in closet and a private bath with dual vanities and a walk-in shower. Upstairs, there are two bedrooms and a bath, as well as a versatile loft space.
Key facts
- Dining area
- Porch entry
- Great room
Tags
Neighborhood map
What this means for you Summary
Snapshot
- This is a 3-bed/2.5-bath land listed at $270k.
Deal economics
- At list price, monthly cash flow is $253 ($3k/yr) — positive.
- The deal already cash-flows at list — no discount required.
- To meet the 1% rule (rent ≥ 1% of price), the offer needs to be $241k (10.6% below list).
- Recommended offer: $241k (10.6% below list) — sets the bar for 1% rule.
- Cap rate 7.4% vs local median 5.1% in Grangerland — top-decile yield for the area; either an underpriced asset or a hidden risk that comps aren't pricing in. Stress-test before assuming the spread holds.
Location & tenants
- Location reads: area grade D — affects rentability + tenant quality, not the cash-flow math above.
- Conroe ISD (other): math 57% / reading 57% proficiency, ranked #69 of 826 in TX (top 8%) — acceptable for families but not a draw, mixed tenant base, ~2y average lease.
- Zoned schools: Milam El (math 49% / reading 35%, grade F, #1,335 of 4,322 statewide, top 33%, 524 students, 82% FRL); Moorhead J H (math 35% / reading 42%, grade F, #704 of 1,662 statewide, top 43%, 1,391 students, 82% FRL); Conroe H S (math 32% / reading 51%, grade F, #767 of 1,632 statewide, top 47%, 4,915 students, 61% FRL) — zoned schools average 75% FRL vs 34% district-wide (40 pts higher); higher-poverty schools than district average — tighter screening recommended.
- Zoned-school proficiency averages 41% at this address vs 57% district-wide (-16 pts) — the specific schools serving this property underperform the Conroe ISD average; the district grade overstates school quality for this exact location.
- Market conditions: Rents rising (+3.3%/yr); 1117 active listings in the ZIP; 2 comparable units currently listed for rent nearby; solid renter incomes; 13,259 units permitted in Montgomery County in 2024 (1,402 in 5+ unit buildings).
- This rent runs 34% of the median local income ($85k/yr) — at the standard rent-burdened threshold; future hikes will face affordability resistance.
Forward outlook
- Local home prices are declining (-3.0%/yr); year-one equity from $2k of loan paydown is wiped out by about $8k of value loss. Plan a longer hold.
- Montgomery County population projected at +65% by 2050 — long-run rental-demand tailwind backs the buy-and-hold thesis.
Negotiation context
- It's been on market 87 days — a 6% lower offer ($254k) is reasonable based on typical stale-listing flexibility.
Questions for the listing agent
- It's been on market 87 days. Have you received any prior offers? Is the seller open to a 11% concession, seller financing, or rate buy-down credit?
- What does the HOA fee cover, when was the last increase, and are there any pending special assessments or reserve-fund shortfalls?
- Why hasn't it sold? Are there any deal-killer items the seller is aware of (foundation, flood, title, zoning, code violations)?
- Is there a deadline driving the sale (1031 exchange, divorce, estate, relocation)? That informs how much negotiation room exists.
- The area grade is low — what's the realistic commute time and amenity access for the typical tenant pool here? Any planned neighborhood developments (good or bad) we should know about?
- What's the average days-on-market for RENTAL listings here right now (not sales)? A rising rental-DOM trend means longer vacancies and softer asking-rent achievability than the comps imply.
- What's the recent tenant-quality profile in this submarket — average credit score on applications, eviction rate, late-payment / NSF rate, and stable-employment percentage? A property-management company in the area should have these aggregated.
- How much new for-sale + rental construction is in the pipeline within 1–3 miles? Heavy new supply typically softens prices + rents 12–24 months out; constrained supply supports both.
Investment metrics
- 1% rule
- 0.89% ✗
- Cap rate
- 7.42%
- Cash-on-cash
- 4.01%
- DSCR
- 1.18
- GRM
- 9.3
CMA / ARV
- ARV (median comp)
- $270,134
- List price
- $269,900
- Delta
- -0.09%
- Verdict
- FAIR
- Comps
- 20 within 1.0 mi
Projected returns pro-forma
-3.0% appreciation · 3.3% rent growth · sell at horizon
- IRR
- -9.8%
- Equity multiple
- 0.64×
- Total profit
- $-27,012
- Equity at exit
- $40,243
- IRR
- -0.0%
- Equity multiple
- 1.00×
- Total profit
- $-170
- Equity at exit
- $23,336
Cash invested: $75,572 (down + closing). Projections, not guarantees.
Landlord ↔ Tenant lean methodology
- Overall (STATE)
- 87 Strongly Landlord-Friendly
- State Texas
- 87 Strongly Landlord-Friendly · R+5
- County
- — inherits STATE
- City
- — inherits STATE
ZIP-level market 77302
- Rents YoY
- 3.3%
- Active inventory
- 1117
- Price-to-rent
- 9.3×
Monthly cashflow live
- Estimated rent
- $2,414 medium interval (Pro) →
- Mortgage (P&I)
- −$1,415
- Tax from tax record
- −$73 /mo · $872/yr
- Insurance
- −$112
- HOA
- −$54
- Vacancy / Maint / Mgmt
- −$507
- Net cashflow
- $253
Break-even live
Sensitivity live
| Price | -10% $405 | -5% $329 | +0% $253 | +5% $176 | +10% $100 |
|---|---|---|---|---|---|
| Rent | -10% $62 | -5% $157 | +0% $253 | +5% $348 | +10% $443 |
| Rate | -1.0pp $388 | -0.5pp $321 | base $253 | +0.5pp $183 | +1.0pp $111 |
UW: 25.0% down · 7.5% · 30yr · 1.5% tax · 5.0% vac · 8.0% maint · 8.0% mgmt
Financing live
Cash to close
- Down payment
- $67,475
- Closing costs
- $8,097
- Reserves months
- —
- Total cash needed
- —
Loan-product check · same deal, 3 products live
Conventional
25% down · 7.5% · 30yr
- Down + closing
- —
- Monthly P&I
- —
- Monthly cashflow
- —
- DSCR
- —
- Eligible?
- —
Personal DTI + credit; lowest rate.
DSCR
20% down · 8.5% · 30yr
- Down + closing
- —
- Monthly P&I
- —
- Monthly cashflow
- —
- DSCR
- —
- Eligible?
- —
No personal income docs; deal must DSCR.
Hard money
10% down · 12.0% · 12mo
- Down + closing
- —
- Monthly P&I
- —
- Monthly cashflow
- —
- DSCR
- —
- Eligible?
- —
Short-term bridge; refi at stabilization.
Rent comps 2 comps
| Address | Beds | Baths | Sqft | Rent | $/sqft | DOM | Units | Dist |
|---|---|---|---|---|---|---|---|---|
| 16703 Twisted Pine Dr Conroe, TX | 3.0–4.0 | 2.0–3.0 | 1671 | $1,900 | $1.14 | 0d | 13 | 0.28mi |
| 15447 Dapple Bluff Ln Conroe, TX | 4.0 | 2.5 | 2265 | $2,900 | $1.28 | 45d | 1 | 1.41mi |
HOA detail
- Monthly dues
- $54 · $648/yr
Listing history 6 events
-
2026-06-02status $269,900 Pending 87 DOM
-
2026-06-01days on market $269,900 Active 87 DOM
-
2026-05-31days on market $269,900 Active 86 DOM
-
2026-05-06price $269,900 527-char remark
Show marketing remark (527 chars)
The two-story Lassen floor plan opens with an inviting porch entry that leads past private study and a powder room. An impressive open kitchen with a center island is adjacent and flows into a dining area and an airy great room, creating the perfect space for entertaining and everyday living. The owner’s suite is conveniently located on the main level and offers a walk-in closet and a private bath with dual vanities and a walk-in shower. Upstairs, there are two bedrooms and a bath, as well as a versatile loft space.
-
2026-03-20price $306,900 527-char remark
Show marketing remark (527 chars)
The two-story Lassen floor plan opens with an inviting porch entry that leads past private study and a powder room. An impressive open kitchen with a center island is adjacent and flows into a dining area and an airy great room, creating the perfect space for entertaining and everyday living. The owner’s suite is conveniently located on the main level and offers a walk-in closet and a private bath with dual vanities and a walk-in shower. Upstairs, there are two bedrooms and a bath, as well as a versatile loft space.
-
2026-03-06$308,900 Active 527-char remark
Show marketing remark (527 chars)
The two-story Lassen floor plan opens with an inviting porch entry that leads past private study and a powder room. An impressive open kitchen with a center island is adjacent and flows into a dining area and an airy great room, creating the perfect space for entertaining and everyday living. The owner’s suite is conveniently located on the main level and offers a walk-in closet and a private bath with dual vanities and a walk-in shower. Upstairs, there are two bedrooms and a bath, as well as a versatile loft space.
ⓘ Source: listings_history table (triggers on properties + properties_extension) + one-shot
backfill from property_details.listing_events for pre-trigger history.
Tax reassessment forecast TX · Resets to sale price
- Current annual tax
- $872 · $73/mo
- Projected year-2 tax
- $4,939 · $412/mo
- Expected delta
- +$4,068/yr (+$339/mo · 466.6%)
ⓘ Screening estimate from a state-policy table — verify with the county assessor before closing.
Nearby sold comps map
Loading sold comps map…
Walkable amenities ~0.75 mi
Loading nearby amenities…
Taxation est. · year 1
- Rental income
- $28,968
- − Mortgage interest
- −$15,119
- − Property taxes
- −$872
- − Insurance
- −$1,350
- − Repairs & maintenance
- −$2,317
- − Management
- −$2,317
- − HOA
- −$648
- − Depreciation
- −$7,852
- Taxable loss
- −$1,507
- Est. tax savings @ 24.0%
- +$362
- After-tax cash flow
- $3,392/yr
For passive investors: Depreciation is non-cash, so a rental often shows a tax loss while cash-flowing — sheltering income. Rental losses are passive: they offset passive income freely, and up to $25,000/yr can offset ordinary (W-2) income if you actively participate and your MAGI is under $100k (phasing out to $0 by $150k); unused losses carry forward. On sale, claimed depreciation is recaptured at up to 25%, and gains may owe capital-gains tax (a 1031 exchange can defer both). Figures are a year-1 estimate at your 24.0% rate — not tax advice; consult a CPA.
Schools (NCES district)
- District
- Conroe ISD
- NCES district ID
- 4815000
- Math proficiency
- 57% ▼ -6.00%
- Reading proficiency
- 57% ▼ -1.00%
- Median HH income
- $71,541
- Composite
- 50.65/100
- National rank
- #1833
- State rank
- #69 of 826 in TX
Livability — Grangerland
No livability data for this city. (Only ~50 U.S. cities are tracked.)
Census & demographics
- County
- Montgomery County · 663,713 people
- Metro
- Houston-The Woodlands-Sugar Land, TX
- Population (ZIP)
- 21,546
- Household income
- $84,673
- Rent vs Own
- Severe rent burden
- 205.0
Population outlook (Montgomery County) Hauer SSP2
- Today (2025)
- 713,896 people
- By 2030
- 805,263 · +12.8%
- By 2040
- 992,708 · +39.1%
- By 2050
- 1,179,590 · +65.2%
- By 2075
- 1,628,084 · +128.1%
- By 2100
- 1,937,880 · +171.5%
Race, ethnicity, and origin ACS 2023
- Neighborhood character
- Majority White (63%)
- Race & ethnicity
- White 63% Hispanic / Latino 29% Two or more races 19% Black 3% Asian 1%
- Hispanic origin (detail)
- Mexican 26% Puerto Rican 1%
- Common ancestry
- Lithuanian 3% Italian 2% Slovak 2%
- Foreign-born
- 13% · Canada, Vietnam, China
- Languages at home
- 78% English-only · Spanish 20% Russian/Polish/Slavic 1% Other Indo-European 0%
Political lean MEDSL · Montgomery
- 2024 margin
- Solid R (+45.5) · D 26.8% · R 72.3%
- 2008→2024 swing
- +7.2pp toward D · 2008: -52.7pp · 2024: -45.5pp
- All cycles
- 2024: R+45.5 2020: R+43.8 2016: R+51.4 2012: R+60.7 2008: R+52.7
Not yet ingested
- Civics
- —
Market trends
- HPI YoY
- ▼ -187.56%
- Current HPI
- 262.1879
- Rent YoY
- ▲ 3.30%
- Metro
- Houston-The Woodlands-Sugar Land, TX
- State GDP YoY
- ▲ 3.95%
- F500 in state
- 110
Industry mix (Fortune 500 HQ in TX)
| Industry | F500 HQs | Revenue |
|---|---|---|
| Energy | 16 | $1,198B |
|
||
| Technology | 5 | $198B |
|
||
| Engineering / Construction | 4 | $72B |
|
||
| Energy Services | 3 | $60B |
|
||
| Utilities | 3 | $41B |
|
||
| Healthcare | 2 | $330B |
|
||
Price history
-12.6% since first listed3 events — show timeline
- 2026-05-06 Price Changed $269,900 HARMLS
- 2026-03-20 Price Changed $306,900 HARMLS
- 2026-03-06 Listed $308,900 HARMLS
Property tax history
-0.2%/yrLatest (2025): $872 · -0.2% YoY. Source: county tax records.
Cash-flow waterfall
monthlySold comps — $/sqft
last 12 mo · ≤1 miLoading sold comps…