21248 Seminole St · Lockhart, AL
Flood risk 1/10 · Minimal
- FEMA flood zone
- X (unshaded)
- Chance of flooding over 30 yrs
- 0.0%
- Est. flood insurance / yr
- $507 – $1,088
Fire risk 4/10 · Minor
- Est. fire insurance / yr
- $916 – $1,700
Heat risk 8/10 · Major
- Hot days now (above 107°F)
- 7 days/yr
- Hot days in 30 yrs
- 19 days/yr
Wind risk 9/10 · Severe
- Chance of severe wind over 30 yrs
- 99.0%
Air-quality risk 1/10 · Minimal
- Unhealthy air days now
- 0 days/yr
- Unhealthy air days in 30 yrs
- 0 days/yr
Risk factors via First Street. Map © Google.
Why this score? — see what drove the C grade
The composite is a weighted blend of 9 inputs, each scored 0–100. Each bar is that input's sub-score; the figure is the points it added to the 100-point composite (weight × sub-score).
- Cash flow +16.8/30.0
- ARV discount +13.9/15.0
- DSCR +5.2/10.0
- Appreciation +5.0/10.0
- 1% rule +3.3/10.0
- Schools +3.2/10.0
- Livability +3.2/5.0
- Rent growth +2.5/5.0
- Condition / age +2.5/5.0
$139,900
🖨 Deal sheet 📄 Offer letter ✓ Due diligence
Listing remarks
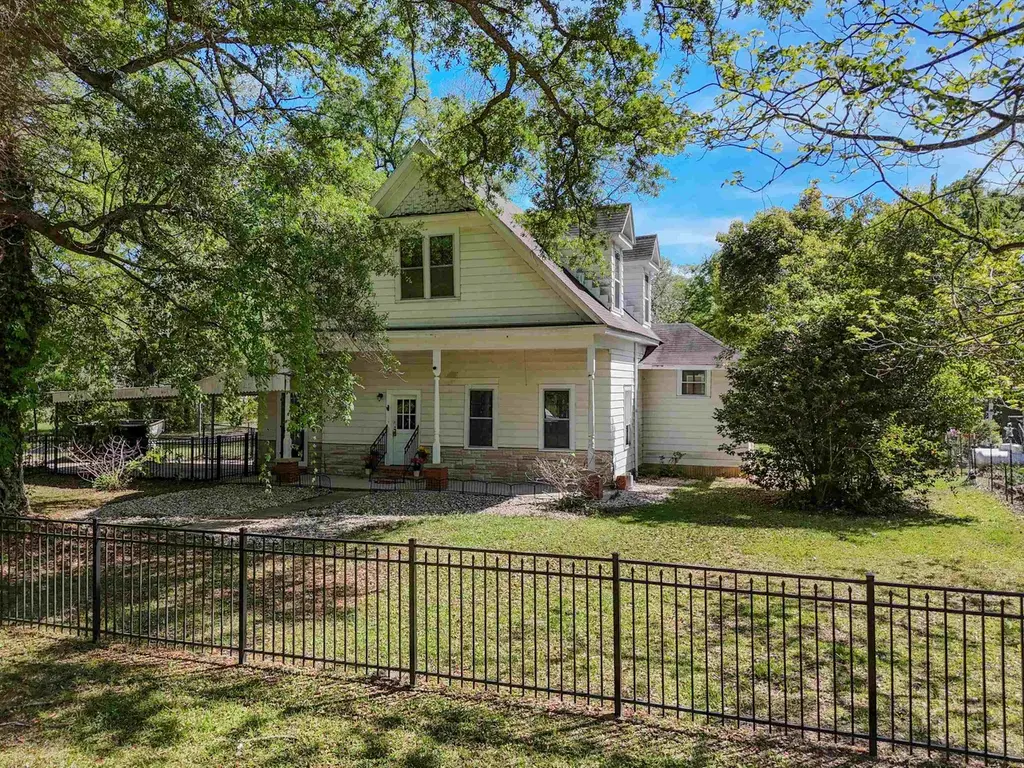
Classic 1910 2 story house, charming 3/1 house sits on a generous shaded corner lot with a large fenced-in yard, perfect for pets, outdoor activities with the family, or just enjoying the peace and quiet. The home features a brand-new tankless water heater, new HVAC, new mini-split units upstairs for year-round comfort. Home has new gas lines under house, and the roof is less than 10 years old. A portion of the house has tongue and groove walls, other are paneling. French doors and all the charm are still in place. Home welcomes you with a custom-made fence, covering trees and a large, covered porch great for afternoon relaxing. Attached carport, lots of flowering shrubs to enjoy plus Ellio
Key facts
- Shaded corner lot
- Large fenced-in yard
- New hvac
Tags
Neighborhood map
What this means for you Summary
Snapshot
- This is a 3-bed/1.0-bath single-family listed at $140k.
Deal economics
- At list price, monthly cash flow is $90 ($1k/yr) — positive.
- The deal already cash-flows at list — no discount required.
- To meet the 1% rule (rent ≥ 1% of price), the offer needs to be $117k (16.6% below list).
- Recommended offer: $117k (16.6% below list) — sets the bar for 1% rule.
Location & tenants
- Location reads 63/100 on livability (#183 in AL) — a middle-class / working-renter tenant base. Strengths: crime A+, cost of living A+, housing A+; Watch: health & safety C-, schools D, amenities F.
- Covington County (rural): math 27% / reading 50% proficiency, ranked #32 of 129 in AL (top 25%) — families likely to look elsewhere, expect single-tenant / working-renter base with shorter leases.
- Market conditions: 1 active listings in the ZIP; 13 units permitted in Covington County in 2024 (0 in 5+ unit buildings).
Forward outlook
- In year one you build about $5k of equity ($967 loan paydown + $4k appreciation (3.0% local appreciation)).
- Covington County population projected to shrink 10% by 2050 — rents likely to lag national; underwrite the cash flow, not the appreciation.
- At projected returns (3.0% appreciation + 3.0% rent growth), your $39k cash investment doubles in ~6 years — after that, you're playing with house money.
- By year 7, paydown + projected appreciation supports a ~$33k cash-out refi (75% LTV) — recoverable capital for the next deal without selling this one.
Negotiation context
- It's been on market 60 days — a 3% lower offer ($136k) is reasonable based on typical stale-listing flexibility.
- Current owner paid $60k; list at $140k implies a 133% gain — meaningful room to come down on a strong offer.
Risks & watch-outs
- Watch-outs: built in 1910 — expect roof / HVAC / electrical / plumbing capex.
- Climate carrying-cost: severe wind risk, 99% chance of damaging wind over 30y; extreme-heat days projected 7→19/yr by 2055 (HVAC capex compounding) — expect insurance premiums to compound above CPI over the hold.
Questions for the listing agent
- It's been on market 60 days. Have you received any prior offers? Is the seller open to a 17% concession, seller financing, or rate buy-down credit?
- Built in 1910 — when were the roof, HVAC, electrical panel, plumbing, and water heater last replaced?
- Is there a deadline driving the sale (1031 exchange, divorce, estate, relocation)? That informs how much negotiation room exists.
- Schools are D-rated, which usually means shorter tenancies and higher turnover. Who's the typical renter profile here, and what's been the actual vacancy rate?
- What's the average days-on-market for RENTAL listings here right now (not sales)? A rising rental-DOM trend means longer vacancies and softer asking-rent achievability than the comps imply.
- What's the recent tenant-quality profile in this submarket — average credit score on applications, eviction rate, late-payment / NSF rate, and stable-employment percentage? A property-management company in the area should have these aggregated.
- How much new for-sale + rental construction is in the pipeline within 1–3 miles? Heavy new supply typically softens prices + rents 12–24 months out; constrained supply supports both.
Investment metrics
- 1% rule
- 0.83% ✗
- Cap rate
- 7.07%
- Cash-on-cash
- 2.77%
- DSCR
- 1.12
- GRM
- 10.0
CMA / ARV
- ARV (median comp)
- $163,191
- List price
- $139,900
- Delta
- -14.27%
- Verdict
- UNDERPRICED
- Comps
- 8 within 1.0 mi
Show comp detail 3 sales within ~0.75 mi
| Address | Dist | Beds/Ba | Sqft | Sold | Price | $/sf | Match |
|---|---|---|---|---|---|---|---|
| 21249 Cherokee Ave | 0.07mi | 3/1.0 | 2,024 (-7%) | 3mo | $65,000 | $32 | 82 |
| 21220 Cherokee Ave | 0.09mi | 3/2.0 | 2,344 (+8%) | 1mo | $225,000 | $96 | 78 |
| 21904 Rappahannock Ave | 0.17mi | 3/2.0 | 2,148 (-1%) | 14mo | $189,900 | $88 | 75 |
Match score weights: distance 35% · size 25% · config 20% · recency 20%. Top-matched comps best support the ARV.
Projected returns pro-forma
3.0% appreciation · 3.0% rent growth · sell at horizon
- IRR
- 10.1%
- Equity multiple
- 1.58×
- Total profit
- $22,550
- Equity at exit
- $62,905
- IRR
- 12.4%
- Equity multiple
- 2.84×
- Total profit
- $72,132
- Equity at exit
- $96,944
Cash invested: $39,172 (down + closing). Projections, not guarantees.
Landlord ↔ Tenant lean methodology
- Overall (STATE)
- 90 Strongly Landlord-Friendly
- State Alabama
- 90 Strongly Landlord-Friendly · R+15
- County
- — inherits STATE
- City
- — inherits STATE
ZIP-level market 36455
- Active inventory
- 1
- Price-to-rent
- 10.0×
Monthly cashflow live
- Estimated rent
- $1,167 medium interval (Pro) →
- Mortgage (P&I)
- −$734
- Tax from tax record
- −$40 /mo · $475/yr
- Insurance
- −$58
- HOA
- −$0
- Vacancy / Maint / Mgmt
- −$245
- Net cashflow
- $90
Break-even live
UW: 25.0% down · 7.5% · 30yr · 1.5% tax · 5.0% vac · 8.0% maint · 8.0% mgmt
Financing live
Cash to close
- Down payment
- $34,975
- Closing costs
- $4,197
- Reserves months
- —
- Total cash needed
- —
Loan-product check · same deal, 3 products live
Conventional
25% down · 7.5% · 30yr
- Down + closing
- —
- Monthly P&I
- —
- Monthly cashflow
- —
- DSCR
- —
- Eligible?
- —
Personal DTI + credit; lowest rate.
DSCR
20% down · 8.5% · 30yr
- Down + closing
- —
- Monthly P&I
- —
- Monthly cashflow
- —
- DSCR
- —
- Eligible?
- —
No personal income docs; deal must DSCR.
Hard money
10% down · 12.0% · 12mo
- Down + closing
- —
- Monthly P&I
- —
- Monthly cashflow
- —
- DSCR
- —
- Eligible?
- —
Short-term bridge; refi at stabilization.
Listing history 19 events
-
2026-06-19days on market $139,900 Active 60 DOM
-
2026-06-18days on market $139,900 Active 59 DOM
-
2026-06-17days on market $139,900 Active 58 DOM
-
2026-06-16days on market $139,900 Active 57 DOM
-
2026-06-15days on market $139,900 Active 56 DOM
-
2026-06-14days on market $139,900 Active 54 DOM
-
2026-06-12days on market $139,900 Active 53 DOM
-
2026-06-09days on market $139,900 Active 50 DOM
-
2026-06-08days on market $139,900 Active 49 DOM
-
2026-06-07days on market $139,900 Active 48 DOM
-
2026-06-07days on market $139,900 Active 47 DOM
-
2026-06-04days on market $139,900 Active 44 DOM
-
2026-06-02days on market $139,900 Active 43 DOM
-
2026-06-01days on market $139,900 Active 42 DOM
-
2026-05-31days on market $139,900 Active 41 DOM
-
2026-05-31days on market $139,900 Active 40 DOM
-
2026-04-27price $139,900
-
2026-04-09$159,900 Active
-
2022-03-31soldstatus $60,000
ⓘ Source: listings_history table (triggers on properties + properties_extension) + one-shot
backfill from property_details.listing_events for pre-trigger history.
Tax reassessment forecast AL · Resets to sale price
- Current annual tax
- $475 · $40/mo
- Projected year-2 tax
- $574 · $48/mo
- Expected delta
- +$99/yr (+$8/mo · 20.7%)
ⓘ Screening estimate from a state-policy table — verify with the county assessor before closing.
Climate risk First Street
- Flood 1/10 Low FEMA zone X (unshaded) · 0% chance over 30 yrs
- Wildfire 4/10 Moderate
- Heat 8/10 Severe 7 d/yr ≥107°F today · 19 d/yr by 30 yrs out
- Wind 9/10 Extreme 99% chance of damaging wind over 30 yrs
- Air quality 1/10 Low 0 unhealthy d/yr today · 0 by 30 yrs out
Nearby sold comps map
Loading sold comps map…
Walkable amenities ~0.75 mi
Loading nearby amenities…
Taxation est. · year 1
- Rental income
- $14,005
- − Mortgage interest
- −$7,837
- − Property taxes
- −$475
- − Insurance
- −$700
- − Repairs & maintenance
- −$1,120
- − Management
- −$1,120
- − Depreciation
- −$4,070
- Taxable loss
- −$1,317
- Est. tax savings @ 24.0%
- +$316
- After-tax cash flow
- $1,402/yr
For passive investors: Depreciation is non-cash, so a rental often shows a tax loss while cash-flowing — sheltering income. Rental losses are passive: they offset passive income freely, and up to $25,000/yr can offset ordinary (W-2) income if you actively participate and your MAGI is under $100k (phasing out to $0 by $150k); unused losses carry forward. On sale, claimed depreciation is recaptured at up to 25%, and gains may owe capital-gains tax (a 1031 exchange can defer both). Figures are a year-1 estimate at your 24.0% rate — not tax advice; consult a CPA.
Schools (NCES district)
- District
- Covington County
- NCES district ID
- 0100930
- Math proficiency
- 27% ▼ -21.00%
- Reading proficiency
- 50% ▬ 0.00%
- Median HH income
- $39,213
- Composite
- 32.13/100
- National rank
- #5797
- State rank
- #32 of 129 in AL
Livability — Lockhart
- Score
- 63/100
- State rank
- #183
- US rank
- #15412
Category grades
Schools grade is shown separately in the Schools card above.
Census & demographics
- Census place
- Lockhart, AL
- City population
- 284
- Population (ZIP)
- 284
Population outlook (Covington County) Hauer SSP2
- Today (2025)
- 37,007 people
- By 2030
- 36,401 · -1.6%
- By 2040
- 34,983 · -5.5%
- By 2050
- 33,437 · -9.6%
- By 2075
- 29,753 · -19.6%
- By 2100
- 25,109 · -32.2%
Race, ethnicity, and origin ACS 2023
- Neighborhood character
- Predominantly White (90%)
- Race & ethnicity
- White 90% Black 6% Hispanic / Latino 3%
- Foreign-born
- 3% · Canada
- Languages at home
- 94% English-only · Spanish 6%
Political lean MEDSL · Covington
- 2024 margin
- Solid R (+72.4) · D 13.6% · R 86.0%
- 2008→2024 swing
- -14.1pp toward R · 2008: -58.3pp · 2024: -72.4pp
- All cycles
- 2024: R+72.4 2020: R+68.1 2016: R+68.5 2012: R+58.3 2008: R+58.3
Not yet ingested
- Civics
- —
Market trends
- HPI YoY
- —
- Current HPI
- —
- Rent YoY
- —
- Metro
- —
- State GDP YoY
- ▲ 2.94%
- F500 in state
- 4
Industry mix (Fortune 500 HQ in AL)
| Industry | F500 HQs | Revenue |
|---|---|---|
| Financial Services | 1 | $8B |
|
||
| Healthcare | 1 | $5B |
|
||
Price history
+133.2% since first listed3 events — show timeline
- 2026-04-27 Price Changed $139,900 CAOR
- 2026-04-09 Listed $159,900 CAOR
- 2022-03-31 Sold (Public Records) $60,000 Public Records
Property tax history
+3.6%/yrLatest (2025): $475 · +0.0% YoY. Source: county tax records.
Cash-flow waterfall
monthlySold comps — $/sqft
last 12 mo · ≤1 miLoading sold comps…