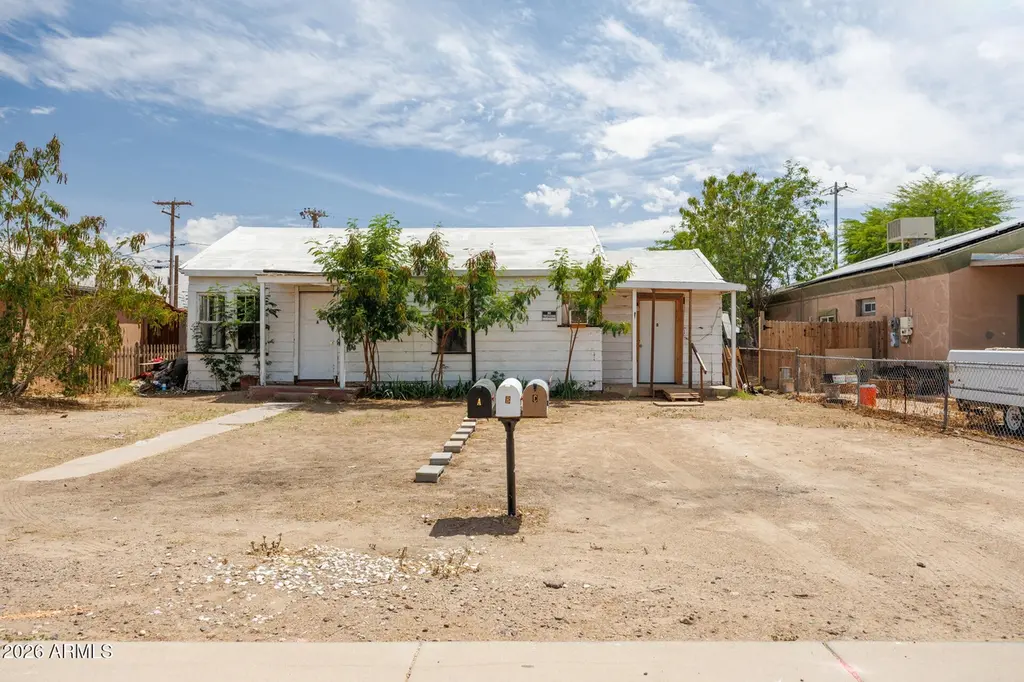
535 W Lincoln Ave · Coolidge, AZ
Flood risk 1/10 · Minimal
- FEMA flood zone
- X (unshaded)
- Chance of flooding over 30 yrs
- 0.0%
- Est. flood insurance / yr
- $507 – $1,088
Fire risk 6/10 · Moderate
- Est. fire insurance / yr
- $610 – $1,132
Heat risk 9/10 · Severe
- Hot days now (above 113°F)
- 7 days/yr
- Hot days in 30 yrs
- 19 days/yr
Wind risk 1/10 · Minimal
- Chance of severe wind over 30 yrs
- —
Air-quality risk 1/10 · Minimal
- Unhealthy air days now
- 0 days/yr
- Unhealthy air days in 30 yrs
- 0 days/yr
Risk factors via First Street. Map © Google.
Why this score? — see what drove the B- grade
The composite is a weighted blend of 9 inputs, each scored 0–100. Each bar is that input's sub-score; the figure is the points it added to the 100-point composite (weight × sub-score).
- Cash flow +30.0/30.0
- 1% rule +10.0/10.0
- DSCR +10.0/10.0
- ARV discount +7.5/15.0
- Livability +2.9/5.0
- Rent growth +2.7/5.0
- Condition / age +2.5/5.0
- Schools +1.0/10.0
- Appreciation +0.0/10.0
$99,000
🖨 Deal sheet 📄 Offer letter ✓ Due diligence
Listing remarks
Motivated Seller! Calling all investors! This duplex is located in the heart of Coolidge, with nearby restaurants, shopping, and schools. While this property is zoned R-2 and currently functions as a duplex, it can easily be converted back to a single-family home. Unit A is a 2 bed/1bath and is currently vacant. Unit B is a 1 bed/1 bath and is currently rented. Potential for instant and future income by rehabbing and renting out the vacant unit. This property offers tons of upside potential for somebody willing to put in some work. Bring all offers!
Key facts
- Zoned r-2
- 7,628 sq ft lot
- Built 1949
Tags
Property features AI
Finance
- Financial info: Annual tax information available (amounts excluded per instructions)
- HOA & community: No association fees
Exterior
- Utilities: Public sewer; Private water company
- Home design: Single family residence; Fee simple ownership
- Construction: Wood siding and wood frame construction; Painted exterior; Reflective coating and rolled/hot mop roof
- Exterior features: Front and back areas are dirt; Partial block and chain link fencing
Interior
- Bedrooms: Up to 3 possible bedrooms
- Flooring: Carpet; Laminate
- Bathrooms: 2 full bathrooms
- Heating & cooling: Has cooling (type listed as Other); No heating
- Interior features: Carpet and laminate flooring; No built-in laundry (no laundry features listed)
- Laundry & utility: No laundry hookups/features listed
Neighborhood map
What this means for you Summary
Snapshot
- This is a 3-bed/2.0-bath single-family listed at $99k.
Deal economics
- At list price, monthly cash flow is $703 ($8k/yr) — positive.
- The deal already cash-flows at list — no discount required.
- Meets the 1% rule at list price ($2k rent vs $99k).
- Recommended offer: $98k (1.5% below list) — sets the bar for market timing.
- Cap rate 14.8% vs local median 4.5% in Coolidge — top-decile yield for the area; either an underpriced asset or a hidden risk that comps aren't pricing in. Stress-test before assuming the spread holds.
Location & tenants
- Location reads 57/100 on livability (#235 in AZ) — a working-class tenant base; expect higher turnover. Strengths: cost of living A+, housing A+; Watch: employment D, amenities F, commute F.
- Coolidge Unified District (4442) (town): math 8% / reading 14% proficiency, ranked #229 of 249 in AZ (top 92%) — low school quality limits family demand, transient renter base, plan for 1-2y turnover; 68% free/reduced lunch — lower-income household profile, screen leases tightly.
- Zoned schools: West Elementary School (math 6% / reading 13%, grade F, #1,037 of 1,109 statewide, top 94%, 733 students, 74% FRL); Coolidge Jr. High School (math 7% / reading 11%, grade F, #200 of 218 statewide, top 93%, 362 students, 80% FRL); Coolidge High School (math 8% / reading 12%, grade F, #343 of 381 statewide, top 93%, 640 students, 68% FRL).
- Market conditions: Rents flat; 260 active listings in the ZIP; 36 comparable units currently listed for rent nearby; rentals at typical pace (median 24d on market — plan ~3-4 weeks tenant-placement turnaround); 44% of comp listings sitting > 30 days — soft ceiling on asking rent; 9,504 units permitted in Pinal County in 2024 (776 in 5+ unit buildings).
- This rent runs 30% of the median local income ($65k/yr) — at the standard rent-burdened threshold; future hikes will face affordability resistance.
Forward outlook
- Local home prices are declining (-3.0%/yr); year-one equity from $684 of loan paydown is wiped out by about $3k of value loss. Plan a longer hold.
- At projected returns (-3.0% appreciation + 1.0% rent growth), your $28k cash investment doubles in ~5 years — after that, you're playing with house money.
Negotiation context
- It's been on market 17 days — a 2% lower offer ($98k) is reasonable based on typical stale-listing flexibility.
- 3 sale attempts since 2y ago with the ask held roughly flat each time — persistent listings suggest the price (not the market) is what's stuck; bring a comps-based counter.
- Current owner paid $80k; 24% above their basis — modest negotiation headroom, anchor on the comps not their cost.
Risks & watch-outs
- Watch-outs: built in 1949 — expect roof / HVAC / electrical / plumbing capex.
- Climate carrying-cost: major wildfire risk; extreme-heat days projected 7→19/yr by 2055 (HVAC capex compounding) — expect insurance premiums to compound above CPI over the hold.
Questions for the listing agent
- Built in 1949 — when were the roof, HVAC, electrical panel, plumbing, and water heater last replaced?
- Is there a deadline driving the sale (1031 exchange, divorce, estate, relocation)? That informs how much negotiation room exists.
- Schools are F-rated, which usually means shorter tenancies and higher turnover. Who's the typical renter profile here, and what's been the actual vacancy rate?
- What's the average days-on-market for RENTAL listings here right now (not sales)? A rising rental-DOM trend means longer vacancies and softer asking-rent achievability than the comps imply.
- What's the recent tenant-quality profile in this submarket — average credit score on applications, eviction rate, late-payment / NSF rate, and stable-employment percentage? A property-management company in the area should have these aggregated.
- How much new for-sale + rental construction is in the pipeline within 1–3 miles? Heavy new supply typically softens prices + rents 12–24 months out; constrained supply supports both.
Investment metrics
- 1% rule
- 1.66% ✓
- Cap rate
- 14.82%
- Cash-on-cash
- 30.44%
- DSCR
- 2.35
- GRM
- 5.0
CMA / ARV
- ARV (median comp)
- $239,851
- List price
- $99,000
- Delta
- -58.72%
- Verdict
- UNDERPRICED
- Comps
- 20 within 1.0 mi
Show comp detail 12 sales within ~0.75 mi
| Address | Dist | Beds/Ba | Sqft | Sold | Price | $/sf | Match |
|---|---|---|---|---|---|---|---|
| 535 W Lincoln Ave | 0.00mi | 3/2.0 | 1,282 (0%) | 0mo | $80,000 | $62 | 100 |
| 554 W Lincoln Ave | 0.04mi | 4/2.0 (+1) | 1,393 (+9%) | 3mo | $292,000 | $210 | 76 |
| 541 W Roosevelt Ave | 0.29mi | 3/2.0 | 1,328 (+4%) | 6mo | $255,000 | $192 | 76 |
| 426 W Gibson Ave | 0.45mi | 3/2.0 | 1,167 (-9%) | 1mo | $175,000 | $150 | 63 |
| 318 W Roosevelt Ave | 0.42mi | 3/2.0 | 1,444 (+13%) | 2mo | $279,000 | $193 | 57 |
| 1063 W Verde Ln | 0.71mi | 3/2.0 | 1,217 (-5%) | 2mo | $248,675 | $204 | 57 |
| 667 W Pinkley Ave W | 0.45mi | 2/1.0 (-1) | 1,221 (-5%) | 6mo | $200,000 | $164 | 57 |
| 614 W Roosevelt Ave | 0.34mi | 3/2.0 | 1,461 (+14%) | 7mo | $265,500 | $182 | 55 |
| 352 W Roosevelt Ave | 0.40mi | 4/2.0 (+1) | 1,440 (+12%) | 1mo | $90,825 | $63 | 55 |
| 1064 W Starview Ave | 0.73mi | 3/2.0 | 1,328 (+4%) | 7mo | $235,762 | $178 | 55 |
| 232 W Lincoln Ave | 0.36mi | 4/3.0 (+1) | 1,456 (+14%) | 2mo | $249,900 | $172 | 50 |
| 1820 S 7th St | 0.75mi | 3/2.0 | 1,122 (-12%) | 4mo | $225,000 | $201 | 41 |
Match score weights: distance 35% · size 25% · config 20% · recency 20%. Top-matched comps best support the ARV.
Projected returns pro-forma
-3.0% appreciation · 0.97% rent growth · sell at horizon
- IRR
- 22.9%
- Equity multiple
- 1.92×
- Total profit
- $25,412
- Equity at exit
- $14,761
- IRR
- 29.6%
- Equity multiple
- 3.41×
- Total profit
- $66,682
- Equity at exit
- $8,560
Cash invested: $27,720 (down + closing). Projections, not guarantees.
Landlord ↔ Tenant lean methodology
- Overall (STATE)
- 87 Strongly Landlord-Friendly
- State Arizona
- 87 Strongly Landlord-Friendly · R+3
- County
- — inherits STATE
- City
- — inherits STATE
ZIP-level market 85128
- Home prices YoY
- -7.9%
- Rents YoY
- 1.0%
- Active inventory
- 260
- Price-to-rent
- 5.0×
Monthly cashflow live
- Estimated rent
- $1,648 high interval (Pro) →
- Mortgage (P&I)
- −$519
- Tax from tax record
- −$38 /mo · $458/yr
- Insurance
- −$41
- HOA
- −$0
- Vacancy / Maint / Mgmt
- −$346
- Net cashflow
- $703
Break-even live
UW: 25.0% down · 7.5% · 30yr · 1.5% tax · 5.0% vac · 8.0% maint · 8.0% mgmt
Financing live
Cash to close
- Down payment
- $24,750
- Closing costs
- $2,970
- Reserves months
- —
- Total cash needed
- —
Loan-product check · same deal, 3 products live
Conventional
25% down · 7.5% · 30yr
- Down + closing
- —
- Monthly P&I
- —
- Monthly cashflow
- —
- DSCR
- —
- Eligible?
- —
Personal DTI + credit; lowest rate.
DSCR
20% down · 8.5% · 30yr
- Down + closing
- —
- Monthly P&I
- —
- Monthly cashflow
- —
- DSCR
- —
- Eligible?
- —
No personal income docs; deal must DSCR.
Hard money
10% down · 12.0% · 12mo
- Down + closing
- —
- Monthly P&I
- —
- Monthly cashflow
- —
- DSCR
- —
- Eligible?
- —
Short-term bridge; refi at stabilization.
Rent comps 36 comps
| Address | Beds | Baths | Sqft | Rent | $/sqft | DOM | Units | Dist |
|---|---|---|---|---|---|---|---|---|
| 393 W Seagoe Ave Unit B Coolidge, AZ | 3.0 | 2.0 | 1030 | $1,250 | $1.21 | 43d | 1 | 0.20mi |
| 611 W Verde Ln Coolidge, AZ | 3.0 | 2.0 | 1681 | $1,395 | $0.83 | 43d | 1 | 0.29mi |
| 232 W Elm Ave Unit B Coolidge, AZ | 4.0 | 2.5 | 1452 | $1,350 | $0.93 | 43d | 1 | 0.38mi |
| 144 W Lincoln Ave Coolidge, AZ | 3.0 | 2.0 | 1125 | $1,299 | $1.15 | 3d | 1 | 0.45mi |
| 440 W Taylor Ave Coolidge, AZ | 2.0 | 1.0 | 992 | $1,250 | $1.26 | 15d | 1 | 0.68mi |
| 1505 S Navajo Ln Coolidge, AZ | 3.0 | 2.5 | 1743 | $1,700 | $0.98 | 43d | 1 | 0.68mi |
| 1081 W Palo Verde Ave Coolidge, AZ | 4.0 | 2.0 | 1517 | $1,750 | $1.15 | 5d | 1 | 0.70mi |
| 342 W Taylor Ave Coolidge, AZ | 3.0 | 1.5 | 1008 | $1,500 | $1.49 | 43d | 1 | 0.70mi |
| 1211 W Wilson Ave Coolidge, AZ | 3.0 | 2.0 | 1543 | $1,625 | $1.05 | 43d | 1 | 0.77mi |
| 313 E Central Ave Coolidge, AZ | 2.0 | 2.0 | 1393 | $1,200 | $0.86 | 43d | 1 | 0.79mi |
| 1204 W Prior Ave Coolidge, AZ | 3.0 | 2.0 | 1280 | $1,595 | $1.25 | 43d | 1 | 0.79mi |
| 392 E Dirkley Ave Coolidge, AZ | 4.0 | 2.5 | 1440 | $1,700 | $1.18 | 43d | 1 | 0.82mi |
| 1209 W Seagoe Ave Coolidge, AZ | 4.0 | 2.0 | 1608 | $1,695 | $1.05 | 43d | 1 | 0.84mi |
| 227 W Douglas Ave Coolidge, AZ | 3.0 | 2.0 | 1202 | $1,595 | $1.33 | 43d | 1 | 0.92mi |
| 144 W Douglas Ave Coolidge, AZ | 4.0 | 2.0 | 1801 | $1,639 | $0.91 | 3d | 1 | 0.92mi |
| 1660 S Wooten St Coolidge, AZ | 3.0 | 2.5 | 1385 | $1,500 | $1.08 | 5d | 1 | 0.92mi |
| 311 W Bealey Ave Coolidge, AZ | 3.0 | 1.5 | 1000 | $1,250 | $1.25 | 20d | 1 | 0.92mi |
| 1286 W Roosevelt Ave Coolidge, AZ | 4.0 | 2.0 | 1604 | $1,649 | $1.03 | 20d | 1 | 0.95mi |
| 1824 S Wooten St Coolidge, AZ | 3.0 | 2.5 | 1621 | $1,575 | $0.97 | 5d | 1 | 0.98mi |
| 131 E Patton Ave Coolidge, AZ | 4.0 | 2.0 | 1221 | $2,200 | $1.80 | 43d | 1 | 1.05mi |
| 816 W Mid Way St Coolidge, AZ | 3.0 | 2.0 | 1448 | $1,600 | $1.10 | 24d | 1 | 1.06mi |
| 228 W Hess Ave Coolidge, AZ | 2.0 | 2.0 | 1020 | $1,450 | $1.42 | 24d | 1 | 1.11mi |
| 940 N Sonora St Coolidge, AZ | 3.0 | 2.0 | 1290 | $1,500 | $1.16 | 43d | 1 | 1.17mi |
| 1019 W Hess Ave Coolidge, AZ | 4.0 | 2.0 | 1590 | $1,700 | $1.07 | 43d | 1 | 1.19mi |
| 1451 W Pinkley Ave Coolidge, AZ | 3.0 | 2.0 | 1490 | $1,600 | $1.07 | 18d | 1 | 1.19mi |
| 1304 W Byrd Ave Coolidge, AZ | 4.0 | 2.0 | 1775 | $1,725 | $0.97 | 24d | 1 | 1.21mi |
| 1304 W Byrd Ave Coolidge, AZ | 4.0 | 2.0 | 1775 | $1,725 | $0.97 | 20d | 1 | 1.21mi |
| 651 N 13th Pl Coolidge, AZ | 4.0 | 2.5 | 1858 | $2,300 | $1.24 | 5d | 1 | 1.22mi |
| 1224 N Palm Ln Coolidge, AZ | 4.0 | 2.0 | 1280 | $1,800 | $1.41 | 20d | 1 | 1.24mi |
| 203 S 16th St Coolidge, AZ | 3.0 | 2.5 | 1389 | $1,550 | $1.12 | 24d | 1 | 1.25mi |
| 903 N California St Coolidge, AZ | 2.0–4.0 | 1.0–2.0 | 979 | $1,602 | $1.64 | 5d | 1 | 1.26mi |
| 903 N California St Coolidge, AZ | 2.0–4.0 | 1.0–2.0 | 979 | $1,602 | $1.64 | 17d | 8 | 1.26mi |
| 1105 N Cota Ln Coolidge, AZ | 3.0 | 1.5 | 1321 | $2,500 | $1.89 | 43d | 1 | 1.27mi |
| 961 W Toltec Dr Coolidge, AZ | 4.0 | 2.0 | 1467 | $1,495 | $1.02 | 24d | 1 | 1.33mi |
| 1759 W Wilson Ave Coolidge, AZ | 3.0 | 2.0 | 1268 | $1,200 | $0.95 | 24d | 1 | 1.45mi |
| 1330 W Hess Ave Coolidge, AZ | 4.0 | 2.0 | 1787 | $1,795 | $1.00 | 43d | 1 | 1.47mi |
Listing history 7 events
-
2026-05-18status Pending 555-char remark
-
2026-05-01$99,000 Active 555-char remark
-
2024-10-31historical
-
2024-10-17status Active
-
2024-10-12historical Under Contract Accepting Backups
-
2024-09-30$149,000 Active
-
2024-08-01soldstatus $60,000
ⓘ Source: listings_history table (triggers on properties + properties_extension) + one-shot
backfill from property_details.listing_events for pre-trigger history.
Tax reassessment forecast AZ · Resets to sale price
- Current annual tax
- $458 · $38/mo
- Projected year-2 tax
- $653 · $54/mo
- Expected delta
- +$195/yr (+$16/mo · 42.6%)
ⓘ Screening estimate from a state-policy table — verify with the county assessor before closing.
Climate risk First Street
- Flood 1/10 Low FEMA zone X (unshaded) · 0% chance over 30 yrs
- Wildfire 6/10 Major
- Heat 9/10 Extreme 7 d/yr ≥113°F today · 19 d/yr by 30 yrs out
- Wind 1/10 Low
- Air quality 1/10 Low 0 unhealthy d/yr today · 0 by 30 yrs out
Nearby sold comps map
Loading sold comps map…
Walkable amenities ~0.75 mi
Loading nearby amenities…
Taxation est. · year 1
- Rental income
- $19,773
- − Mortgage interest
- −$5,546
- − Property taxes
- −$458
- − Insurance
- −$495
- − Repairs & maintenance
- −$1,582
- − Management
- −$1,582
- − Depreciation
- −$2,880
- Taxable income
- $7,230
- Est. tax owed @ 24.0%
- −$1,735
- After-tax cash flow
- $6,702/yr
For passive investors: Depreciation is non-cash, so a rental often shows a tax loss while cash-flowing — sheltering income. Rental losses are passive: they offset passive income freely, and up to $25,000/yr can offset ordinary (W-2) income if you actively participate and your MAGI is under $100k (phasing out to $0 by $150k); unused losses carry forward. On sale, claimed depreciation is recaptured at up to 25%, and gains may owe capital-gains tax (a 1031 exchange can defer both). Figures are a year-1 estimate at your 24.0% rate — not tax advice; consult a CPA.
Schools (NCES district)
- District
- Coolidge Unified District (4442)
- NCES district ID
- 0402320
- Math proficiency
- 8% ▼ -6.00%
- Reading proficiency
- 14% ▼ -2.00%
- Median HH income
- $49,182
- Composite
- 10.35/100
- National rank
- #9787
- State rank
- #229 of 249 in AZ
Livability — Coolidge
- Score
- 57/100
- State rank
- #235
- US rank
- #22344
Category grades
Schools grade is shown separately in the Schools card above.
Census & demographics
- Census place
- Coolidge, AZ
- County
- Pinal County · 399,947 people
- City population
- 19,487
- Metro
- Phoenix-Mesa-Chandler, AZ
- Population (ZIP)
- 19,487
- Household income
- $65,477
- Rent vs Own
- Severe rent burden
- 264.0
Population outlook (Pinal County) Hauer SSP2
- Today (2025)
- 437,574 people
- By 2030
- 446,903 · +2.1%
- By 2040
- 452,589 · +3.4%
- By 2050
- 444,126 · +1.5%
- By 2075
- 430,300 · -1.7%
- By 2100
- 393,536 · -10.1%
Race, ethnicity, and origin ACS 2023
- Neighborhood character
- Diverse neighborhood (Simpson 0.64)
- Race & ethnicity
- Hispanic / Latino 52% White 29% Two or more races 22% Native American 17% Black 4%
- Hispanic origin (detail)
- Mexican 49%
- Common ancestry
- Lithuanian 1% Portuguese 1% Serbian 1%
- Foreign-born
- 9% · Canada
- Languages at home
- 71% English-only · Spanish 25% Other Indo-European 1%
Political lean MEDSL · Pinal
- 2024 margin
- Strong R (+22.1) · D 38.5% · R 60.6%
- 2008→2024 swing
- -7.6pp toward R · 2008: -14.5pp · 2024: -22.1pp
- All cycles
- 2024: R+22.1 2020: R+17.3 2016: R+19.3 2012: R+17.1 2008: R+14.5
Not yet ingested
- Civics
- —
Market trends
- HPI YoY
- ▼ -23.95%
- Current HPI
- 280.3422
- Rent YoY
- ▲ 0.97%
- Metro
- Phoenix-Mesa-Chandler, AZ
- State GDP YoY
- ▲ 4.54%
- F500 in state
- 20
Industry mix (Fortune 500 HQ in AZ)
| Industry | F500 HQs | Revenue |
|---|---|---|
| Technology | 2 | $13B |
|
||
| Mining / Metals | 1 | $23B |
|
||
| Environmental Services | 1 | $16B |
|
||
| Metals / Steel | 1 | $14B |
|
||
| Technology Distribution | 1 | $9B |
|
||
| Homebuilding | 1 | $8B |
|
||
Price history
+33.3% since first listed9 events — show timeline
- 2026-06-05 Sold (Public Records) $80,000 Public Records
- 2026-06-03 Sold (MLS) $80,000 ARMLS
- 2026-05-18 Pending — ARMLS
- 2026-05-01 Listed $99,000 ARMLS
- 2024-10-31 Listing Removed — ARMLS
- 2024-10-17 Relisted — ARMLS
- 2024-10-12 Contingent — ARMLS
- 2024-09-30 Listed $149,000 ARMLS
- 2024-08-01 Sold (Public Records) $60,000 Public Records
Property tax history
+0.1%/yrLatest (2025): $458 · +4.8% YoY. Source: county tax records.
Cash-flow waterfall
monthlySold comps — $/sqft
last 12 mo · ≤1 miLoading sold comps…