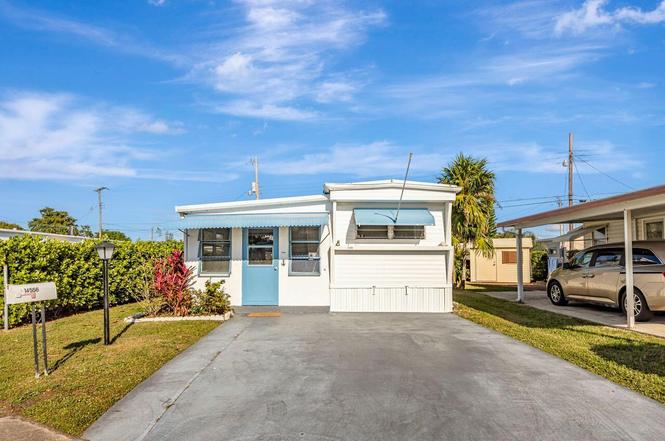
14556 Glenview Dr · Delray Beach, FL
Flood risk 1/10 · Minimal
- FEMA flood zone
- X (unshaded)
- Chance of flooding over 30 yrs
- 0.0%
- Est. flood insurance / yr
- $507 – $1,088
Fire risk 1/10 · Minimal
- Est. fire insurance / yr
- $947 – $1,759
Heat risk 9/10 · Severe
- Hot days now (above 106°F)
- 7 days/yr
- Hot days in 30 yrs
- 26 days/yr
Wind risk 10/10 · Severe
- Chance of severe wind over 30 yrs
- 99.0%
Air-quality risk 2/10 · Minimal
- Unhealthy air days now
- 1 days/yr
- Unhealthy air days in 30 yrs
- 2 days/yr
Risk factors via First Street. Map © Google.
Why this score? — see what drove the B grade
The composite is a weighted blend of 9 inputs, each scored 0–100. Each bar is that input's sub-score; the figure is the points it added to the 100-point composite (weight × sub-score).
- Cash flow +30.0/30.0
- 1% rule +10.0/10.0
- DSCR +10.0/10.0
- ARV discount +7.5/15.0
- Schools +4.3/10.0
- Livability +3.9/5.0
- Rent growth +3.0/5.0
- Condition / age +2.5/5.0
- Appreciation +0.0/10.0
$124,900
🖨 Deal sheet 📄 Offer letter ✓ Due diligence
Listing remarks
Make this charming 2-bedroom home your own and start enjoying the best of South Florida living! It has updated flooring and a newer air conditioner. It comes fully furnished with everything you need; just bring your personal touches and settle right in. Enjoy the oversized sunroom. Outside, you'll find a storage shed and patio. You own the land - keeping association fees extremely low! This welcoming community offers a pool, shuffleboard, and clubhouse. It's a lively, social neighborhood with regular activities. Located in the heart of Delray Beach, this home offers unbeatable convenience. You're just minutes from I-95, the beach and vibrant downtown. Whether you're looking for a seasonal g
Key facts
- 3,200 sq ft lot
- Community pool
- Built 1963
Property features AI
Finance
- HOA & community: Community association with monthly fee of $100; Community amenities include clubhouse, pool, and shuffleboard court; Senior community; Pets allowed (possible restrictions and number limits)
Exterior
- Utilities: Public water; Public sewer; Three-phase electric; Cable available; Water available; Sewer available
- Home design: Manufactured home; Single-story; Faces west
- Construction: Metal siding; Resale condition; Built as a manufactured home
- Exterior features: Not waterfront; No waterfront features listed
Interior
- Kitchen: Dishwasher; Electric range; Refrigerator; Electric water heater
- Bedrooms: 2 bedrooms on the main level
- Flooring: Laminate flooring
- Bathrooms: 1 full bathroom
- Heating & cooling: Central heating; Central air conditioning; Ceiling fan(s)
- Interior features: Partially furnished; No additional interior features listed
Neighborhood map
What this means for you Summary
Snapshot
- This is a 1-bed/1.0-bath land listed at $125k.
Deal economics
- At list price, monthly cash flow is $668 ($8k/yr) — positive.
- The deal already cash-flows at list — no discount required.
- Meets the 1% rule at list price ($2k rent vs $125k).
- Recommended offer: $114k (9.0% below list) — sets the bar for market timing.
- Cap rate 12.7% vs local median 4.3% in Delray Beach — top-decile yield for the area; either an underpriced asset or a hidden risk that comps aren't pricing in. Stress-test before assuming the spread holds.
Location & tenants
- Location reads 77/100 on livability (#202 in FL, #3,160 nationally) — a middle-class / working-renter tenant base. Strengths: housing A+, health & safety A+, commute A-; Watch: cost of living C-, crime D-, amenities F.
- Palm Beach (suburban): math 46% / reading 53% proficiency, ranked #34 of 73 in FL (top 47%) — families likely to look elsewhere, expect single-tenant / working-renter base with shorter leases.
- Zoned schools: Banyan Creek Elementary School (math 62% / reading 64%, grade B, #582 of 2,144 statewide, top 28%, 844 students, 51% FRL); Atlantic High School (math 28% / reading 52%, grade F, #296 of 667 statewide, top 45%, 1,889 students, 59% FRL) — zoned schools at 55% FRL track the district average.
- Market conditions: Rents rising (+1.8%/yr); 354 active listings in the ZIP; 40 comparable units currently listed for rent nearby; rentals at typical pace (median 24d on market — plan ~3-4 weeks tenant-placement turnaround); solid renter incomes; 3,974 units permitted in Palm Beach County in 2024 (1,012 in 5+ unit buildings).
- This rent runs 32% of the median local income ($78k/yr) — at the standard rent-burdened threshold; future hikes will face affordability resistance.
Forward outlook
- Local home prices are declining (-3.0%/yr); year-one equity from $864 of loan paydown is wiped out by about $4k of value loss. Plan a longer hold.
- Palm Beach County population projected at +30% by 2050 — long-run rental-demand tailwind backs the buy-and-hold thesis.
- At projected returns (-3.0% appreciation + 1.8% rent growth), your $35k cash investment doubles in ~6 years — after that, you're playing with house money.
Negotiation context
- It's been on market 106 days — a 9% lower offer ($114k) is reasonable based on typical stale-listing flexibility.
- 4 sale attempts since 3y ago with the ask held roughly flat each time — persistent listings suggest the price (not the market) is what's stuck; bring a comps-based counter.
Risks & watch-outs
- Climate carrying-cost: severe wind risk, 99% chance of damaging wind over 30y; extreme-heat days projected 7→26/yr by 2055 (HVAC capex compounding) — expect insurance premiums to compound above CPI over the hold.
Questions for the listing agent
- It's been on market 106 days. Have you received any prior offers? Is the seller open to a 9% concession, seller financing, or rate buy-down credit?
- Built in 1963 — when were the roof, HVAC, electrical panel, plumbing, and water heater last replaced?
- What does the HOA fee cover, when was the last increase, and are there any pending special assessments or reserve-fund shortfalls?
- Why hasn't it sold? Are there any deal-killer items the seller is aware of (foundation, flood, title, zoning, code violations)?
- Is there a deadline driving the sale (1031 exchange, divorce, estate, relocation)? That informs how much negotiation room exists.
- Schools are B-rated — typically a magnet for longer-tenancy family renters. What's the average tenant stay here, and is there a school-zone premium baked into asking?
- Crime grade is D in this area — have there been break-ins, vandalism, or insurance claims at this property in the last 3 years? What carrier currently insures it and at what premium?
- What's the average days-on-market for RENTAL listings here right now (not sales)? A rising rental-DOM trend means longer vacancies and softer asking-rent achievability than the comps imply.
- What's the recent tenant-quality profile in this submarket — average credit score on applications, eviction rate, late-payment / NSF rate, and stable-employment percentage? A property-management company in the area should have these aggregated.
- How much new for-sale + rental construction is in the pipeline within 1–3 miles? Heavy new supply typically softens prices + rents 12–24 months out; constrained supply supports both.
Investment metrics
- 1% rule
- 1.69% ✓
- Cap rate
- 12.71%
- Cash-on-cash
- 22.93%
- DSCR
- 2.02
- GRM
- 4.9
CMA / ARV
No comps found within radius.
Projected returns pro-forma
-3.0% appreciation · 1.83% rent growth · sell at horizon
- IRR
- 14.5%
- Equity multiple
- 1.57×
- Total profit
- $19,974
- Equity at exit
- $18,623
- IRR
- 22.3%
- Equity multiple
- 2.80×
- Total profit
- $62,808
- Equity at exit
- $10,799
Cash invested: $34,972 (down + closing). Projections, not guarantees.
Landlord ↔ Tenant lean methodology
- Overall (STATE)
- 87 Strongly Landlord-Friendly
- State Florida
- 87 Strongly Landlord-Friendly · R+3
- County
- — inherits STATE
- City
- — inherits STATE
ZIP-level market 33445
- Rents YoY
- 1.8%
- Active inventory
- 354
- Price-to-rent
- 4.9×
Monthly cashflow live
- Estimated rent
- $2,113 high interval (Pro) →
- Mortgage (P&I)
- −$655
- Tax from tax record
- −$194 /mo · $2,328/yr
- Insurance
- −$52
- HOA
- −$100
- Vacancy / Maint / Mgmt
- −$444
- Net cashflow
- $668
Break-even live
UW: 25.0% down · 7.5% · 30yr · 1.5% tax · 5.0% vac · 8.0% maint · 8.0% mgmt
Financing live
Cash to close
- Down payment
- $31,225
- Closing costs
- $3,747
- Reserves months
- —
- Total cash needed
- —
Loan-product check · same deal, 3 products live
Conventional
25% down · 7.5% · 30yr
- Down + closing
- —
- Monthly P&I
- —
- Monthly cashflow
- —
- DSCR
- —
- Eligible?
- —
Personal DTI + credit; lowest rate.
DSCR
20% down · 8.5% · 30yr
- Down + closing
- —
- Monthly P&I
- —
- Monthly cashflow
- —
- DSCR
- —
- Eligible?
- —
No personal income docs; deal must DSCR.
Hard money
10% down · 12.0% · 12mo
- Down + closing
- —
- Monthly P&I
- —
- Monthly cashflow
- —
- DSCR
- —
- Eligible?
- —
Short-term bridge; refi at stabilization.
Rent comps 40 comps
| Address | Beds | Baths | Sqft | Rent | $/sqft | DOM | Units | Dist |
|---|---|---|---|---|---|---|---|---|
| 125 Via D Este Delray Beach, FL | 1.0–3.0 | 1.0–2.0 | 1156 | $2,450 | $2.12 | 1d | 13 | 0.36mi |
| 4510 NW 2nd St Unit A Delray Beach, FL | 2.0 | 2.0 | 1080 | $1,800 | $1.67 | 24d | 1 | 0.46mi |
| 4515 NW 3rd Ct Unit C Delray Beach, FL | 1.0 | 2.0 | 1080 | $1,900 | $1.76 | 24d | 1 | 0.51mi |
| 14401 S Military Trl Delray Beach, FL | 2.0–3.0 | 1.0–2.0 | 1094 | $2,384 | $2.18 | 2d | 8 | 0.52mi |
| 1155 South Drive Cir Unit A Delray Beach, FL | 2.0 | 2.0 | 1080 | $2,195 | $2.03 | 24d | 1 | 0.52mi |
| 1142 Circle Ter W Unit C Delray Beach, FL | 1.0 | 1.5 | 1080 | $1,700 | $1.57 | 3d | 1 | 0.54mi |
| 212 High Point Ter W Unit C Delray Beach, FL | 1.0 | 1.5 | 1122 | $2,000 | $1.78 | 22d | 1 | 0.60mi |
| 4477 NW 3rd Dr Delray Beach, FL | 2.0 | 1.5 | 1109 | $2,550 | $2.30 | 24d | 1 | 0.61mi |
| 5265 NW 3rd St Unit C Delray Beach, FL | 1.0 | 1.5 | 1080 | $2,200 | $2.04 | 24d | 1 | 0.61mi |
| 14629 Canalview Dr Unit C Delray Beach, FL | 1.0 | 2.0 | 1068 | $1,600 | $1.50 | 24d | 1 | 0.69mi |
| 14676 Canalview Dr Unit C Delray Beach, FL | 1.0 | 2.0 | 1068 | $1,775 | $1.66 | 24d | 1 | 0.69mi |
| 405 High Point Blvd Unit C Delray Beach, FL | 1.0 | 1.5 | 994 | $1,500 | $1.51 | 24d | 1 | 0.71mi |
| 512 High Point Dr Unit C Delray Beach, FL | 1.0 | 2.0 | 994 | $2,100 | $2.11 | 19d | 1 | 0.74mi |
| 707 High Point Blvd N Unit C Delray Beach, FL | 1.0 | 1.5 | 994 | $1,600 | $1.61 | 24d | 1 | 0.79mi |
| 14484 Canalview Dr Unit C Delray Beach, FL | 1.0 | 2.0 | 1068 | $1,700 | $1.59 | 24d | 1 | 0.84mi |
| 2755 W Atlantic Ave Unit A101 Delray Beach, FL | 1.0 | 1.0 | 672 | $1,800 | $2.68 | 3d | 1 | 0.85mi |
| 14040 Nesting Way Unit B Delray Beach, FL | 1.0 | 2.0 | 1092 | $1,700 | $1.56 | 24d | 1 | 0.98mi |
| 5349 Lakefront Blvd Unit B Delray Beach, FL | 1.0 | 2.0 | 1068 | $1,800 | $1.69 | 24d | 1 | 0.99mi |
| 13990 Nesting Way Unit C Delray Beach, FL | 1.0 | 2.0 | 1092 | $2,300 | $2.11 | 24d | 1 | 1.00mi |
| 829 Camino Rd Unit 206C Delray Beach, FL | 2.0 | 2.0 | 1023 | $2,400 | $2.35 | 24d | 1 | 1.04mi |
| 829 Camino Rd Delray Beach, FL | 2.0 | 2.0 | 1023 | $2,262 | $2.21 | 24d | 2 | 1.04mi |
| 2828 Casita Way #1020 Delray Beach, FL | 2.0 | 2.0 | 1023 | $2,000 | $1.96 | 20d | 1 | 1.07mi |
| 2828 Casita Way #214 Delray Beach, FL | 2.0 | 2.0 | 1023 | $2,300 | $2.25 | 15d | 1 | 1.08mi |
| 2828 Casita Way Delray Beach, FL | 2.0 | 2.0 | 1023 | $2,248 | $2.20 | 24d | 2 | 1.08mi |
| 13487 Barwick Rd Unit B Delray Beach, FL | 2.0 | 1.5 | 1092 | $3,900 | $3.57 | 24d | 1 | 1.09mi |
| 2900 Fiore Way #2110 Delray Beach, FL | 2.0 | 2.0 | 1023 | $2,385 | $2.33 | 4d | 1 | 1.10mi |
| 5550 Nepsa Way Delray Beach, FL | 1.0–3.0 | 1.0–2.0 | 1035 | $2,164 | $2.09 | 1d | 12 | 1.15mi |
| 2700 Fiore Way #2020 Delray Beach, FL | 2.0 | 2.0 | 1023 | $2,500 | $2.44 | 5d | 1 | 1.17mi |
| 2600 Fiore Way #2140 Delray Beach, FL | 2.0 | 2.0 | 1023 | $2,175 | $2.13 | 3d | 1 | 1.18mi |
| 2500 Fiore Way #109 Delray Beach, FL | 1.0 | 1.5 | 825 | $2,150 | $2.61 | 11d | 1 | 1.21mi |
| 2500 Fiore Way #1110 Delray Beach, FL | 2.0 | 2.0 | 1023 | $1,850 | $1.81 | 24d | 1 | 1.22mi |
| 13682 Via Flora Unit H Delray Beach, FL | 2.0 | 2.0 | 1097 | $1,900 | $1.73 | 24d | 1 | 1.23mi |
| 2500 Fiore Way Delray Beach, FL | 1.0–2.0 | 1.5–2.0 | 874 | $1,900 | $2.17 | 17d | 2 | 1.23mi |
| 4809 N Wickham Cir Unit A Delray Beach, FL | 2.0 | 2.0 | 1028 | $2,600 | $2.53 | 24d | 1 | 1.25mi |
| 5600 Atlantic Ave Delray Beach, FL | 1.0–3.0 | 1.0–3.0 | 1147 | $2,062 | $1.80 | 1d | 29 | 1.25mi |
| 14050 Pacific Point Pl Delray Beach, FL | 1.0–3.0 | 1.0–2.0 | 1033 | $2,336 | $2.26 | 2d | 22 | 1.28mi |
| 5299 Copperleaf Cir Delray Beach, FL | 2.0 | 2.0 | 1070 | $2,000 | $1.87 | 24d | 1 | 1.29mi |
| 250 Congress Park Dr Delray Beach, FL | 1.0–2.0 | 1.0–2.0 | 972 | $2,180 | $2.24 | 3d | 6 | 1.31mi |
| 5130 Las Verdes Cir #101 Delray Beach, FL | 2.0 | 2.0 | 1030 | $1,825 | $1.77 | 24d | 1 | 1.33mi |
| 2715 Ponce de Leon Blvd Delray Beach, FL | 2.0 | 1.0 | 1000 | $2,200 | $2.20 | 24d | 1 | 1.33mi |
HOA detail
- Monthly dues
- $100 · $1,200/yr
- Likely covers
- pool
Listing history 30 events
-
2026-06-18days on market $124,900 Active 106 DOM
-
2026-06-17days on market $124,900 Active 105 DOM
-
2026-06-16days on market $124,900 Active 104 DOM
-
2026-06-15days on market $124,900 Active 103 DOM
-
2026-06-13days on market $124,900 Active 101 DOM
-
2026-06-09days on market $124,900 Active 97 DOM
-
2026-06-08days on market $124,900 Active 96 DOM
-
2026-06-07days on market $124,900 Active 95 DOM
-
2026-06-04days on market $124,900 Active 92 DOM
-
2026-06-03days on market $124,900 Active 91 DOM
-
2026-06-02days on market $124,900 Active 90 DOM
-
2026-06-01days on market $124,900 Active 89 DOM
-
2026-05-31days on market $124,900 Active 88 DOM
-
2026-03-04$124,900 Active
-
2026-03-03historical $124,900
-
2025-09-26historical
-
2025-07-16$124,900 Active
-
2025-07-15historical
-
2025-06-16historical
-
2025-04-15price $124,900
-
2025-02-27price $129,900
-
2025-01-31price $134,900
-
2025-01-09$139,900 Active
-
2023-07-10soldstatus $110,000
-
2023-06-30soldstatus $110,000 Closed
-
2023-06-14status Pending
-
2023-06-14$110,000 Active
-
2023-06-09historical $110,000
-
1998-03-12soldstatus $29,000
-
1992-02-28soldstatus $17,000
ⓘ Source: listings_history table (triggers on properties + properties_extension) + one-shot
backfill from property_details.listing_events for pre-trigger history.
Tax reassessment forecast FL · Resets to sale price
- Current annual tax
- $2,328 · $194/mo
- Projected year-2 tax
- $2,328 · $194/mo
- Expected delta
- $0/yr ($0/mo · 0.0%)
ⓘ Screening estimate from a state-policy table — verify with the county assessor before closing.
Climate risk First Street
- Flood 1/10 Low FEMA zone X (unshaded) · 0% chance over 30 yrs
- Wildfire 1/10 Low
- Heat 9/10 Extreme 7 d/yr ≥106°F today · 26 d/yr by 30 yrs out
- Wind 10/10 Extreme 99% chance of damaging wind over 30 yrs
- Air quality 2/10 Low 1 unhealthy d/yr today · 2 by 30 yrs out
Nearby sold comps map
Loading sold comps map…
Walkable amenities ~0.75 mi
Loading nearby amenities…
Taxation est. · year 1
- Rental income
- $25,355
- − Mortgage interest
- −$6,996
- − Property taxes
- −$2,328
- − Insurance
- −$624
- − Repairs & maintenance
- −$2,028
- − Management
- −$2,028
- − HOA
- −$1,200
- − Depreciation
- −$3,633
- Taxable income
- $6,516
- Est. tax owed @ 24.0%
- −$1,564
- After-tax cash flow
- $6,454/yr
For passive investors: Depreciation is non-cash, so a rental often shows a tax loss while cash-flowing — sheltering income. Rental losses are passive: they offset passive income freely, and up to $25,000/yr can offset ordinary (W-2) income if you actively participate and your MAGI is under $100k (phasing out to $0 by $150k); unused losses carry forward. On sale, claimed depreciation is recaptured at up to 25%, and gains may owe capital-gains tax (a 1031 exchange can defer both). Figures are a year-1 estimate at your 24.0% rate — not tax advice; consult a CPA.
Schools (NCES district)
- District
- Palm Beach
- NCES district ID
- 1201500
- Math proficiency
- 46% ▼ -16.00%
- Reading proficiency
- 53% ▼ -4.00%
- Median HH income
- $53,943
- Composite
- 42.72/100
- National rank
- #3160
- State rank
- #34 of 73 in FL
Livability — Delray Beach
- Score
- 77/100
- State rank
- #202
- US rank
- #3160
Category grades
Schools grade is shown separately in the Schools card above.
Census & demographics
- Census place
- Delray Beach, FL
- County
- Palm Beach County · 1,438,312 people
- City population
- 123,167
- Metro
- Miami-Fort Lauderdale-Pompano Beach, FL
- Population (ZIP)
- 33,122
- Household income
- $78,163
- Rent vs Own
- Severe rent burden
- 1649.0
Population outlook (Palm Beach County) Hauer SSP2
- Today (2025)
- 1,637,487 people
- By 2030
- 1,743,255 · +6.5%
- By 2040
- 1,948,712 · +19.0%
- By 2050
- 2,132,979 · +30.3%
- By 2075
- 2,530,027 · +54.5%
- By 2100
- 2,706,979 · +65.3%
Race, ethnicity, and origin ACS 2023
- Neighborhood character
- Diverse neighborhood (Simpson 0.62)
- Race & ethnicity
- White 55% Black 24% Hispanic / Latino 11% Two or more races 11% Asian 4%
- Hispanic origin (detail)
- Puerto Rican 3% Cuban 2%
- Common ancestry
- Hispanic 14% Romanian 3% Scotch-Irish 3%
- Foreign-born
- 27% · Canada, Jamaica, Dominican Republic
- Languages at home
- 66% English-only · French/Haitian/Cajun 18% Spanish 9% Other Indo-European 4%
Political lean MEDSL · Palm Beach
- 2024 margin
- Toss-up / Even · D 50.0% · R 49.2%
- 2008→2024 swing
- -22.1pp toward R · 2008: 22.9pp · 2024: 0.8pp
- All cycles
- 2024: D+0.8 2020: D+12.8 2016: D+15.3 2012: D+17.0 2008: D+22.9
Not yet ingested
- Civics
- —
Market trends
- HPI YoY
- ▼ -258.16%
- Current HPI
- 349.5505
- Rent YoY
- ▲ 1.83%
- Metro
- Miami-Fort Lauderdale-Pompano Beach, FL
- State GDP YoY
- ▲ 3.28%
- F500 in state
- 36
Industry mix (Fortune 500 HQ in FL)
| Industry | F500 HQs | Revenue |
|---|---|---|
| Industrial Technology | 2 | $29B |
|
||
| Insurance | 2 | $17B |
|
||
| Retail | 1 | $60B |
|
||
| Technology Distribution | 1 | $58B |
|
||
| Homebuilding | 1 | $35B |
|
||
| Technology Manufacturing | 1 | $35B |
|
||
Price history
+634.7% since first listed17 events — show timeline
- 2026-03-04 Listed $124,900 Beaches MLS
- 2026-03-03 Coming Soon $124,900 Beaches MLS
- 2025-09-26 Listing Removed — Beaches MLS
- 2025-07-16 Listed $124,900 Beaches MLS
- 2025-07-15 Coming Soon — Beaches MLS
- 2025-06-16 Listing Removed — Beaches MLS
- 2025-04-15 Price Changed $124,900 Beaches MLS
- 2025-02-27 Price Changed $129,900 Beaches MLS
- 2025-01-31 Price Changed $134,900 Beaches MLS
- 2025-01-09 Listed $139,900 Beaches MLS
- 2023-07-10 Sold (Public Records) $110,000 Public Records
- 2023-06-30 Sold (MLS) $110,000 Beaches MLS
- 2023-06-14 Pending — Beaches MLS
- 2023-06-14 Listed $110,000 Beaches MLS
- 2023-06-09 Coming Soon $110,000 Beaches MLS
- 1998-03-12 Sold (Public Records) $29,000 Public Records
- 1992-02-28 Sold (Public Records) $17,000 Public Records
Property tax history
+6.8%/yrLatest (2025): $2,328 · +14.7% YoY. Source: county tax records.
Cash-flow waterfall
monthlySold comps — $/sqft
last 12 mo · ≤1 miLoading sold comps…