 Multi-family
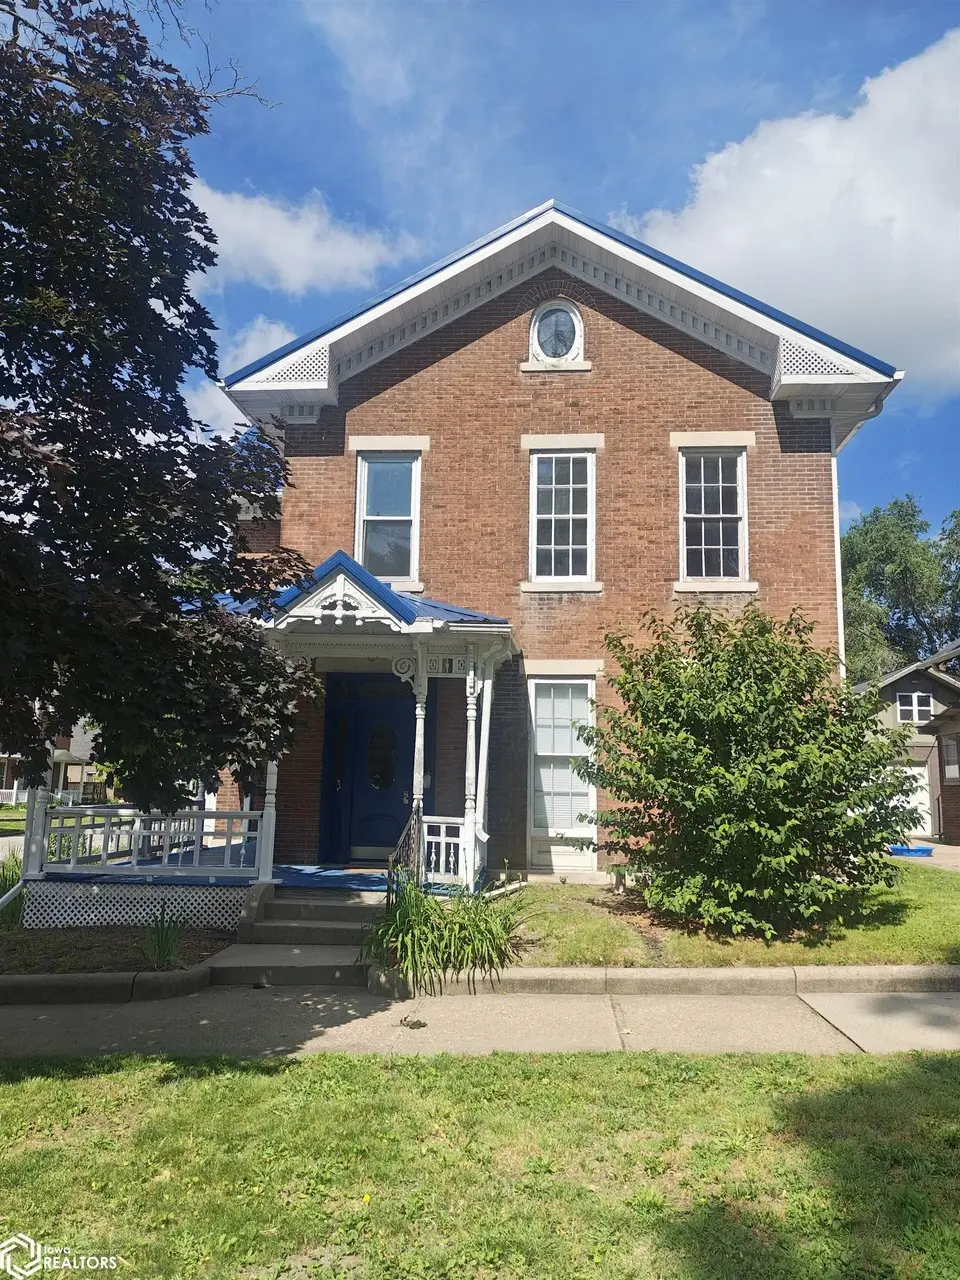
521 10th Street St · Fort Madison, IA
Flood risk 1/10 · Minimal
- FEMA flood zone
- X (unshaded)
- Chance of flooding over 30 yrs
- 0.0%
- Est. flood insurance / yr
- $473 – $860
Fire risk 3/10 · Minor
- Est. fire insurance / yr
- $902 – $1,676
Heat risk 4/10 · Minor
- Hot days now (above 107°F)
- 7 days/yr
- Hot days in 30 yrs
- 16 days/yr
Wind risk 2/10 · Minimal
- Chance of severe wind over 30 yrs
- —
Air-quality risk 2/10 · Minimal
- Unhealthy air days now
- 0 days/yr
- Unhealthy air days in 30 yrs
- 1 days/yr
Risk factors via First Street. Map © Google.
Why this score? — see what drove the B grade
The composite is a weighted blend of 9 inputs, each scored 0–100. Each bar is that input's sub-score; the figure is the points it added to the 100-point composite (weight × sub-score).
- Cash flow +30.0/30.0
- DSCR +10.0/10.0
- 1% rule +9.7/10.0
- ARV discount +7.5/15.0
- Schools +4.8/10.0
- Livability +3.8/5.0
- Rent growth +2.5/5.0
- Condition / age +2.5/5.0
- Appreciation +0.0/10.0
$164,900
🖨 Deal sheet 📄 Offer letter ✓ Due diligence
Multi-family units
County records classify this as Multi-Family (2-4 Unit). Listing-text estimate: 1 unit. estimate disagrees with records
Listing remarks
Timeless Victorian Elegance Meets Modern Luxury Historic Charm Across from Central Park. Step into a seamless blend of historic grandeur and high-end modern living. This meticulously updated Brick Victorian offers soaring ceilings, rich natural woodwork, and newly refinished hardwood floors. Located just steps from downtown, it pairs convenience with classic architectural beauty. Property Highlights are Amish Kitchen: Custom-crafted, premium cabinetry tailored specifically for this space. Updated Main Bath: renovated featuring exquisite imported tile work. The entire interior boasts a crisp, professional new paint palette. Income or Guest Potential: Second-floor kitchenette with a private p
Key facts
- Updated main bath
- 5,663 sq ft lot
- Built 1870
Tags
Property features AI
Exterior
- Parking: On-street parking
- Utilities: Public water; Public sewer
- Home design: Two-story single-family residence; Brick construction
- Construction: Brick exterior
- Exterior features: Lot approximately 57 x 100 ft (0.13 acre)
Interior
- Bathrooms: One full bathroom; One three-quarter bathroom
- Heating & cooling: Hot water heating; Window air conditioning units
- Interior features: Basement present
Neighborhood map
What this means for you Summary
Snapshot
- This is a 3-bed/2.0-bath multifamily listed at $165k.
Deal economics
- At list price, monthly cash flow is $856 ($10k/yr) — positive.
- The deal already cash-flows at list — no discount required.
- Meets the 1% rule at list price ($2k rent vs $165k).
- Cap rate 12.5% vs local median 5.3% in Fort Madison — top-decile yield for the area; either an underpriced asset or a hidden risk that comps aren't pricing in. Stress-test before assuming the spread holds.
Location & tenants
- Location reads 75/100 on livability (#230 in IA, #4,353 nationally) — a middle-class / working-renter tenant base. Strengths: cost of living A+, housing A+, health & safety A+; Watch: commute F, employment D-.
- Fort Madison Community School District (town): math 55% / reading 58% proficiency, ranked #260 of 289 in IA (top 90%) — acceptable for families but not a draw, mixed tenant base, ~2y average lease.
- Market conditions: 64 active listings in the ZIP; 15 units permitted in Lee County in 2024 (0 in 5+ unit buildings).
Forward outlook
- Local home prices are declining (-3.0%/yr); year-one equity from $1k of loan paydown is wiped out by about $5k of value loss. Plan a longer hold.
- Lee County population projected at -15% by 2050 — secular population decline; favor cash flow + early exit over multi-decade hold.
- At projected returns (-3.0% appreciation + 3.0% rent growth), your $46k cash investment doubles in ~6 years — after that, you're playing with house money.
Negotiation context
- Only 13 days on market — expect competitive offers; lowballing is unlikely to land.
- Current owner paid $40k; list at $165k implies a 312% gain — meaningful room to come down on a strong offer.
Risks & watch-outs
- Watch-outs: built in 1870 — expect roof / HVAC / electrical / plumbing capex.
Questions for the listing agent
- Built in 1870 — when were the roof, HVAC, electrical panel, plumbing, and water heater last replaced?
- Is there a deadline driving the sale (1031 exchange, divorce, estate, relocation)? That informs how much negotiation room exists.
- Schools are B-rated — typically a magnet for longer-tenancy family renters. What's the average tenant stay here, and is there a school-zone premium baked into asking?
- What's the average days-on-market for RENTAL listings here right now (not sales)? A rising rental-DOM trend means longer vacancies and softer asking-rent achievability than the comps imply.
- What's the recent tenant-quality profile in this submarket — average credit score on applications, eviction rate, late-payment / NSF rate, and stable-employment percentage? A property-management company in the area should have these aggregated.
- How much new apartment / multifamily construction is in the pipeline within 1–3 miles? Heavy new supply (>2% of stock underway) typically softens rents 12–24 months out; light construction supports rent growth.
Investment metrics
- 1% rule
- 1.47% ✓
- Cap rate
- 12.52%
- Cash-on-cash
- 22.25%
- DSCR
- 1.99
- GRM
- 5.7
CMA / ARV
No comps found within radius.
Projected returns pro-forma
-3.0% appreciation · 3.0% rent growth · sell at horizon
- IRR
- 15.0%
- Equity multiple
- 1.60×
- Total profit
- $27,788
- Equity at exit
- $24,587
- IRR
- 23.7%
- Equity multiple
- 3.04×
- Total profit
- $94,342
- Equity at exit
- $14,258
Cash invested: $46,172 (down + closing). Projections, not guarantees.
Landlord ↔ Tenant lean methodology
- Overall (STATE)
- 83 Strongly Landlord-Friendly
- State Iowa
- 83 Strongly Landlord-Friendly · R+6
- County
- — inherits STATE
- City
- — inherits STATE
ZIP-level market 52627
- Home prices YoY
- -28.6%
- Active inventory
- 64
- Price-to-rent
- 11.4×
Monthly cashflow live
- Estimated rent
- $2,418 medium interval (Pro) →
- Mortgage (P&I)
- −$865
- Tax from tax record
- −$121 /mo · $1,448/yr
- Insurance
- −$69
- HOA
- −$0
- Vacancy / Maint / Mgmt
- −$508
- Net cashflow
- $856
Break-even live
2-unit breakdown (identical units grouped — click to expand)
| Units | Beds | Baths | Est. rent |
|---|---|---|---|
| 2× units | 3 | 1.5 | $2,418 |
| #1 | 3 | 1.5 | $1,209 |
| #2 | 3 | 1.5 | $1,209 |
| Total (2 units) | $2,418 | ||
UW: 25.0% down · 7.5% · 30yr · 1.5% tax · 5.0% vac · 8.0% maint · 8.0% mgmt
Financing live
Cash to close
- Down payment
- $41,225
- Closing costs
- $4,947
- Reserves months
- —
- Total cash needed
- —
Loan-product check · same deal, 3 products live
Conventional
25% down · 7.5% · 30yr
- Down + closing
- —
- Monthly P&I
- —
- Monthly cashflow
- —
- DSCR
- —
- Eligible?
- —
Personal DTI + credit; lowest rate.
DSCR
20% down · 8.5% · 30yr
- Down + closing
- —
- Monthly P&I
- —
- Monthly cashflow
- —
- DSCR
- —
- Eligible?
- —
No personal income docs; deal must DSCR.
Hard money
10% down · 12.0% · 12mo
- Down + closing
- —
- Monthly P&I
- —
- Monthly cashflow
- —
- DSCR
- —
- Eligible?
- —
Short-term bridge; refi at stabilization.
Listing history 11 events
-
2026-06-19days on market $164,900 Active 13 DOM
-
2026-06-18days on market $164,900 Active 12 DOM
-
2026-06-17days on market $164,900 Active 11 DOM
-
2026-06-16days on market $164,900 Active 10 DOM
-
2026-06-15days on market $164,900 Active 9 DOM
-
2026-06-14days on market $164,900 Active 7 DOM
-
2026-06-12days on market $164,900 Active 6 DOM
-
2026-06-09days on market $164,900 Active 3 DOM
-
2026-06-08days on market $164,900 Active 2 DOM
-
2026-06-07remarks 699-char remark
-
2026-06-07$164,900 Active 1 DOM
ⓘ Source: listings_history table (triggers on properties + properties_extension) + one-shot
backfill from property_details.listing_events for pre-trigger history.
Tax reassessment forecast IA · Partial reset (capped growth)
- Current annual tax
- $1,448 · $121/mo
- Projected year-2 tax
- $2,018 · $168/mo
- Expected delta
- +$570/yr (+$48/mo · 39.4%)
ⓘ Screening estimate from a state-policy table — verify with the county assessor before closing.
Climate risk First Street
- Flood 1/10 Low FEMA zone X (unshaded) · 0% chance over 30 yrs
- Wildfire 3/10 Moderate
- Heat 4/10 Moderate 7 d/yr ≥107°F today · 16 d/yr by 30 yrs out
- Wind 2/10 Low
- Air quality 2/10 Low 0 unhealthy d/yr today · 1 by 30 yrs out
Nearby sold comps map
Loading sold comps map…
Walkable amenities ~0.75 mi
Loading nearby amenities…
Taxation est. · year 1
- Rental income
- $29,016
- − Mortgage interest
- −$9,237
- − Property taxes
- −$1,448
- − Insurance
- −$824
- − Repairs & maintenance
- −$2,321
- − Management
- −$2,321
- − Depreciation
- −$4,797
- Taxable income
- $8,067
- Est. tax owed @ 24.0%
- −$1,936
- After-tax cash flow
- $8,337/yr
For passive investors: Depreciation is non-cash, so a rental often shows a tax loss while cash-flowing — sheltering income. Rental losses are passive: they offset passive income freely, and up to $25,000/yr can offset ordinary (W-2) income if you actively participate and your MAGI is under $100k (phasing out to $0 by $150k); unused losses carry forward. On sale, claimed depreciation is recaptured at up to 25%, and gains may owe capital-gains tax (a 1031 exchange can defer both). Figures are a year-1 estimate at your 24.0% rate — not tax advice; consult a CPA.
Schools (NCES district)
- District
- Fort Madison Community School District
- NCES district ID
- 1911850
- Math proficiency
- 55% ▼ -7.00%
- Reading proficiency
- 58% ▼ -2.00%
- Median HH income
- $46,801
- Composite
- 47.87/100
- National rank
- #2218
- State rank
- #260 of 289 in IA
Livability — Fort Madison
- Score
- 75/100
- State rank
- #230
- US rank
- #4353
Category grades
Schools grade is shown separately in the Schools card above.
Census & demographics
- Census place
- Fort Madison, IA
- Population (ZIP)
- 12,585
Population outlook (Lee County) Hauer SSP2
- Today (2025)
- 33,813 people
- By 2030
- 32,835 · -2.9%
- By 2040
- 30,690 · -9.2%
- By 2050
- 28,777 · -14.9%
- By 2075
- 25,568 · -24.4%
- By 2100
- 21,983 · -35.0%
Race, ethnicity, and origin ACS 2023
- Neighborhood character
- Predominantly White (88%)
- Race & ethnicity
- White 88% Two or more races 5% Hispanic / Latino 5% Black 4%
- Common ancestry
- Slovak 2% Portuguese 1% Italian 1%
- Foreign-born
- 1%
- Languages at home
- 98% English-only · Spanish 2%
Political lean MEDSL · Lee
- 2024 margin
- Strong R (+27.8) · D 35.0% · R 62.9% · Other 2.1%
- 2008→2024 swing
- -43.8pp toward R · 2008: 16.0pp · 2024: -27.8pp
- All cycles
- 2024: R+27.8 2020: R+19.3 2016: R+16.1 2012: D+16.0 2008: D+16.0
Not yet ingested
- Civics
- —
Market trends
- HPI YoY
- ▼ -70.32%
- Current HPI
- 175.7708
- Rent YoY
- —
- Metro
- —
- State GDP YoY
- ▲ 2.48%
- F500 in state
- 4
Industry mix (Fortune 500 HQ in IA)
| Industry | F500 HQs | Revenue |
|---|---|---|
| Financial Services | 1 | $16B |
|
||
| Retail / Convenience | 1 | $15B |
|
||
Price history
+312.2% since first listed2 events — show timeline
- 2026-06-05 Listed $164,900 IAR
- 2019-01-14 Sold (Public Records) $40,000 Public Records
Property tax history
+3.2%/yrLatest (2025): $1,448 · +18.7% YoY. Source: county tax records.
Cash-flow waterfall
monthlySold comps — $/sqft
last 12 mo · ≤1 miLoading sold comps…