16465 350th St NW · West Valley, MN
Flood risk 1/10 · Minimal
- FEMA flood zone
- X (unshaded)
- Chance of flooding over 30 yrs
- 0.0%
- Est. flood insurance / yr
- $473 – $860
Fire risk 7/10 · Major
- Est. fire insurance / yr
- $888 – $1,650
Heat risk 1/10 · Minimal
- Hot days now (above 95°F)
- 7 days/yr
- Hot days in 30 yrs
- 12 days/yr
Wind risk 1/10 · Minimal
- Chance of severe wind over 30 yrs
- —
Air-quality risk 3/10 · Minor
- Unhealthy air days now
- 2 days/yr
- Unhealthy air days in 30 yrs
- 2 days/yr
Risk factors via First Street. Map © Google.
Why this score? — see what drove the D grade
The composite is a weighted blend of 9 inputs, each scored 0–100. Each bar is that input's sub-score; the figure is the points it added to the 100-point composite (weight × sub-score).
- Cash flow +11.5/30.0
- ARV discount +7.5/15.0
- Appreciation +5.0/10.0
- Schools +3.9/10.0
- DSCR +3.4/10.0
- Rent growth +2.5/5.0
- Livability +2.5/5.0
- Condition / age +2.5/5.0
- 1% rule +2.4/10.0
$110,000
🖨 Deal sheet (PDF) 📄 Offer letter ✓ Due diligence
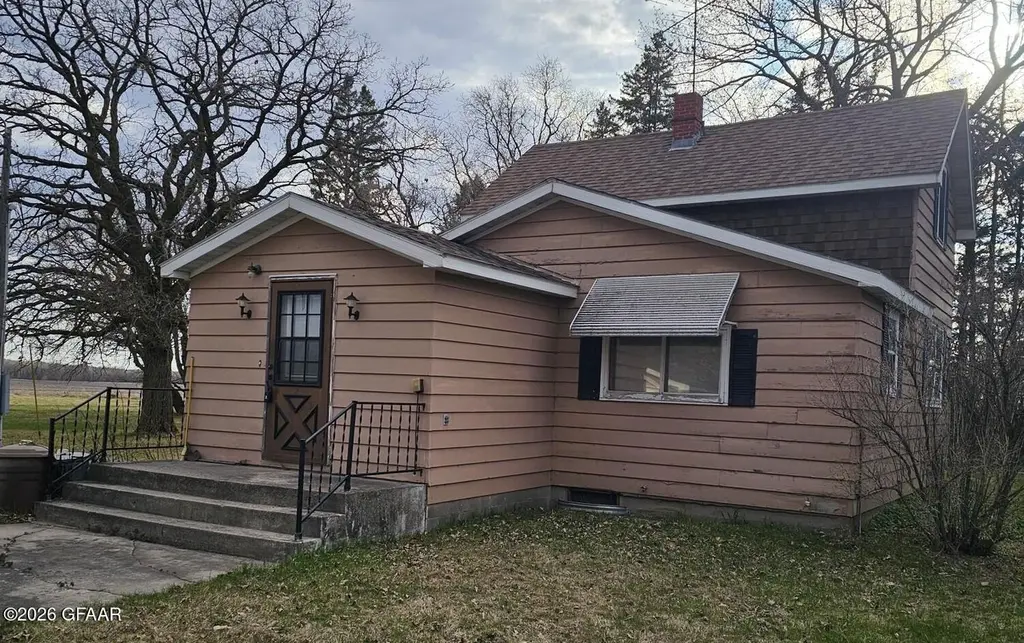
Listing remarks
Enjoy your own little slice of country living on this 8- acre farmhouse located just minutes from Newfolden, Featuring a spacious yard, barn, and detached garage this property offers plenty of space and potential for the right buyer. Home will require updates and repairs, making it a great opportunity for someone to make it their own.
Key facts
- 8 acre lot
- 2 garage spots
- Built 1930
Property features AI
Finance
- Financial info: Annual tax amount listed (not included per instructions)
Exterior
- Parking: Attached or detached 2-car garage
- Utilities: Public water
- Home design: Single-family residential property; Two levels
- Construction: Wood siding exterior
- Exterior features: Irregular-shaped lot; Lot area approximately 348,480 square feet
Interior
- Bedrooms: Bedrooms count not specified
- Bathrooms: One full bathroom
- Interior features: Six total rooms
Neighborhood map
What this means for you Summary
Snapshot
- This is a 2-bed/1.0-bath single-family listed at $110k.
Deal economics
- At list price, monthly cash flow is $-36 ($-431/yr) — negative.
- To cash-flow at today's rent, offer at most $104k (5.8% below list).
- To meet the 1% rule (rent ≥ 1% of price), the offer needs to be $81k (26.2% below list).
- Recommended offer: $81k (26.2% below list) — sets the bar for 1% rule.
Location & tenants
- Location reads: area grade D — affects rentability + tenant quality, not the cash-flow math above.
- Marshall County Central Schools (rural): math 41% / reading 49% proficiency, ranked #175 of 301 in MN (top 58%) — families likely to look elsewhere, expect single-tenant / working-renter base with shorter leases.
- Market conditions: 6 active listings in the ZIP; 9 units permitted in Marshall County in 2024 (0 in 5+ unit buildings).
Forward outlook
- In year one you build about $4k of equity ($761 loan paydown + $3k appreciation (3.0% local appreciation)).
- Marshall County population projected to shrink 8% by 2050 — rents likely to lag national; underwrite the cash flow, not the appreciation.
- At projected returns (3.0% appreciation + 3.0% rent growth), your $31k cash investment doubles in ~7 years — after that, you're playing with house money.
- By year 8, paydown + projected appreciation supports a ~$30k cash-out refi (75% LTV) — recoverable capital for the next deal without selling this one.
Negotiation context
- It's been on market 41 days — a 3% lower offer ($107k) is reasonable based on typical stale-listing flexibility.
Risks & watch-outs
- Watch-outs: built in 1930 — expect roof / HVAC / electrical / plumbing capex.
- Climate carrying-cost: major wildfire risk — expect insurance premiums to compound above CPI over the hold.
Questions for the listing agent
- What do current leases actually rent for vs. the listed asking? Can we see a recent rent roll and the last 12 months of T-12 income?
- It's been on market 41 days. Have you received any prior offers? Is the seller open to a 26% concession, seller financing, or rate buy-down credit?
- Built in 1930 — when were the roof, HVAC, electrical panel, plumbing, and water heater last replaced?
- Is there a deadline driving the sale (1031 exchange, divorce, estate, relocation)? That informs how much negotiation room exists.
- The area grade is low — what's the realistic commute time and amenity access for the typical tenant pool here? Any planned neighborhood developments (good or bad) we should know about?
- What's the average days-on-market for RENTAL listings here right now (not sales)? A rising rental-DOM trend means longer vacancies and softer asking-rent achievability than the comps imply.
- What's the recent tenant-quality profile in this submarket — average credit score on applications, eviction rate, late-payment / NSF rate, and stable-employment percentage? A property-management company in the area should have these aggregated.
- How much new for-sale + rental construction is in the pipeline within 1–3 miles? Heavy new supply typically softens prices + rents 12–24 months out; constrained supply supports both.
Investment metrics
- 1% rule
- 0.74% ✗
- Cap rate
- 5.90%
- Cash-on-cash
- -1.40%
- DSCR
- 0.94
- GRM
- 11.3
CMA / ARV
No comps found within radius.
Projected returns pro-forma
3.0% appreciation · 3.0% rent growth · sell at horizon
- IRR
- 6.2%
- Equity multiple
- 1.35×
- Total profit
- $10,925
- Equity at exit
- $49,461
- IRR
- 9.1%
- Equity multiple
- 2.37×
- Total profit
- $42,061
- Equity at exit
- $76,225
Cash invested: $30,800 (down + closing). Projections, not guarantees.
Landlord ↔ Tenant lean methodology
- Overall (STATE)
- 46 Balanced
- State Minnesota
- 46 Balanced · D+2
- County
- — inherits STATE
- City
- — inherits STATE
ZIP-level market 56738
- Active inventory
- 6
- Price-to-rent
- 11.3×
Monthly cashflow live
- Estimated rent
- $812 medium interval (Pro) →
- Mortgage (P&I)
- −$577
- Tax from tax record
- −$54 /mo · $654/yr
- Insurance
- −$46
- HOA
- −$0
- Vacancy / Maint / Mgmt
- −$170
- Net cashflow
- $-36
Break-even live
Sensitivity live
| Price | -10% $26 | -5% $-5 | +0% $-36 | +5% $-67 | +10% $-98 |
|---|---|---|---|---|---|
| Rent | -10% $-100 | -5% $-68 | +0% $-36 | +5% $-4 | +10% $28 |
| Rate | -1.0pp $19 | -0.5pp $-8 | base $-36 | +0.5pp $-64 | +1.0pp $-93 |
UW: 25.0% down · 7.5% · 30yr · 1.5% tax · 5.0% vac · 8.0% maint · 8.0% mgmt
Financing live
Cash to close
- Down payment
- $27,500
- Closing costs
- $3,300
- Reserves months
- —
- Total cash needed
- —
Loan-product check · same deal, 3 products live
Conventional
25% down · 7.5% · 30yr
- Down + closing
- —
- Monthly P&I
- —
- Monthly cashflow
- —
- DSCR
- —
- Eligible?
- —
Personal DTI + credit; lowest rate.
DSCR
20% down · 8.5% · 30yr
- Down + closing
- —
- Monthly P&I
- —
- Monthly cashflow
- —
- DSCR
- —
- Eligible?
- —
No personal income docs; deal must DSCR.
Hard money
10% down · 12.0% · 12mo
- Down + closing
- —
- Monthly P&I
- —
- Monthly cashflow
- —
- DSCR
- —
- Eligible?
- —
Short-term bridge; refi at stabilization.
Listing history 15 events
-
2026-06-17status $110,000 Pending 41 DOM
-
2026-06-16days on market $110,000 Active 41 DOM
-
2026-06-15days on market $110,000 Active 40 DOM
-
2026-06-13days on market $110,000 Active 38 DOM
-
2026-06-12days on market $110,000 Active 37 DOM
-
2026-06-09days on market $110,000 Active 34 DOM
-
2026-06-08days on market $110,000 Active 33 DOM
-
2026-06-07days on market $110,000 Active 32 DOM
-
2026-06-07days on market $110,000 Active 31 DOM
-
2026-06-04days on market $110,000 Active 28 DOM
-
2026-06-02days on market $110,000 Active 27 DOM
-
2026-06-01days on market $110,000 Active 26 DOM
-
2026-05-31days on market $110,000 Active 25 DOM
-
2026-05-31days on market $110,000 Active 24 DOM
-
2026-05-06$110,000 Active 336-char remark
ⓘ Source: listings_history table (triggers on properties + properties_extension) + one-shot
backfill from property_details.listing_events for pre-trigger history.
Tax reassessment forecast MN · Partial reset (capped growth)
- Current annual tax
- $654 · $54/mo
- Projected year-2 tax
- $943 · $79/mo
- Expected delta
- +$289/yr (+$24/mo · 44.2%)
ⓘ Screening estimate from a state-policy table — verify with the county assessor before closing.
Climate risk First Street
- Flood 1/10 Low FEMA zone X (unshaded) · 0% chance over 30 yrs
- Wildfire 7/10 Severe
- Heat 1/10 Low 7 d/yr ≥95°F today · 12 d/yr by 30 yrs out
- Wind 1/10 Low
- Air quality 3/10 Moderate 2 unhealthy d/yr today · 2 by 30 yrs out
Nearby sold comps map
Loading sold comps map…
Walkable amenities ~0.75 mi
Loading nearby amenities…
Taxation est. · year 1
- Rental income
- $9,741
- − Mortgage interest
- −$6,162
- − Property taxes
- −$654
- − Insurance
- −$550
- − Repairs & maintenance
- −$779
- − Management
- −$779
- − Depreciation
- −$3,200
- Taxable loss
- −$2,383
- Est. tax savings @ 24.0%
- +$572
- After-tax cash flow
- $141/yr
For passive investors: Depreciation is non-cash, so a rental often shows a tax loss while cash-flowing — sheltering income. Rental losses are passive: they offset passive income freely, and up to $25,000/yr can offset ordinary (W-2) income if you actively participate and your MAGI is under $100k (phasing out to $0 by $150k); unused losses carry forward. On sale, claimed depreciation is recaptured at up to 25%, and gains may owe capital-gains tax (a 1031 exchange can defer both). Figures are a year-1 estimate at your 24.0% rate — not tax advice; consult a CPA.
Schools (NCES district)
- District
- Marshall County Central Schools
- NCES district ID
- 2723550
- Math proficiency
- 41% ▼ -9.00%
- Reading proficiency
- 49% ▼ -14.00%
- Median HH income
- $54,164
- Composite
- 39.01/100
- National rank
- #4070
- State rank
- #175 of 301 in MN
Livability — West Valley
No livability data for this city. (Only ~50 U.S. cities are tracked.)
Census & demographics
- Population (ZIP)
- 1,407
Population outlook (Marshall County) Hauer SSP2
- Today (2025)
- 9,191 people
- By 2030
- 9,078 · -1.2%
- By 2040
- 8,815 · -4.1%
- By 2050
- 8,464 · -7.9%
- By 2075
- 8,156 · -11.3%
- By 2100
- 7,171 · -22.0%
Race, ethnicity, and origin ACS 2023
- Neighborhood character
- Predominantly White (95%)
- Race & ethnicity
- White 95% Two or more races 3% Hispanic / Latino 2% Native American 1%
- Common ancestry
- Portuguese 54% Romanian 9% Scottish 3%
- Foreign-born
- 1% · Canada
- Languages at home
- 98% English-only · Other Indo-European 1%
Political lean MEDSL · Marshall
- 2024 margin
- Solid R (+51.7) · D 23.4% · R 75.1% · Other 1.4%
- 2008→2024 swing
- -52.2pp toward R · 2008: 0.6pp · 2024: -51.7pp
- All cycles
- 2024: R+51.7 2020: R+47.5 2016: R+41.4 2012: R+12.1 2008: D+0.6
Not yet ingested
- Civics
- —
Market trends
- HPI YoY
- —
- Current HPI
- —
- Rent YoY
- —
- Metro
- —
- State GDP YoY
- ▲ 2.41%
- F500 in state
- 34
Industry mix (Fortune 500 HQ in MN)
| Industry | F500 HQs | Revenue |
|---|---|---|
| Healthcare | 2 | $407B |
|
||
| Retail | 2 | $150B |
|
||
| Consumer Goods | 2 | $32B |
|
||
| Industrial Machinery | 2 | $6B |
|
||
| Agriculture | 1 | $40B |
|
||
| Healthcare / Medical Devices | 1 | $32B |
|
||
Price history
2 events — show timeline
- 2026-06-16 Pending — GFAAR
- 2026-05-06 Listed $110,000 GFAAR
Property tax history
+6.1%/yrLatest (2026): $654 · +2.5% YoY. Source: county tax records.
Cash-flow waterfall
monthlySold comps — $/sqft
last 12 mo · ≤1 miLoading sold comps…