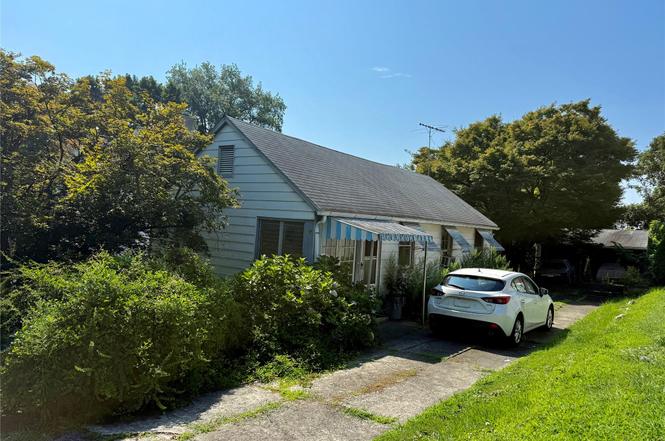
22 Lafayette Ave · Ossining, NY
Flood risk 1/10 · Minimal
- FEMA flood zone
- X (unshaded)
- Chance of flooding over 30 yrs
- 0.0%
- Est. flood insurance / yr
- $473 – $860
Fire risk 2/10 · Minimal
- Est. fire insurance / yr
- $691 – $1,283
Heat risk 6/10 · Moderate
- Hot days now (above 100°F)
- 7 days/yr
- Hot days in 30 yrs
- 15 days/yr
Wind risk 5/10 · Moderate
- Chance of severe wind over 30 yrs
- 26.0%
Air-quality risk 3/10 · Minor
- Unhealthy air days now
- 3 days/yr
- Unhealthy air days in 30 yrs
- 4 days/yr
Risk factors via First Street. Map © Google.
Why this score? — see what drove the C- grade
The composite is a weighted blend of 9 inputs, each scored 0–100. Each bar is that input's sub-score; the figure is the points it added to the 100-point composite (weight × sub-score).
- ARV discount +15.0/15.0
- Cash flow +13.5/30.0
- Schools +6.4/10.0
- 1% rule +4.6/10.0
- DSCR +4.1/10.0
- Livability +4.0/5.0
- Rent growth +2.5/5.0
- Condition / age +2.5/5.0
- Appreciation +0.0/10.0
$335,000
🖨 Deal sheet (PDF) 📄 Offer letter ✓ Due diligence
Listing remarks
Opportunity knocks. Are you looking for a starter house or is it time to downsize? 22 Lafayette Ave might be just what you've been looking for. Bring your vision and creativity to this cozy 3-bedroom, 1-bath ranch nestled on a quiet street in the heart of Ossining. Perfect for investors, contractors or handy buyers looking to build equity. Enter into a front porch leading to a living room, eat-in kitchen with a door out, 3 bedrooms and a full bath. The basement (accessible from the kitchen) has high ceilings and plenty of room for extra storage. There is a door that leads out to the yard. All of this on . 17 acres (long and deep lot) and a 2 car detached garage. Property to be sold in &quo
Key facts
- Extra storage
- Front porch
- Long and deep lot
Tags
Neighborhood map
What this means for you Summary
Snapshot
- This is a 3-bed/1.0-bath single-family listed at $335k.
Deal economics
- At list price, monthly cash flow is $14 ($172/yr) — positive.
- The deal already cash-flows at list — no discount required.
- To meet the 1% rule (rent ≥ 1% of price), the offer needs to be $322k (3.7% below list).
- Recommended offer: $322k (3.7% below list) — sets the bar for 1% rule.
- Cap rate 6.3% vs local median 2.9% in Ossining — top-decile yield for the area; either an underpriced asset or a hidden risk that comps aren't pricing in. Stress-test before assuming the spread holds.
Location & tenants
- Location reads 80/100 on livability (#116 in NY, #1,876 nationally) — a professional / high-income tenant draw. Strengths: commute A+, employment A+, health & safety A; Watch: cost of living F.
- Ossining Union Free School District (suburban): math 72% / reading 72% proficiency, ranked #104 of 590 in NY (top 18%) — strong family-tenant draw, lease renewals of 3-5y typical.
- Zoned schools: Brookside School (727 students, 50% FRL); Anne M Dorner Middle School (math 42% / reading 64%, grade C+, #231 of 729 statewide, top 32%, 1,033 students, 51% FRL); Ossining High School (math 86% / reading 82%, grade A, #404 of 1,100 statewide, top 37%, 1,552 students, 51% FRL).
- Market conditions: 134 active listings in the ZIP; 14 comparable units currently listed for rent nearby; rentals at typical pace (median 19d on market — plan ~3-4 weeks tenant-placement turnaround); high-income renter base; 954 units permitted in Westchester County in 2024 (649 in 5+ unit buildings).
- This rent runs 33% of the median local income ($116k/yr) — at the standard rent-burdened threshold; future hikes will face affordability resistance.
Forward outlook
- Local home prices are declining (-3.0%/yr); year-one equity from $2k of loan paydown is wiped out by about $10k of value loss. Plan a longer hold.
- Westchester County population projected at +10% by 2050 — modest demand growth; plan on rents tracking national, not racing it.
Negotiation context
- It's been on market 23 days — a 2% lower offer ($330k) is reasonable based on typical stale-listing flexibility.
Risks & watch-outs
- Watch-outs: built in 1927 — expect roof / HVAC / electrical / plumbing capex.
- Climate carrying-cost: moderate wind risk, 26% chance of damaging wind over 30y; extreme-heat days projected 7→15/yr by 2055 (HVAC capex compounding) — expect insurance premiums to compound above CPI over the hold.
Questions for the listing agent
- Built in 1927 — when were the roof, HVAC, electrical panel, plumbing, and water heater last replaced?
- Is there a deadline driving the sale (1031 exchange, divorce, estate, relocation)? That informs how much negotiation room exists.
- Schools are D-rated, which usually means shorter tenancies and higher turnover. Who's the typical renter profile here, and what's been the actual vacancy rate?
- What's the average days-on-market for RENTAL listings here right now (not sales)? A rising rental-DOM trend means longer vacancies and softer asking-rent achievability than the comps imply.
- What's the recent tenant-quality profile in this submarket — average credit score on applications, eviction rate, late-payment / NSF rate, and stable-employment percentage? A property-management company in the area should have these aggregated.
- How much new for-sale + rental construction is in the pipeline within 1–3 miles? Heavy new supply typically softens prices + rents 12–24 months out; constrained supply supports both.
Investment metrics
- 1% rule
- 0.96% ✗
- Cap rate
- 6.34%
- Cash-on-cash
- 0.18%
- DSCR
- 1.01
- GRM
- 8.7
CMA / ARV
- ARV (on-the-fly)
- $466,468
- Comps found
- 1
Show comp detail 1 sale within ~0.75 mi
| Address | Dist | Beds/Ba | Sqft | Sold | Price | $/sf | Match |
|---|---|---|---|---|---|---|---|
| 24 Nelson Ave | 0.05mi | 2/1.0 (-1) | 767 (-9%) | 6mo | $425,000 | $554 | 73 |
Match score weights: distance 35% · size 25% · config 20% · recency 20%. Top-matched comps best support the ARV.
Projected returns pro-forma
-3.0% appreciation · 3.0% rent growth · sell at horizon
- IRR
- -15.9%
- Equity multiple
- 0.43×
- Total profit
- $-53,188
- Equity at exit
- $49,950
- IRR
- -7.5%
- Equity multiple
- 0.53×
- Total profit
- $-44,398
- Equity at exit
- $28,965
Cash invested: $93,800 (down + closing). Projections, not guarantees.
Landlord ↔ Tenant lean methodology
- Overall (STATE)
- 15 Strongly Tenant-Friendly
- State New York
- 15 Strongly Tenant-Friendly · D+10
- County
- — inherits STATE
- City
- — inherits STATE
ZIP-level market 10562
- Active inventory
- 134
- Price-to-rent
- 8.7×
Monthly cashflow live
- Estimated rent
- $3,224 high interval (Pro) →
- Mortgage (P&I)
- −$1,757
- Tax from tax record
- −$637 /mo · $7,639/yr
- Insurance
- −$140
- HOA
- −$0
- Vacancy / Maint / Mgmt
- −$677
- Net cashflow
- $14
Break-even live
Sensitivity live
| Price | -10% $204 | -5% $109 | +0% $14 | +5% $-80 | +10% $-175 |
|---|---|---|---|---|---|
| Rent | -10% $-240 | -5% $-113 | +0% $14 | +5% $142 | +10% $269 |
| Rate | -1.0pp $183 | -0.5pp $100 | base $14 | +0.5pp $-72 | +1.0pp $-161 |
UW: 25.0% down · 7.5% · 30yr · 1.5% tax · 5.0% vac · 8.0% maint · 8.0% mgmt
Financing live
Cash to close
- Down payment
- $83,750
- Closing costs
- $10,050
- Reserves months
- —
- Total cash needed
- —
Loan-product check · same deal, 3 products live
Conventional
25% down · 7.5% · 30yr
- Down + closing
- —
- Monthly P&I
- —
- Monthly cashflow
- —
- DSCR
- —
- Eligible?
- —
Personal DTI + credit; lowest rate.
DSCR
20% down · 8.5% · 30yr
- Down + closing
- —
- Monthly P&I
- —
- Monthly cashflow
- —
- DSCR
- —
- Eligible?
- —
No personal income docs; deal must DSCR.
Hard money
10% down · 12.0% · 12mo
- Down + closing
- —
- Monthly P&I
- —
- Monthly cashflow
- —
- DSCR
- —
- Eligible?
- —
Short-term bridge; refi at stabilization.
Rent comps 14 comps
| Address | Beds | Baths | Sqft | Rent | $/sqft | DOM | Units | Dist |
|---|---|---|---|---|---|---|---|---|
| 188 Spring St Unit 4 Ossining, NY | 2.0 | 1.0 | 797 | $2,850 | $3.58 | 3d | 1 | 0.28mi |
| 76 State St Unit 10 Ossining, NY | 3.0 | 1.0 | 1100 | $2,750 | $2.50 | 44d | 1 | 0.28mi |
| 90 S Highland Ave Unit 6 Ossining, NY | 2.0 | 1.5 | 1092 | $3,500 | $3.21 | 5d | 1 | 0.30mi |
| 87 S Highland Ave Apt B27* Ossining, NY | 2.0 | 1.0 | 950 | $2,650 | $2.79 | 5d | 1 | 0.31mi |
| 85 S Highland Ave Ossining, NY | 2.0 | 1.0 | 950 | $2,300 | $2.42 | 44d | 1 | 0.37mi |
| 11 Maurice Ave Unit 3 Ossining, NY | 2.0 | 1.0 | 800 | $3,000 | $3.75 | 11d | 1 | 0.42mi |
| 13 Hunter St Unit 2 Ossining, NY | 3.0 | 1.0 | 775 | $3,450 | $4.45 | 44d | 1 | 0.56mi |
| 1 Harbor Sq Ossining, NY | 1.0–2.0 | 1.0–2.5 | 894 | $5,795 | $6.48 | 2d | 8 | 0.62mi |
| 5 Brandreth St Unit 2B Ossining, NY | 2.0 | 2.0 | 1000 | $3,000 | $3.00 | 44d | 1 | 0.75mi |
| 87 Snowden Ave Ossining, NY | 2.0 | 1.0 | 528 | $1,900 | $3.60 | 11d | 1 | 0.91mi |
| 29 Dale Ave Ossining, NY | 2.0 | 1.0 | 800 | $2,800 | $3.50 | 19d | 1 | 1.20mi |
| 2 John St #2 Ossining, NY | 2.0 | 1.0 | 850 | $2,750 | $3.24 | 44d | 1 | 1.26mi |
| 24 Claremont Gdns Ossining, NY | 1.0–3.0 | 1.0–1.5 | 625 | $3,100 | $4.96 | 2d | 3 | 1.30mi |
| 48 Ferris Pl Ossining, NY | 3.0 | 1.0 | 1080 | $3,000 | $2.78 | 19d | 1 | 1.41mi |
Listing history 2 events
-
2025-11-12status Pending
-
2025-09-15$335,000 Active
ⓘ Source: listings_history table (triggers on properties + properties_extension) + one-shot
backfill from property_details.listing_events for pre-trigger history.
Tax reassessment forecast NY · Partial reset (capped growth)
- Current annual tax
- $7,639 · $637/mo
- Projected year-2 tax
- $7,639 · $637/mo
- Expected delta
- $0/yr ($0/mo · 0.0%)
ⓘ Screening estimate from a state-policy table — verify with the county assessor before closing.
Climate risk First Street
- Flood 1/10 Low FEMA zone X (unshaded) · 0% chance over 30 yrs
- Wildfire 2/10 Low
- Heat 6/10 Major 7 d/yr ≥100°F today · 15 d/yr by 30 yrs out
- Wind 5/10 Major 26% chance of damaging wind over 30 yrs
- Air quality 3/10 Moderate 3 unhealthy d/yr today · 4 by 30 yrs out
Nearby sold comps map
Loading sold comps map…
Walkable amenities ~0.75 mi
Loading nearby amenities…
Taxation est. · year 1
- Rental income
- $38,693
- − Mortgage interest
- −$18,765
- − Property taxes
- −$7,639
- − Insurance
- −$1,675
- − Repairs & maintenance
- −$3,095
- − Management
- −$3,095
- − Depreciation
- −$9,745
- Taxable loss
- −$5,323
- Est. tax savings @ 24.0%
- +$1,277
- After-tax cash flow
- $1,450/yr
For passive investors: Depreciation is non-cash, so a rental often shows a tax loss while cash-flowing — sheltering income. Rental losses are passive: they offset passive income freely, and up to $25,000/yr can offset ordinary (W-2) income if you actively participate and your MAGI is under $100k (phasing out to $0 by $150k); unused losses carry forward. On sale, claimed depreciation is recaptured at up to 25%, and gains may owe capital-gains tax (a 1031 exchange can defer both). Figures are a year-1 estimate at your 24.0% rate — not tax advice; consult a CPA.
Schools (NCES district)
- District
- Ossining Union Free School District
- NCES district ID
- 3622020
- Math proficiency
- 72% ▲ 27.00%
- Reading proficiency
- 72% ▲ 25.00%
- Median HH income
- $78,402
- Composite
- 63.75/100
- National rank
- #599
- State rank
- #104 of 590 in NY
Livability — Ossining
- Score
- 80/100
- State rank
- #116
- US rank
- #1876
Category grades
Schools grade is shown separately in the Schools card above.
Census & demographics
- Census place
- Ossining, NY
- County
- Westchester County · 709,332 people
- City population
- 33,793
- Metro
- New York-Newark-Jersey City, NY-NJ-PA
- Population (ZIP)
- 33,793
- Household income
- $115,697
- Rent vs Own
- Severe rent burden
- 1248.0
Population outlook (Westchester County) Hauer SSP2
- Today (2025)
- 1,028,035 people
- By 2030
- 1,051,636 · +2.3%
- By 2040
- 1,098,520 · +6.9%
- By 2050
- 1,136,044 · +10.5%
- By 2075
- 1,196,925 · +16.4%
- By 2100
- 1,175,147 · +14.3%
Race, ethnicity, and origin ACS 2023
- Neighborhood character
- Diverse neighborhood (Simpson 0.63)
- Race & ethnicity
- White 47% Hispanic / Latino 37% Two or more races 11% Black 8% Asian 4%
- Hispanic origin (detail)
- Puerto Rican 6% Cuban 2% Dominican 3%
- Common ancestry
- Romanian 3% Scotch-Irish 3% Italian 2%
- Foreign-born
- 28% · Canada, Jamaica, China
- Languages at home
- 59% English-only · Spanish 31% Other Indo-European 4% Russian/Polish/Slavic 1%
Political lean MEDSL · Westchester
- 2024 margin
- Strong D (+26.3) · D 63.1% · R 36.9%
- 2008→2024 swing
- -1.3pp toward R · 2008: 27.6pp · 2024: 26.3pp
- All cycles
- 2024: D+26.3 2020: D+36.3 2016: D+32.8 2012: D+22.2 2008: D+27.6
Not yet ingested
- Civics
- —
Market trends
- HPI YoY
- ▼ -605.12%
- Current HPI
- 251.6831
- Rent YoY
- —
- Metro
- New York-Newark-Jersey City, NY-NJ-PA
- State GDP YoY
- ▲ 2.60%
- F500 in state
- 92
Industry mix (Fortune 500 HQ in NY)
| Industry | F500 HQs | Revenue |
|---|---|---|
| Financial Services | 10 | $950B |
|
||
| Consumer Goods | 9 | $162B |
|
||
| Insurance | 4 | $225B |
|
||
| Telecommunications | 2 | $144B |
|
||
| Pharmaceuticals | 2 | $112B |
|
||
| Media / Entertainment | 2 | $69B |
|
||
Price history
2 events — show timeline
- 2025-11-12 Pending — OneKey® MLS as Distributed by MLS Grid
- 2025-09-15 Listed $335,000 OneKey® MLS as Distributed by MLS Grid
Property tax history
+35.8%/yrLatest (2025): $7,639 · +204.8% YoY. Source: county tax records.
Cash-flow waterfall
monthlySold comps — $/sqft
last 12 mo · ≤1 miLoading sold comps…