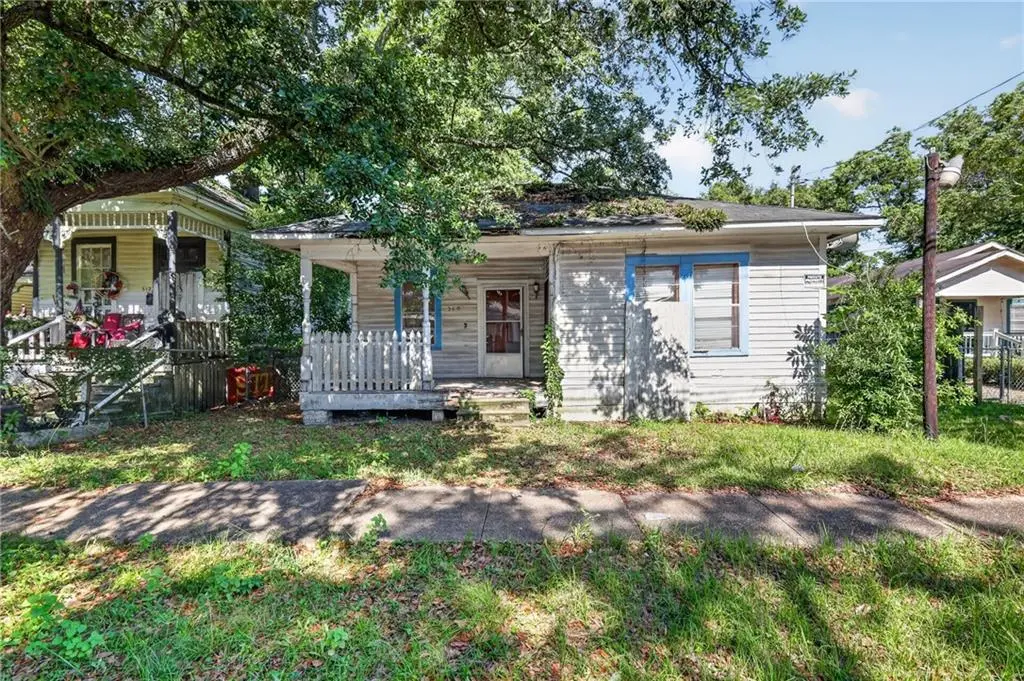
510 Marine St · Mobile, AL
Flood risk 7/10 · Major
- FEMA flood zone
- X (shaded)
- Chance of flooding over 30 yrs
- 0.7%
- Est. flood insurance / yr
- $507 – $1,088
Fire risk 1/10 · Minimal
- Est. fire insurance / yr
- $916 – $1,700
Heat risk 9/10 · Severe
- Hot days now (above 105°F)
- 7 days/yr
- Hot days in 30 yrs
- 21 days/yr
Wind risk 9/10 · Severe
- Chance of severe wind over 30 yrs
- 99.0%
Air-quality risk 2/10 · Minimal
- Unhealthy air days now
- 1 days/yr
- Unhealthy air days in 30 yrs
- 1 days/yr
Risk factors via First Street. Map © Google.
Why this score? — see what drove the B- grade
The composite is a weighted blend of 9 inputs, each scored 0–100. Each bar is that input's sub-score; the figure is the points it added to the 100-point composite (weight × sub-score).
- Cash flow +30.0/30.0
- 1% rule +10.0/10.0
- DSCR +10.0/10.0
- ARV discount +7.5/15.0
- Livability +3.8/5.0
- Rent growth +3.4/5.0
- Condition / age +2.5/5.0
- Schools +2.3/10.0
- Appreciation +0.0/10.0
$55,000
🖨 Deal sheet 📄 Offer letter ✓ Due diligence
Listing remarks
Investment Opportunity in Midtown Mobile! Located at 510 Marine Street, this 4-bedroom, 2-bath home offers strong potential for investors looking to add to their portfolio. Featuring spacious living areas and plenty of room for updates or rental income potential, this property is ideal as a long-term rental, flip, or value-add opportunity. Conveniently located near downtown, dining, shopping, and all that Midtown Mobile has to offer. Property being sold AS-IS, WHERE-IS. Buyer or buyer’s agent to verify all information deemed important, including square footage, lot dimensions, condition, and any other matters of concern during due diligence.
Key facts
- 8,912 sq ft lot
- Listed 20 days
Tags
Property features AI
Exterior
- Parking: Driveway
- Utilities: Public sewer; Other electric; Other utilities; No land lease
- Home design: Single Family Residence; Residential property
- Construction: Shingle roof; Other construction materials; No foundation details; No window features listed
- Exterior features: Other exterior features; No fencing; No other structures; View present; No waterfront
Interior
- Kitchen: Other kitchen features
- Bedrooms: 4 bedrooms
- Flooring: Other flooring
- Bathrooms: 2 full bathrooms
- Heating & cooling: Other heating; Other cooling
- Interior features: Other interior features; No fireplace
- Laundry & utility: Other appliances
Neighborhood map
What this means for you Summary
Snapshot
- This is a 4-bed/2.0-bath single-family listed at $55k.
Deal economics
- At list price, monthly cash flow is $1k ($15k/yr) — positive.
- The deal already cash-flows at list — no discount required.
- Meets the 1% rule at list price ($2k rent vs $55k).
- Recommended offer: $54k (1.5% below list) — sets the bar for market timing.
- Cap rate 35.3% vs local median 4.9% in Mobile — top-decile yield for the area; either an underpriced asset or a hidden risk that comps aren't pricing in. Stress-test before assuming the spread holds.
Location & tenants
- Location reads 75/100 on livability (#20 in AL, #4,262 nationally) — a middle-class / working-renter tenant base. Strengths: commute A+, cost of living A+, housing A+; Watch: schools D-, crime F, employment D-.
- Mobile County (urban): math 15% / reading 39% proficiency, ranked #81 of 129 in AL (top 63%) — low school quality limits family demand, transient renter base, plan for 1-2y turnover; 67% free/reduced lunch — lower-income household profile, screen leases tightly.
- Market conditions: Rents rising (+3.8%/yr); 93 active listings in the ZIP; 12 comparable units currently listed for rent nearby; rentals lingering (median 44d on market — plan ~5-8 weeks vacancy on turnover, expect pricing pressure); 50% of comp listings sitting > 30 days — soft ceiling on asking rent; 1,678 units permitted in Mobile County in 2024 (264 in 5+ unit buildings).
- This rent runs 39% of the median local income ($66k/yr) — at the standard rent-burdened threshold; future hikes will face affordability resistance.
Forward outlook
- Local home prices are declining (-3.0%/yr); year-one equity from $380 of loan paydown is wiped out by about $2k of value loss. Plan a longer hold.
- Mobile County population projected to shrink 8% by 2050 — rents likely to lag national; underwrite the cash flow, not the appreciation.
- At projected returns (-3.0% appreciation + 3.8% rent growth), your $15k cash investment doubles in ~2 years — after that, you're playing with house money.
Negotiation context
- It's been on market 20 days — a 2% lower offer ($54k) is reasonable based on typical stale-listing flexibility.
Risks & watch-outs
- Watch-outs: flood insurance adds $66/mo.
- Climate carrying-cost: major flood risk; severe wind risk, 99% chance of damaging wind over 30y; extreme-heat days projected 7→21/yr by 2055 (HVAC capex compounding) — expect insurance premiums to compound above CPI over the hold.
Questions for the listing agent
- What's the actual annual flood-insurance premium (NFIP or private), and is the property in a SFHA with mandatory coverage?
- Is there a deadline driving the sale (1031 exchange, divorce, estate, relocation)? That informs how much negotiation room exists.
- Schools are D-rated, which usually means shorter tenancies and higher turnover. Who's the typical renter profile here, and what's been the actual vacancy rate?
- Crime grade is F in this area — have there been break-ins, vandalism, or insurance claims at this property in the last 3 years? What carrier currently insures it and at what premium?
- What's the average days-on-market for RENTAL listings here right now (not sales)? A rising rental-DOM trend means longer vacancies and softer asking-rent achievability than the comps imply.
- What's the recent tenant-quality profile in this submarket — average credit score on applications, eviction rate, late-payment / NSF rate, and stable-employment percentage? A property-management company in the area should have these aggregated.
- How much new for-sale + rental construction is in the pipeline within 1–3 miles? Heavy new supply typically softens prices + rents 12–24 months out; constrained supply supports both.
Investment metrics
- 1% rule
- 3.88% ✓
- Cap rate
- 35.33%
- Cash-on-cash
- 103.70%
- DSCR
- 5.61
- GRM
- 2.1
CMA / ARV
- ARV (on-the-fly)
- $209,550
- Comps found
- 12
Show comp detail 12 sales within ~0.75 mi
| Address | Dist | Beds/Ba | Sqft | Sold | Price | $/sf | Match |
|---|---|---|---|---|---|---|---|
| 958 Elmira St | 0.12mi | 3/1.0 (-1) | 1,600 (-3%) | 6mo | $64,000 | $40 | 75 |
| 350 Broad St S | 0.26mi | 3/2.5 (-1) | 1,731 (+5%) | 13mo | $300,000 | $173 | 62 |
| 1005 Savannah St | 0.26mi | 3/2.0 (-1) | 1,545 (-6%) | 18mo | $397,500 | $257 | 58 |
| 802 Elmira St | 0.23mi | 3/3.0 (-1) | 1,752 (+6%) | 20mo | $223,000 | $127 | 53 |
| 607 Texas St | 0.42mi | 3/2.0 (-1) | 1,539 (-7%) | 15mo | $189,500 | $123 | 52 |
| 961 Savannah St | 0.24mi | 3/2.0 (-1) | 1,835 (+11%) | 19mo | $420,000 | $229 | 49 |
| 1123 Palmetto St | 0.44mi | 3/2.0 (-1) | 1,854 (+12%) | 6mo | $358,000 | $193 | 49 |
| 761 Broad St S | 0.39mi | 3/2.5 (-1) | 1,830 (+11%) | 13mo | $115,000 | $63 | 46 |
| 361 Regina Ave | 0.48mi | 3/2.0 (-1) | 1,860 (+13%) | 8mo | $265,000 | $142 | 44 |
| 909 Dearborn St S | 0.59mi | 3/2.0 (-1) | 1,464 (-11%) | 7mo | $135,000 | $92 | 43 |
| 700 Carolina St S | 0.56mi | 3/1.0 (-1) | 1,526 (-8%) | 15mo | $80,000 | $52 | 40 |
| 610 Carolina St S | 0.60mi | 3/2.0 (-1) | 1,534 (-7%) | 19mo | $162,000 | $106 | 39 |
Match score weights: distance 35% · size 25% · config 20% · recency 20%. Top-matched comps best support the ARV.
Projected returns pro-forma
-3.0% appreciation · 3.78% rent growth · sell at horizon
- IRR
- —
- Equity multiple
- 5.76×
- Total profit
- $73,358
- Equity at exit
- $8,201
- IRR
- —
- Equity multiple
- 12.35×
- Total profit
- $174,837
- Equity at exit
- $4,755
Cash invested: $15,400 (down + closing). Projections, not guarantees.
Landlord ↔ Tenant lean methodology
- Overall (STATE)
- 90 Strongly Landlord-Friendly
- State Alabama
- 90 Strongly Landlord-Friendly · R+15
- County
- — inherits STATE
- City
- — inherits STATE
ZIP-level market 36604
- Rents YoY
- 3.8%
- Active inventory
- 93
- Price-to-rent
- 2.1×
Monthly cashflow live
- Estimated rent
- $2,134 high interval (Pro) →
- Mortgage (P&I)
- −$288
- Tax from tax record
- −$43 /mo · $521/yr
- Insurance
- −$23
- Flood insurance flood zone
- −$66 /mo · $798/yr
- HOA
- −$0
- Vacancy / Maint / Mgmt
- −$448
- Net cashflow
- $1,264
Break-even live
UW: 25.0% down · 7.5% · 30yr · 1.5% tax · 5.0% vac · 8.0% maint · 8.0% mgmt
Financing live
Cash to close
- Down payment
- $13,750
- Closing costs
- $1,650
- Reserves months
- —
- Total cash needed
- —
Loan-product check · same deal, 3 products live
Conventional
25% down · 7.5% · 30yr
- Down + closing
- —
- Monthly P&I
- —
- Monthly cashflow
- —
- DSCR
- —
- Eligible?
- —
Personal DTI + credit; lowest rate.
DSCR
20% down · 8.5% · 30yr
- Down + closing
- —
- Monthly P&I
- —
- Monthly cashflow
- —
- DSCR
- —
- Eligible?
- —
No personal income docs; deal must DSCR.
Hard money
10% down · 12.0% · 12mo
- Down + closing
- —
- Monthly P&I
- —
- Monthly cashflow
- —
- DSCR
- —
- Eligible?
- —
Short-term bridge; refi at stabilization.
Rent comps 12 comps
| Address | Beds | Baths | Sqft | Rent | $/sqft | DOM | Units | Dist |
|---|---|---|---|---|---|---|---|---|
| 814 S Broad St Unit 1043690P Mobile, AL | 3.0 | 2.0 | 1991 | $3,562 | $1.79 | 13d | 1 | 0.49mi |
| 1141 Montauk Ave Unit 1043864P Mobile, AL | 3.0 | 2.0 | 1420 | $2,741 | $1.93 | 13d | 1 | 0.71mi |
| 500 Palmetto St Mobile, AL | 3.0 | 2.0 | 1786 | $1,450 | $0.81 | 43d | 1 | 0.75mi |
| 811 Gorgas St Mobile, AL | 4.0 | 1.0 | 1300 | $1,310 | $1.01 | 43d | 1 | 0.76mi |
| 961 Old Shell Rd Unit A Mobile, AL | 3.0 | 2.5 | 1600 | $1,295 | $0.81 | 43d | 1 | 0.82mi |
| 1204 Seneca St Mobile, AL | 3.0 | 2.0 | 1425 | $1,345 | $0.94 | 13d | 1 | 0.96mi |
| 84 S Lafayette St Unit 1043577P Mobile, AL | 3.0 | 2.0 | 1496 | $3,116 | $2.08 | 13d | 1 | 1.00mi |
| 107 Michael Donald Ave Unit 1043461P Mobile, AL | 4.0 | 3.5 | 2195 | $3,962 | $1.81 | 13d | 1 | 1.00mi |
| 107 Macy Pl Mobile, AL | 3.0 | 2.0 | 1800 | $2,250 | $1.25 | 43d | 1 | 1.24mi |
| 1566 Dauphin St Unit Back Carriage House Mobile, AL | 3.0 | 1.0 | 1300 | $1,200 | $0.92 | 43d | 1 | 1.34mi |
| 1660 Laurel St Mobile, AL | 3.0 | 2.0 | 1768 | $2,200 | $1.24 | 13d | 1 | 1.37mi |
| 1704 McGill Ave Unit B Mobile, AL | 3.0 | 2.5 | 1500 | $1,750 | $1.17 | 43d | 1 | 1.43mi |
Listing history 17 events
-
2026-06-18days on market $55,000 Active 20 DOM
-
2026-06-17days on market $55,000 Active 19 DOM
-
2026-06-16days on market $55,000 Active 18 DOM
-
2026-06-15days on market $55,000 Active 17 DOM
-
2026-06-14days on market $55,000 Active 15 DOM
-
2026-06-13days on market $55,000 Active 14 DOM
-
2026-06-10days on market $55,000 Active 12 DOM
-
2026-06-09days on market $55,000 Active 11 DOM
-
2026-06-08days on market $55,000 Active 10 DOM
-
2026-06-07days on market $55,000 Active 9 DOM
-
2026-06-05days on market $55,000 Active 6 DOM
-
2026-06-03days on market $55,000 Active 5 DOM
-
2026-06-02days on market $55,000 Active 4 DOM
-
2026-06-01days on market $55,000 Active 3 DOM
-
2026-05-31days on market $55,000 Active 2 DOM
-
2026-05-30remarks 649-char remark
-
2026-05-30$55,000 Active 1 DOM
ⓘ Source: listings_history table (triggers on properties + properties_extension) + one-shot
backfill from property_details.listing_events for pre-trigger history.
Tax reassessment forecast AL · Resets to sale price
- Current annual tax
- $521 · $43/mo
- Projected year-2 tax
- $521 · $43/mo
- Expected delta
- $0/yr ($0/mo · 0.0%)
ⓘ Screening estimate from a state-policy table — verify with the county assessor before closing.
Climate risk First Street
- Flood 7/10 Severe FEMA zone X (shaded) · 70% chance over 30 yrs
- Wildfire 1/10 Low
- Heat 9/10 Extreme 7 d/yr ≥105°F today · 21 d/yr by 30 yrs out
- Wind 9/10 Extreme 99% chance of damaging wind over 30 yrs
- Air quality 2/10 Low 1 unhealthy d/yr today · 1 by 30 yrs out
Nearby sold comps map
Loading sold comps map…
Walkable amenities ~0.75 mi
Loading nearby amenities…
Taxation est. · year 1
- Rental income
- $25,603
- − Mortgage interest
- −$3,081
- − Property taxes
- −$521
- − Insurance
- −$1,072
- − Repairs & maintenance
- −$2,048
- − Management
- −$2,048
- − Depreciation
- −$1,600
- Taxable income
- $15,232
- Est. tax owed @ 24.0%
- −$3,656
- After-tax cash flow
- $11,516/yr
For passive investors: Depreciation is non-cash, so a rental often shows a tax loss while cash-flowing — sheltering income. Rental losses are passive: they offset passive income freely, and up to $25,000/yr can offset ordinary (W-2) income if you actively participate and your MAGI is under $100k (phasing out to $0 by $150k); unused losses carry forward. On sale, claimed depreciation is recaptured at up to 25%, and gains may owe capital-gains tax (a 1031 exchange can defer both). Figures are a year-1 estimate at your 24.0% rate — not tax advice; consult a CPA.
Schools (NCES district)
- District
- Mobile County
- NCES district ID
- 0102370
- Math proficiency
- 15% ▼ -28.00%
- Reading proficiency
- 39% ▬ 0.00%
- Median HH income
- $42,455
- Composite
- 22.9/100
- National rank
- #8002
- State rank
- #81 of 129 in AL
Livability — Mobile
- Score
- 75/100
- State rank
- #20
- US rank
- #4262
Category grades
Schools grade is shown separately in the Schools card above.
Census & demographics
- Census place
- Mobile, AL
- County
- Mobile County · 246,577 people
- City population
- 205,729
- Metro
- Mobile, AL
- Population (ZIP)
- 8,836
- Household income
- $66,357
- Rent vs Own
- Severe rent burden
- 452.0
Population outlook (Mobile County) Hauer SSP2
- Today (2025)
- 415,303 people
- By 2030
- 411,755 · -0.9%
- By 2040
- 399,670 · -3.8%
- By 2050
- 382,616 · -7.9%
- By 2075
- 337,353 · -18.8%
- By 2100
- 283,391 · -31.8%
Race, ethnicity, and origin ACS 2023
- Neighborhood character
- Diverse neighborhood (Simpson 0.56)
- Race & ethnicity
- White 51% Black 42% Two or more races 3% Hispanic / Latino 2%
- Common ancestry
- Lithuanian 4% Serbian 2% Slovak 2%
- Foreign-born
- 2% · Canada, China
- Languages at home
- 97% English-only · Spanish 2%
Political lean MEDSL · Mobile
- 2024 margin
- R (+16.4) · D 41.3% · R 57.7%
- 2008→2024 swing
- -7.7pp toward R · 2008: -8.7pp · 2024: -16.4pp
- All cycles
- 2024: R+16.4 2020: R+11.9 2016: R+13.9 2012: R+9.3 2008: R+8.7
Not yet ingested
- Civics
- —
Market trends
- HPI YoY
- ▼ -143.27%
- Current HPI
- 205.7241
- Rent YoY
- ▲ 3.78%
- Metro
- Mobile, AL
- State GDP YoY
- ▲ 2.94%
- F500 in state
- 4
Industry mix (Fortune 500 HQ in AL)
| Industry | F500 HQs | Revenue |
|---|---|---|
| Financial Services | 1 | $8B |
|
||
| Healthcare | 1 | $5B |
|
||
Price history
1 event — show timeline
- 2026-05-30 Listed $55,000 GCMLS AL
Property tax history
+0.8%/yrLatest (2025): $521 · +6.8% YoY. Source: county tax records.
Cash-flow waterfall
monthlySold comps — $/sqft
last 12 mo · ≤1 miLoading sold comps…