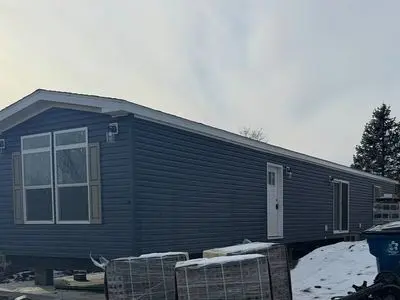
744 Cloverleaf Cir · Delmont, PA
Flood risk 1/10 · Minimal
- FEMA flood zone
- X (unshaded)
- Chance of flooding over 30 yrs
- 0.0%
- Est. flood insurance / yr
- $507 – $1,088
Fire risk 1/10 · Minimal
- Est. fire insurance / yr
- $511 – $949
Heat risk 3/10 · Minor
- Hot days now (above 96°F)
- 7 days/yr
- Hot days in 30 yrs
- 19 days/yr
Wind risk 2/10 · Minimal
- Chance of severe wind over 30 yrs
- —
Air-quality risk 3/10 · Minor
- Unhealthy air days now
- 3 days/yr
- Unhealthy air days in 30 yrs
- 5 days/yr
Risk factors via First Street. Map © Google.
Why this score? — see what drove the D grade
The composite is a weighted blend of 9 inputs, each scored 0–100. Each bar is that input's sub-score; the figure is the points it added to the 100-point composite (weight × sub-score).
- Cash flow +15.5/30.0
- ARV discount +7.5/15.0
- DSCR +4.8/10.0
- Livability +3.6/5.0
- Schools +3.5/10.0
- 1% rule +3.0/10.0
- Rent growth +2.5/5.0
- Condition / age +2.5/5.0
- Appreciation +0.0/10.0
$132,900
🖨 Deal sheet (PDF) 📄 Offer letter ✓ Due diligence
Listing remarks
Brand new home with 2 bedrooms and 2 bathrooms, featuring custom walls and a modern kitchen with cabinets to the ceiling. Includes an 8 & Atilde; & mdash; 8 storage shed and covered carport for added convenience. Move-in ready with stylish finishes and plenty of storage
Key facts
- Move-in ready
- Plenty of storage
- Covered carport
Tags
Neighborhood map
What this means for you Summary
Snapshot
- This is a 2-bed/2.0-bath manufactured listed at $133k.
Deal economics
- At list price, monthly cash flow is $54 ($653/yr) — positive.
- The deal already cash-flows at list — no discount required.
- To meet the 1% rule (rent ≥ 1% of price), the offer needs to be $106k (20.5% below list).
- Recommended offer: $106k (20.5% below list) — sets the bar for 1% rule.
- Cap rate 6.8% vs local median 2.3% in Delmont — top-decile yield for the area; either an underpriced asset or a hidden risk that comps aren't pricing in. Stress-test before assuming the spread holds.
Location & tenants
- Location reads 72/100 on livability (#663 in PA) — a middle-class / working-renter tenant base. Strengths: crime A+, cost of living A+, housing A+; Watch: amenities F, commute F, health & safety F.
- Greensburg Salem SD (suburban): math 31% / reading 52% proficiency, ranked #346 of 539 in PA (top 64%) — families likely to look elsewhere, expect single-tenant / working-renter base with shorter leases.
- Zoned schools: Metzgar El Sch (math 42% / reading 62%, grade C-, #586 of 1,518 statewide, top 42%, 294 students, 47% FRL); Greensburg-Salem Ms (math 18% / reading 52%, grade F, #322 of 512 statewide, top 64%, 599 students, 52% FRL); Greensburg-Salem Hs (math 62% / reading 34%, grade D, #153 of 437 statewide, top 37%, 820 students, 36% FRL) — zoned schools at 45% FRL track the district average.
- Market conditions: 22 active listings in the ZIP; 415 units permitted in Westmoreland County in 2024 (10 in 5+ unit buildings).
Forward outlook
- Local home prices are declining (-3.0%/yr); year-one equity from $919 of loan paydown is wiped out by about $4k of value loss. Plan a longer hold.
- Westmoreland County population projected at -19% by 2050 — secular population decline; favor cash flow + early exit over multi-decade hold.
Negotiation context
- Only 1 days on market — expect competitive offers; lowballing is unlikely to land.
Questions for the listing agent
- Built in 1972 — when were the roof, HVAC, electrical panel, plumbing, and water heater last replaced?
- Is there a deadline driving the sale (1031 exchange, divorce, estate, relocation)? That informs how much negotiation room exists.
- Schools are D-rated, which usually means shorter tenancies and higher turnover. Who's the typical renter profile here, and what's been the actual vacancy rate?
- The area grade is low — what's the realistic commute time and amenity access for the typical tenant pool here? Any planned neighborhood developments (good or bad) we should know about?
- What's the average days-on-market for RENTAL listings here right now (not sales)? A rising rental-DOM trend means longer vacancies and softer asking-rent achievability than the comps imply.
- What's the recent tenant-quality profile in this submarket — average credit score on applications, eviction rate, late-payment / NSF rate, and stable-employment percentage? A property-management company in the area should have these aggregated.
- How much new for-sale + rental construction is in the pipeline within 1–3 miles? Heavy new supply typically softens prices + rents 12–24 months out; constrained supply supports both.
Investment metrics
- 1% rule
- 0.80% ✗
- Cap rate
- 6.78%
- Cash-on-cash
- 1.75%
- DSCR
- 1.08
- GRM
- 10.5
CMA / ARV
- ARV (on-the-fly)
- $32,832
- Comps found
- 5
Show comp detail 5 sales within ~0.75 mi
| Address | Dist | Beds/Ba | Sqft | Sold | Price | $/sf | Match |
|---|---|---|---|---|---|---|---|
| 747 Cloverleaf Cir | 0.03mi | 2/1.0 | 876 (+1%) | 16mo | $24,000 | $27 | 79 |
| 757 Cloverleaf Cir | 0.05mi | 2/2.0 | 952 (+10%) | 14mo | $107,500 | $113 | 69 |
| 154 Sheffield Dr | 0.15mi | 2/1.0 | 924 (+7%) | 21mo | $35,000 | $38 | 60 |
| 130 Sheffield Dr | 0.14mi | 2/2.0 | 952 (+10%) | 20mo | $88,000 | $92 | 59 |
| 107 Larchwood Dr | 0.14mi | 2/1.5 | 780 (-10%) | 21mo | $10,000 | $13 | 57 |
Match score weights: distance 35% · size 25% · config 20% · recency 20%. Top-matched comps best support the ARV.
Projected returns pro-forma
-3.0% appreciation · 3.0% rent growth · sell at horizon
- IRR
- -13.6%
- Equity multiple
- 0.51×
- Total profit
- $-18,139
- Equity at exit
- $19,816
- IRR
- -4.8%
- Equity multiple
- 0.69×
- Total profit
- $-11,612
- Equity at exit
- $11,491
Cash invested: $37,212 (down + closing). Projections, not guarantees.
Landlord ↔ Tenant lean methodology
- Overall (STATE)
- 62 Landlord-Friendly
- State Pennsylvania
- 62 Landlord-Friendly · EVEN
- County
- — inherits STATE
- City
- — inherits STATE
ZIP-level market 15626
- Active inventory
- 22
- Price-to-rent
- 10.5×
Monthly cashflow live
- Estimated rent
- $1,057 medium interval (Pro) →
- Mortgage (P&I)
- −$697
- Tax from tax record
- −$28 /mo · $340/yr
- Insurance
- −$55
- HOA
- −$0
- Vacancy / Maint / Mgmt
- −$222
- Net cashflow
- $54
Break-even live
Sensitivity live
| Price | -10% $130 | -5% $92 | +0% $54 | +5% $17 | +10% $-21 |
|---|---|---|---|---|---|
| Rent | -10% $-29 | -5% $13 | +0% $54 | +5% $96 | +10% $138 |
| Rate | -1.0pp $121 | -0.5pp $88 | base $54 | +0.5pp $20 | +1.0pp $-15 |
UW: 25.0% down · 7.5% · 30yr · 1.5% tax · 5.0% vac · 8.0% maint · 8.0% mgmt
Financing live
Cash to close
- Down payment
- $33,225
- Closing costs
- $3,987
- Reserves months
- —
- Total cash needed
- —
Loan-product check · same deal, 3 products live
Conventional
25% down · 7.5% · 30yr
- Down + closing
- —
- Monthly P&I
- —
- Monthly cashflow
- —
- DSCR
- —
- Eligible?
- —
Personal DTI + credit; lowest rate.
DSCR
20% down · 8.5% · 30yr
- Down + closing
- —
- Monthly P&I
- —
- Monthly cashflow
- —
- DSCR
- —
- Eligible?
- —
No personal income docs; deal must DSCR.
Hard money
10% down · 12.0% · 12mo
- Down + closing
- —
- Monthly P&I
- —
- Monthly cashflow
- —
- DSCR
- —
- Eligible?
- —
Short-term bridge; refi at stabilization.
Listing history 1 events
-
2026-05-26$132,900 Active
ⓘ Source: listings_history table (triggers on properties + properties_extension) + one-shot
backfill from property_details.listing_events for pre-trigger history.
Tax reassessment forecast PA · Partial reset (capped growth)
- Current annual tax
- $340 · $28/mo
- Projected year-2 tax
- $1,220 · $102/mo
- Expected delta
- +$880/yr (+$73/mo · 259.0%)
ⓘ Screening estimate from a state-policy table — verify with the county assessor before closing.
Climate risk First Street
- Flood 1/10 Low FEMA zone X (unshaded) · 0% chance over 30 yrs
- Wildfire 1/10 Low
- Heat 3/10 Moderate 7 d/yr ≥96°F today · 19 d/yr by 30 yrs out
- Wind 2/10 Low
- Air quality 3/10 Moderate 3 unhealthy d/yr today · 5 by 30 yrs out
Nearby sold comps map
Loading sold comps map…
Walkable amenities ~0.75 mi
Loading nearby amenities…
Taxation est. · year 1
- Rental income
- $12,684
- − Mortgage interest
- −$7,444
- − Property taxes
- −$340
- − Insurance
- −$664
- − Repairs & maintenance
- −$1,015
- − Management
- −$1,015
- − Depreciation
- −$3,866
- Taxable loss
- −$1,660
- Est. tax savings @ 24.0%
- +$398
- After-tax cash flow
- $1,051/yr
For passive investors: Depreciation is non-cash, so a rental often shows a tax loss while cash-flowing — sheltering income. Rental losses are passive: they offset passive income freely, and up to $25,000/yr can offset ordinary (W-2) income if you actively participate and your MAGI is under $100k (phasing out to $0 by $150k); unused losses carry forward. On sale, claimed depreciation is recaptured at up to 25%, and gains may owe capital-gains tax (a 1031 exchange can defer both). Figures are a year-1 estimate at your 24.0% rate — not tax advice; consult a CPA.
Schools (NCES district)
- District
- Greensburg Salem SD
- NCES district ID
- 4210920
- Math proficiency
- 31% ▼ -21.00%
- Reading proficiency
- 52% ▼ -15.00%
- Median HH income
- $41,295
- Composite
- 34.82/100
- National rank
- #5101
- State rank
- #346 of 539 in PA
Livability — Delmont
- Score
- 72/100
- State rank
- #663
- US rank
- #6485
Category grades
Schools grade is shown separately in the Schools card above.
Census & demographics
- City population
- 5,168
- Population (ZIP)
- 5,168
Population outlook (Westmoreland County) Hauer SSP2
- Today (2025)
- 342,555 people
- By 2030
- 331,717 · -3.2%
- By 2040
- 304,976 · -11.0%
- By 2050
- 277,444 · -19.0%
- By 2075
- 224,607 · -34.4%
- By 2100
- 171,084 · -50.1%
Race, ethnicity, and origin ACS 2023
- Neighborhood character
- Predominantly White (92%)
- Race & ethnicity
- White 92% Two or more races 4% Asian 4%
- Common ancestry
- Romanian 8% Serbian 4% Italian 3%
- Foreign-born
- 3% · China, Canada
- Languages at home
- 94% English-only · Other Indo-European 2% Chinese 2% Other Asian/Pacific 1%
Political lean MEDSL · Westmoreland
- 2024 margin
- Strong R (+28.4) · D 35.4% · R 63.9%
- 2008→2024 swing
- -11.7pp toward R · 2008: -16.7pp · 2024: -28.4pp
- All cycles
- 2024: R+28.4 2020: R+28.3 2016: R+31.3 2012: R+23.7 2008: R+16.7
Not yet ingested
- Civics
- —
Market trends
- HPI YoY
- ▼ -103.96%
- Current HPI
- 179.0345
- Rent YoY
- —
- Metro
- —
- State GDP YoY
- ▲ 1.68%
- F500 in state
- 34
Industry mix (Fortune 500 HQ in PA)
| Industry | F500 HQs | Revenue |
|---|---|---|
| Healthcare | 2 | $309B |
|
||
| Insurance | 2 | $27B |
|
||
| Telecommunications / Media | 1 | $124B |
|
||
| Industrial Distribution | 1 | $22B |
|
||
| Financial Services | 1 | $20B |
|
||
| Chemicals / Materials | 1 | $18B |
|
||
Price history
1 event — show timeline
- 2026-05-26 Listed $132,900 FSBO.com
Property tax history
+1.7%/yrLatest (2025): $340 · +6.9% YoY. Source: county tax records.
Cash-flow waterfall
monthlySold comps — $/sqft
last 12 mo · ≤1 miLoading sold comps…