 🏗️ New Construction
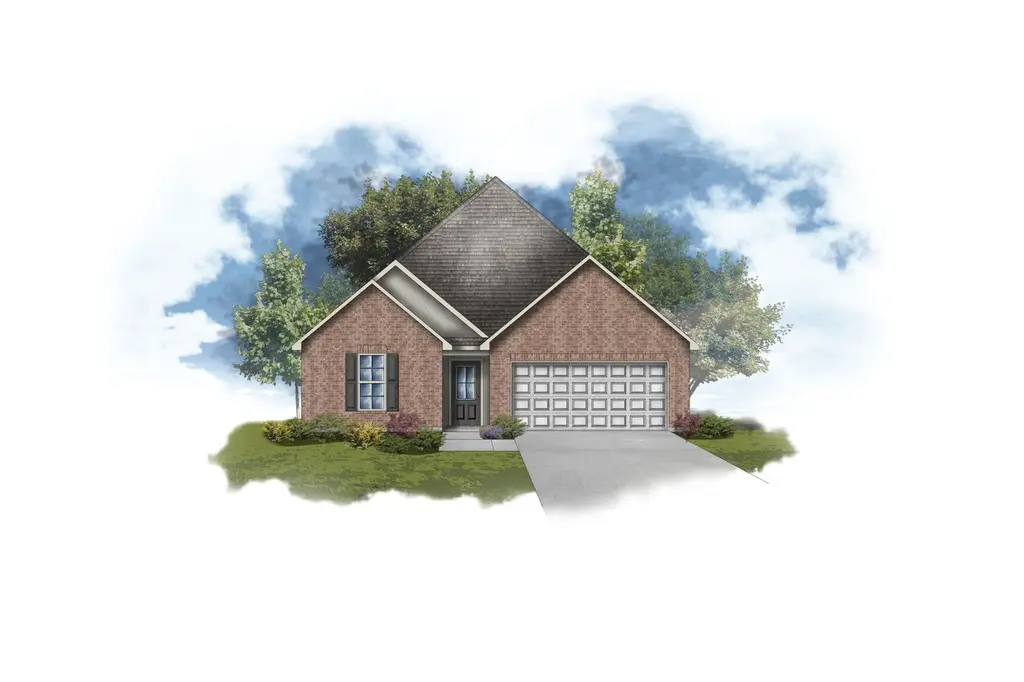
Sorrento V A Plan · Monroe, LA
Flood risk No data
- FEMA flood zone
- —
- Chance of flooding over 30 yrs
- —
- Est. flood insurance / yr
- —
Fire risk No data
- Est. fire insurance / yr
- —
Heat risk No data
- Hot days now (above threshold)
- —
- Hot days in 30 yrs
- —
Wind risk No data
- Chance of severe wind over 30 yrs
- —
Air-quality risk No data
- Unhealthy air days now
- —
- Unhealthy air days in 30 yrs
- —
Risk factors via First Street. Map © Google.
Why this score? — see what drove the D+ grade
The composite is a weighted blend of 9 inputs, each scored 0–100. Each bar is that input's sub-score; the figure is the points it added to the 100-point composite (weight × sub-score).
- Cash flow +19.9/30.0
- ARV discount +7.5/15.0
- DSCR +6.3/10.0
- 1% rule +5.3/10.0
- Livability +3.3/5.0
- Schools +3.2/10.0
- Rent growth +2.5/5.0
- Condition / age +1.0/5.0
- Appreciation +0.0/10.0
$249,990
🖨 Deal sheet (PDF) 📄 Offer letter ✓ Due diligence
Listing remarks MLS
- Open Floor Plan - Three Bedrooms, Two Bathrooms - Two Car Garage - Brick & Stucco Exterior - Covered Patio - Double Master Vanity - Master Garden Tub - Double Master Closets
Key facts
- Open floor plan
- Covered patio
- Master garden tub
Tags
Neighborhood map
What this means for you Summary
Snapshot
- This is a 3-bed/2.0-bath single-family listed at $250k. Condition is rated poor.
Deal economics
- At list price, monthly cash flow is $307 ($4k/yr) — positive.
- The deal already cash-flows at list — no discount required.
- Meets the 1% rule at list price ($3k rent vs $250k).
- Recommended offer: $220k (12.0% below list) — sets the bar for market timing.
- Cap rate 7.7% vs local median 5.7% in Monroe — top-decile yield for the area; either an underpriced asset or a hidden risk that comps aren't pricing in. Stress-test before assuming the spread holds.
Location & tenants
- Location reads 66/100 on livability (#128 in LA) — a middle-class / working-renter tenant base. Strengths: cost of living A+, health & safety A+; Watch: crime F, amenities F, commute F.
- Ouachita Parish (suburban): math 31% / reading 45% proficiency, ranked #26 of 98 in LA (top 26%) — families likely to look elsewhere, expect single-tenant / working-renter base with shorter leases.
- Market conditions: 437 active listings in the ZIP; 3 comparable units currently listed for rent nearby; rentals at typical pace (median 23d on market — plan ~3-4 weeks tenant-placement turnaround); 345 units permitted in Ouachita Parish in 2024 (0 in 5+ unit buildings).
- At $2,606/mo this rent would consume 60% of the median local household income ($52k/yr) (locally 2085% of renters already pay >50% of income on rent) — very limited rent-growth headroom before tenants either downsize or default.
Forward outlook
- Local home prices are declining (-3.0%/yr); year-one equity from $2k of loan paydown is wiped out by about $8k of value loss. Plan a longer hold.
Negotiation context
- It's been on market 391 days — a 12% lower offer ($220k) is reasonable based on typical stale-listing flexibility.
Questions for the listing agent
- It's been on market 391 days. Have you received any prior offers? Is the seller open to a 12% concession, seller financing, or rate buy-down credit?
- Have any recent inspections been done? Can we get a copy of the seller's disclosures and any deferred-maintenance estimates?
- Why hasn't it sold? Are there any deal-killer items the seller is aware of (foundation, flood, title, zoning, code violations)?
- Is there a deadline driving the sale (1031 exchange, divorce, estate, relocation)? That informs how much negotiation room exists.
- Crime grade is F in this area — have there been break-ins, vandalism, or insurance claims at this property in the last 3 years? What carrier currently insures it and at what premium?
- The area grade is low — what's the realistic commute time and amenity access for the typical tenant pool here? Any planned neighborhood developments (good or bad) we should know about?
- What's the average days-on-market for RENTAL listings here right now (not sales)? A rising rental-DOM trend means longer vacancies and softer asking-rent achievability than the comps imply.
- What's the recent tenant-quality profile in this submarket — average credit score on applications, eviction rate, late-payment / NSF rate, and stable-employment percentage? A property-management company in the area should have these aggregated.
- How much new for-sale + rental construction is in the pipeline within 1–3 miles? Heavy new supply typically softens prices + rents 12–24 months out; constrained supply supports both.
Investment metrics
- 1% rule
- 1.03% ✓
- Cap rate
- 7.74%
- Cash-on-cash
- 5.19%
- DSCR
- 1.23
- GRM
- 8.1
CMA / ARV
- ARV (median comp)
- $253,475
- List price
- $249,990
- Delta
- -1.37%
- Verdict
- FAIR
- Comps
- 9 within 1.0 mi
Show comp detail 1 sale within ~0.75 mi
| Address | Dist | Beds/Ba | Sqft | Sold | Price | $/sf | Match |
|---|---|---|---|---|---|---|---|
| 322 Raymond Dr | 0.32mi | 3/2.0 | 1,845 (+10%) | 4mo | $235,000 | $127 | 65 |
Match score weights: distance 35% · size 25% · config 20% · recency 20%. Top-matched comps best support the ARV.
Projected returns pro-forma
-3.0% appreciation · 3.0% rent growth · sell at horizon
- IRR
- -8.2%
- Equity multiple
- 0.70×
- Total profit
- $-21,503
- Equity at exit
- $37,794
- IRR
- 1.3%
- Equity multiple
- 1.09×
- Total profit
- $6,586
- Equity at exit
- $21,916
Cash invested: $70,973 (down + closing). Projections, not guarantees.
Landlord ↔ Tenant lean methodology
- Overall (STATE)
- 90 Strongly Landlord-Friendly
- State Louisiana
- 90 Strongly Landlord-Friendly · R+12
- County
- — inherits STATE
- City
- — inherits STATE
ZIP-level market 71203
- Home prices YoY
- -32.4%
- Active inventory
- 437
- Price-to-rent
- 8.0×
Monthly cashflow live
- Estimated rent
- $2,606 medium interval (Pro) →
- Mortgage (P&I)
- −$1,329
- Tax est. 1.5%
- −$317 /mo · $3,802/yr
- Insurance
- −$106
- HOA
- −$0
- Vacancy / Maint / Mgmt
- −$547
- Net cashflow
- $307
Break-even live
Sensitivity live
| Price | -10% $482 | -5% $394 | +0% $307 | +5% $219 | +10% $131 |
|---|---|---|---|---|---|
| Rent | -10% $101 | -5% $204 | +0% $307 | +5% $410 | +10% $513 |
| Rate | -1.0pp $434 | -0.5pp $371 | base $307 | +0.5pp $241 | +1.0pp $174 |
UW: 25.0% down · 7.5% · 30yr · 1.5% tax · 5.0% vac · 8.0% maint · 8.0% mgmt
Financing live
Cash to close
- Down payment
- $63,369
- Closing costs
- $7,604
- Reserves months
- —
- Total cash needed
- —
Loan-product check · same deal, 3 products live
Conventional
25% down · 7.5% · 30yr
- Down + closing
- —
- Monthly P&I
- —
- Monthly cashflow
- —
- DSCR
- —
- Eligible?
- —
Personal DTI + credit; lowest rate.
DSCR
20% down · 8.5% · 30yr
- Down + closing
- —
- Monthly P&I
- —
- Monthly cashflow
- —
- DSCR
- —
- Eligible?
- —
No personal income docs; deal must DSCR.
Hard money
10% down · 12.0% · 12mo
- Down + closing
- —
- Monthly P&I
- —
- Monthly cashflow
- —
- DSCR
- —
- Eligible?
- —
Short-term bridge; refi at stabilization.
Rent comps 3 comps
| Address | Beds | Baths | Sqft | Rent | $/sqft | DOM | Units | Dist |
|---|---|---|---|---|---|---|---|---|
| 305 Raymond Dr Monroe, LA | 3.0 | 2.0 | 1952 | $3,500 | $1.79 | 22d | 1 | 0.30mi |
| 323 Woodale Dr Monroe, LA | 1.0–2.0 | 1.0–2.5 | 962 | $1,120 | $1.16 | 45d | 8 | 0.85mi |
| 182 Leisure Dr Monroe, LA | 3.0 | 2.0 | 1472 | $2,500 | $1.70 | 22d | 1 | 1.19mi |
Listing history 17 events
-
2026-06-19days on market $249,990 Active 391 DOM
-
2026-06-18days on market $249,990 Active 390 DOM
-
2026-06-17days on market $249,990 Active 389 DOM
-
2026-06-16days on market $249,990 Active 388 DOM
-
2026-06-15days on market $249,990 Active 387 DOM
-
2026-06-14days on market $249,990 Active 385 DOM
-
2026-06-13days on market $249,990 Active 384 DOM
-
2026-06-10days on market $249,990 Active 382 DOM
-
2026-06-09days on market $249,990 Active 381 DOM
-
2026-06-08days on market $249,990 Active 380 DOM
-
2026-06-07days on market $249,990 Active 379 DOM
-
2026-06-03days on market $249,990 Active 375 DOM
-
2026-06-02days on market $249,990 Active 374 DOM
-
2026-06-01days on market $249,990 Active 373 DOM
-
2026-05-31days on market $249,990 Active 372 DOM
-
2026-05-30days on market $249,990 Active 371 DOM
-
2025-05-24$249,990 Active 188-char remark
Show marketing remark (188 chars)
- Open Floor Plan - Three Bedrooms, Two Bathrooms - Two Car Garage - Brick & Stucco Exterior - Covered Patio - Double Master Vanity - Master Garden Tub - Double Master Closets
ⓘ Source: listings_history table (triggers on properties + properties_extension) + one-shot
backfill from property_details.listing_events for pre-trigger history.
Nearby sold comps map
Loading sold comps map…
Walkable amenities ~0.75 mi
Loading nearby amenities…
Taxation est. · year 1
- Rental income
- $31,266
- − Mortgage interest
- −$14,199
- − Property taxes
- −$3,802
- − Insurance
- −$1,267
- − Repairs & maintenance
- −$2,501
- − Management
- −$2,501
- − Depreciation
- −$7,374
- Taxable loss
- −$378
- Est. tax savings @ 24.0%
- +$91
- After-tax cash flow
- $3,771/yr
For passive investors: Depreciation is non-cash, so a rental often shows a tax loss while cash-flowing — sheltering income. Rental losses are passive: they offset passive income freely, and up to $25,000/yr can offset ordinary (W-2) income if you actively participate and your MAGI is under $100k (phasing out to $0 by $150k); unused losses carry forward. On sale, claimed depreciation is recaptured at up to 25%, and gains may owe capital-gains tax (a 1031 exchange can defer both). Figures are a year-1 estimate at your 24.0% rate — not tax advice; consult a CPA.
Condition & rehab AI · 2 photos
This home requires extensive repairs and renovations to bring it up to a livable condition. The exterior, interior, and mechanical systems are in poor condition and need significant work.
Repairs flagged
- Major exterior siding — The exterior siding is visibly damaged and needs replacement.
- Major roof — The roof is visibly damaged and needs replacement.
- Major flooring — The flooring is visibly damaged and needs replacement.
- Major interior walls/paint — The interior walls and paint are visibly damaged and need repainting.
- Major bathrooms — The bathrooms are visibly damaged and need renovation.
- Major kitchen — The kitchen is visibly damaged and needs renovation.
- Major HVAC/mechanicals — The HVAC/mechanicals are visibly damaged and need replacement.
- Major landscaping — The landscaping is visibly damaged and needs renovation.
Value-add opportunities
- Both exterior siding replacement — A new exterior siding will improve the home's curb appeal and increase its value.
- Both roof replacement — A new roof will improve the home's structural integrity and increase its value.
- Both flooring replacement — New flooring will improve the home's appearance and increase its value.
- Both interior painting — New paint will improve the home's appearance and increase its value.
- Both bathroom renovation — A new bathroom will improve the home's functionality and increase its value.
- Both kitchen renovation — A new kitchen will improve the home's functionality and increase its value.
- Both HVAC/mechanical replacement — A new HVAC system will improve the home's comfort and increase its value.
- Both landscaping renovation — A new landscaping will improve the home's curb appeal and increase its value.
Renovation cost estimate screening
| Repair item | Severity | Est. cost |
|---|---|---|
| exterior siding · The exterior siding is visibly damaged and needs replacement. | Major | $15,000–50,000 |
| roof · The roof is visibly damaged and needs replacement. | Major | $15,000–50,000 |
| flooring · The flooring is visibly damaged and needs replacement. | Major | $15,000–50,000 |
| interior walls/paint · The interior walls and paint are visibly damaged and need repainting. | Major | $15,000–50,000 |
| bathrooms · The bathrooms are visibly damaged and need renovation. | Major | $15,000–50,000 |
| kitchen · The kitchen is visibly damaged and needs renovation. | Major | $15,000–50,000 |
| HVAC/mechanicals · The HVAC/mechanicals are visibly damaged and need replacement. | Major | $15,000–50,000 |
| landscaping · The landscaping is visibly damaged and needs renovation. | Major | $15,000–50,000 |
| Total estimated repair cost · 8 items | $120,000–400,000 |
Value-add ROI direction
- Both exterior siding replacement — A new exterior siding will improve the home's curb appeal and increase its value. ↑
- Both roof replacement — A new roof will improve the home's structural integrity and increase its value. ↑
- Both flooring replacement — New flooring will improve the home's appearance and increase its value. ↑
- Both interior painting — New paint will improve the home's appearance and increase its value. ↑
- Both bathroom renovation — A new bathroom will improve the home's functionality and increase its value. ↑
- Both kitchen renovation — A new kitchen will improve the home's functionality and increase its value. ↑
- Both HVAC/mechanical replacement — A new HVAC system will improve the home's comfort and increase its value. ↑
- Both landscaping renovation — A new landscaping will improve the home's curb appeal and increase its value. ↑
ⓘ Cost ranges are severity-bucket heuristics (US national rule-of-thumb). Get contractor quotes + a written scope before underwriting a rehab budget.
Schools (NCES district)
- District
- Ouachita Parish
- NCES district ID
- 2201200
- Math proficiency
- 31% ▼ -38.00%
- Reading proficiency
- 45% ▼ -31.00%
- Median HH income
- $43,316
- Composite
- 32.14/100
- National rank
- #5791
- State rank
- #26 of 98 in LA
Livability — Monroe
- Score
- 66/100
- State rank
- #128
- US rank
- #11948
Category grades
Schools grade is shown separately in the Schools card above.
Census & demographics
- County
- Ouachita Parish · 118,340 people
- City population
- 60,136
- Metro
- Monroe, LA
- Population (ZIP)
- 38,354
- Household income
- $52,326
- Rent vs Own
- Severe rent burden
- 2085.0
Population outlook (Ouachita County) Hauer SSP2
- Today (2025)
- 163,370 people
- By 2030
- 165,520 · +1.3%
- By 2040
- 167,652 · +2.6%
- By 2050
- 166,699 · +2.0%
- By 2075
- 156,348 · -4.3%
- By 2100
- 134,102 · -17.9%
Race, ethnicity, and origin ACS 2023
- Neighborhood character
- Diverse neighborhood (Simpson 0.57)
- Race & ethnicity
- Black 48% White 45% Two or more races 4% Hispanic / Latino 3% Asian 1%
- Common ancestry
- Lithuanian 3% Slovak 1% Serbian 1%
- Foreign-born
- 3% · Canada
- Languages at home
- 96% English-only · Spanish 2% Other Indo-European 1%
Political lean MEDSL · Ouachita
- 2024 margin
- Strong R (+27.9) · D 35.5% · R 63.3% · Other 1.2%
- 2008→2024 swing
- -2.7pp toward R · 2008: -25.2pp · 2024: -27.9pp
- All cycles
- 2024: R+27.9 2020: R+23.6 2016: R+25.4 2012: R+20.9 2008: R+25.2
Not yet ingested
- Civics
- —
Market trends
- HPI YoY
- ▼ -99.01%
- Current HPI
- 206.1948
- Rent YoY
- —
- Metro
- Monroe, LA
- State GDP YoY
- ▲ 3.29%
- F500 in state
- 10
Industry mix (Fortune 500 HQ in LA)
| Industry | F500 HQs | Revenue |
|---|---|---|
| Telecommunications | 2 | $23B |
|
||
| Utilities | 1 | $12B |
|
||
| Wholesale / Distribution | 1 | $5B |
|
||
| Advertising | 1 | $2B |
|
||
Price history
1 event — show timeline
- 2025-05-24 Listed $249,990 Zillow
Cash-flow waterfall
monthlySold comps — $/sqft
last 12 mo · ≤1 miLoading sold comps…