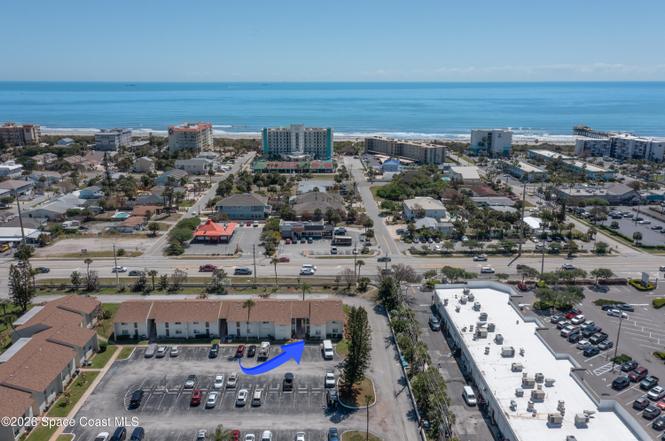
5801 N Atlantic Ave #211 · Cape Canaveral, FL
Flood risk 5/10 · Moderate
- FEMA flood zone
- X (unshaded)
- Chance of flooding over 30 yrs
- 0.43%
- Est. flood insurance / yr
- $507 – $1,088
Fire risk 1/10 · Minimal
- Est. fire insurance / yr
- $947 – $1,759
Heat risk 10/10 · Severe
- Hot days now (above 105°F)
- 7 days/yr
- Hot days in 30 yrs
- 25 days/yr
Wind risk 10/10 · Severe
- Chance of severe wind over 30 yrs
- 99.0%
Air-quality risk 1/10 · Minimal
- Unhealthy air days now
- 0 days/yr
- Unhealthy air days in 30 yrs
- 0 days/yr
Risk factors via First Street. Map © Google.
Why this score? — see what drove the D+ grade
The composite is a weighted blend of 9 inputs, each scored 0–100. Each bar is that input's sub-score; the figure is the points it added to the 100-point composite (weight × sub-score).
- Cash flow +15.8/30.0
- ARV discount +7.5/15.0
- 1% rule +6.8/10.0
- DSCR +4.9/10.0
- Schools +4.7/10.0
- Livability +4.2/5.0
- Rent growth +3.5/5.0
- Condition / age +2.5/5.0
- Appreciation +0.0/10.0
$215,000
🖨 Deal sheet (PDF) 📄 Offer letter ✓ Due diligence
Listing remarks
Immerse yourself in the ultimate ''affordable beach lifestyle'' with this fully furnished 3 BR, 2 BA, first-floor condo located in the desirable Hidden Harbor Condominiums in Cape Canaveral. This unit offers first floor convenience, and is located just two blocks from the beach (Atlantic Ocean). The property includes assigned parking which is directly in front of the unit, along with convenient guest parking. Cornerstone Plaza (Publix, Restaurants and Retail Services) is located next door, providing convenience for everyday essentials. The community recently installed new roofs in 2024 and freshly painted the buildings. This unit features an updated HVAC system (2025) with transferable wa
Key facts
- Guest parking
- Beachside location
- New roofs
Tags
Property features AI
Finance
- Other: Unit is furnished
- HOA & community: Community association (monthly fee); Association fee: $614 per month; Association covers cable TV, internet, insurance, maintenance of grounds and structure, pest control, sewer, trash, and water; Community amenities include clubhouse, car wash area, tennis courts, pickleball, management off-site, and trash service
Exterior
- Parking: Additional parking available; Assigned parking
- Utilities: Public sewer; Water connected; Sewer connected; Electricity connected; Cable available
- Home design: Condominium; 2-story building; Entry level: 1; Property faces north; One level in unit layout
- Construction: Block and stucco construction; Shingle roof; Pets allowed (cats and dogs)
- Exterior features: Storm shutters; Covered front porch; Glass-enclosed porch; Porch; Tennis court(s) on property
Interior
- Kitchen: Dishwasher; Electric range; Microwave; Refrigerator; Electric water heater
- Bedrooms: 3 bedrooms
- Flooring: Carpet; Tile
- Bathrooms: 2 full bathrooms
- Heating & cooling: Central heating (electric); Central air conditioning (electric)
- Interior features: Breakfast nook; Ceiling fan(s); Kitchen island; Primary bathroom with tub/shower; Primary bedroom on main floor
- Laundry & utility: In-unit laundry; Washer hookup; Electric dryer hookup
Neighborhood map
What this means for you Summary
Snapshot
- This is a 3-bed/2.0-bath condo listed at $215k.
Deal economics
- At list price, monthly cash flow is $97 ($1k/yr) — positive.
- The deal already cash-flows at list — no discount required.
- Meets the 1% rule at list price ($3k rent vs $215k).
- Recommended offer: $209k (3.0% below list) — sets the bar for market timing.
Location & tenants
- Location reads 84/100 on livability (#34 in FL, #677 nationally) — a professional / high-income tenant draw. Strengths: crime A+, commute A+, housing A+; Watch: amenities F.
- Brevard (suburban): math 53% / reading 57% proficiency, ranked #19 of 73 in FL (top 26%) — acceptable for families but not a draw, mixed tenant base, ~2y average lease.
- Zoned schools: Cape View Elementary School (math 62% / reading 62%, grade B, #608 of 2,144 statewide, top 29%, 305 students, 61% FRL); Cocoa Beach Junior/Senior High School (math 65% / reading 66%, grade B, #75 of 667 statewide, top 11%, 982 students, 30% FRL) — zoned schools at 45% FRL track the district average.
- Market conditions: Rents rising fast (+4.0%/yr); 221 active listings in the ZIP; 40 comparable units currently listed for rent nearby; rentals at typical pace (median 26d on market — plan ~3-4 weeks tenant-placement turnaround); 4,602 units permitted in Brevard County in 2024 (702 in 5+ unit buildings).
- At $2,532/mo this rent would consume 45% of the median local household income ($67k/yr) (locally 477% of renters already pay >50% of income on rent) — very limited rent-growth headroom before tenants either downsize or default.
Forward outlook
- Local home prices are declining (-3.0%/yr); year-one equity from $1k of loan paydown is wiped out by about $6k of value loss. Plan a longer hold.
- Brevard County population projected at +15% by 2050 — modest demand growth; plan on rents tracking national, not racing it.
Negotiation context
- It's been on market 54 days — a 3% lower offer ($209k) is reasonable based on typical stale-listing flexibility.
- Current owner paid $66k; list at $215k implies a 226% gain — meaningful room to come down on a strong offer.
Risks & watch-outs
- Watch-outs: HOA is 24% of rent.
- Climate carrying-cost: moderate flood risk; severe wind risk, 99% chance of damaging wind over 30y; extreme-heat days projected 7→25/yr by 2055 (HVAC capex compounding) — expect insurance premiums to compound above CPI over the hold.
Questions for the listing agent
- It's been on market 54 days. Have you received any prior offers? Is the seller open to a 3% concession, seller financing, or rate buy-down credit?
- Built in 1974 — when were the roof, HVAC, electrical panel, plumbing, and water heater last replaced?
- What does the HOA fee cover, when was the last increase, and are there any pending special assessments or reserve-fund shortfalls?
- Any open or pending special assessments — roof, HVAC, plumbing, elevator, façade? What's the per-unit balance and payoff schedule, and is the seller paying it off at close or rolling it to the buyer?
- Is there a deadline driving the sale (1031 exchange, divorce, estate, relocation)? That informs how much negotiation room exists.
- Schools are B-rated — typically a magnet for longer-tenancy family renters. What's the average tenant stay here, and is there a school-zone premium baked into asking?
- The area grade is low — what's the realistic commute time and amenity access for the typical tenant pool here? Any planned neighborhood developments (good or bad) we should know about?
- What's the average days-on-market for RENTAL listings here right now (not sales)? A rising rental-DOM trend means longer vacancies and softer asking-rent achievability than the comps imply.
- What's the recent tenant-quality profile in this submarket — average credit score on applications, eviction rate, late-payment / NSF rate, and stable-employment percentage? A property-management company in the area should have these aggregated.
- How much new apartment / multifamily construction is in the pipeline within 1–3 miles? Heavy new supply (>2% of stock underway) typically softens rents 12–24 months out; light construction supports rent growth.
Investment metrics
- 1% rule
- 1.18% ✓
- Cap rate
- 6.84%
- Cash-on-cash
- 1.94%
- DSCR
- 1.09
- GRM
- 7.1
CMA / ARV
No comps found within radius.
Projected returns pro-forma
-3.0% appreciation · 4.02% rent growth · sell at horizon
- IRR
- -11.6%
- Equity multiple
- 0.57×
- Total profit
- $-25,732
- Equity at exit
- $32,057
- IRR
- -0.5%
- Equity multiple
- 0.96×
- Total profit
- $-2,245
- Equity at exit
- $18,589
Cash invested: $60,200 (down + closing). Projections, not guarantees.
Landlord ↔ Tenant lean methodology
- Overall (STATE)
- 87 Strongly Landlord-Friendly
- State Florida
- 87 Strongly Landlord-Friendly · R+3
- County
- — inherits STATE
- City
- — inherits STATE
ZIP-level market 32920
- Home prices YoY
- -29.5%
- Rents YoY
- 4.0%
- Active inventory
- 221
- Price-to-rent
- 7.1×
Monthly cashflow live
- Estimated rent
- $2,532 high interval (Pro) →
- Mortgage (P&I)
- −$1,127
- Tax from tax record
- −$72 /mo · $867/yr
- Insurance
- −$90
- HOA
- −$614
- Vacancy / Maint / Mgmt
- −$532
- Net cashflow
- $97
Break-even live
Sensitivity live
| Price | -10% $219 | -5% $158 | +0% $97 | +5% $36 | +10% $-25 |
|---|---|---|---|---|---|
| Rent | -10% $-103 | -5% $-3 | +0% $97 | +5% $197 | +10% $297 |
| Rate | -1.0pp $205 | -0.5pp $152 | base $97 | +0.5pp $41 | +1.0pp $-15 |
UW: 25.0% down · 7.5% · 30yr · 1.5% tax · 5.0% vac · 8.0% maint · 8.0% mgmt
Financing live
Cash to close
- Down payment
- $53,750
- Closing costs
- $6,450
- Reserves months
- —
- Total cash needed
- —
Loan-product check · same deal, 3 products live
Conventional
25% down · 7.5% · 30yr
- Down + closing
- —
- Monthly P&I
- —
- Monthly cashflow
- —
- DSCR
- —
- Eligible?
- —
Personal DTI + credit; lowest rate.
DSCR
20% down · 8.5% · 30yr
- Down + closing
- —
- Monthly P&I
- —
- Monthly cashflow
- —
- DSCR
- —
- Eligible?
- —
No personal income docs; deal must DSCR.
Hard money
10% down · 12.0% · 12mo
- Down + closing
- —
- Monthly P&I
- —
- Monthly cashflow
- —
- DSCR
- —
- Eligible?
- —
Short-term bridge; refi at stabilization.
Rent comps 40 comps
| Address | Beds | Baths | Sqft | Rent | $/sqft | DOM | Units | Dist |
|---|---|---|---|---|---|---|---|---|
| 5800 N Banana River Blvd #123 Cape Canaveral, FL | 2.0 | 2.0 | 1116 | $1,825 | $1.64 | 25d | 1 | 0.10mi |
| 5640 N Banana River Blvd Unit 1546449P Cocoa Beach, FL | 2.0 | 2.0 | 1140 | $4,032 | $3.54 | 16d | 1 | 0.12mi |
| 304 Wilson Ave Cocoa Beach, FL | 2.0 | 2.0 | 1300 | $2,945 | $2.27 | 16d | 1 | 0.25mi |
| 5350 Ocean Beach Blvd #103 Cocoa Beach, FL | 2.0 | 2.0 | 1081 | $1,450 | $1.34 | 25d | 1 | 0.37mi |
| 230 Cape Shores Cir Unit 17G Cape Canaveral, FL | 2.0 | 2.0 | 1034 | $1,950 | $1.89 | 21d | 1 | 0.41mi |
| 220 Cape Shores Cir Unit 12B Cape Canaveral, FL | 2.0 | 2.0 | 1034 | $1,650 | $1.60 | 16d | 1 | 0.43mi |
| 5050 Ocean Beach Blvd #104 Cocoa Beach, FL | 2.0 | 2.0 | 1346 | $3,600 | $2.67 | 25d | 1 | 0.47mi |
| 6601 Shuttle Way Unit 10E Cape Canaveral, FL | 2.0 | 2.0 | 1450 | $1,900 | $1.31 | 16d | 1 | 0.47mi |
| 545 Garfield Ave Unit 1 Cocoa Beach, FL | 3.0 | 2.0 | 1500 | $2,850 | $1.90 | 16d | 1 | 0.53mi |
| 4850 Ocean Beach Blvd Cocoa Beach, FL | 2.0–3.0 | 2.0 | 1506 | $5,200 | $3.45 | 25d | 2 | 0.55mi |
| 4800 Ocean Beach Blvd Cocoa Beach, FL | 2.0–3.0 | 2.0 | 1186 | $2,900 | $2.45 | 25d | 2 | 0.57mi |
| 316 Dorset Dr Cocoa Beach, FL | 3.0 | 2.0 | 1771 | $4,100 | $2.32 | 16d | 1 | 0.60mi |
| 4700 Ocean Beach Blvd Cocoa Beach, FL | 2.0 | 2.0 | 1018 | $2,100 | $2.06 | 25d | 2 | 0.64mi |
| 119 W Suwannee Ln Unit 1069199P Cocoa Beach, FL | 3.0 | 2.0 | 1410 | $6,761 | $4.80 | 16d | 1 | 0.75mi |
| 4570 Ocean Beach Blvd #106 Cocoa Beach, FL | 3.0 | 2.0 | 1430 | $2,800 | $1.96 | 16d | 1 | 0.79mi |
| 206 Pierce Ave Cape Canaveral, FL | 2.0 | 1.0 | 1000 | $2,000 | $2.00 | 16d | 1 | 0.81mi |
| 7101 Ridgewood Ave #203 Cape Canaveral, FL | 2.0 | 1.5 | 1110 | $1,900 | $1.71 | 25d | 1 | 0.82mi |
| 328 Pierce Ave Cape Canaveral, FL | 2.0 | 2.0 | 1800 | $2,000 | $1.11 | 25d | 1 | 0.84mi |
| 326 Pierce Ave Cape Canaveral, FL | 2.0 | 2.0 | 1200 | $2,000 | $1.67 | 25d | 1 | 0.87mi |
| 500 Fillmore Ave Unit 1320142P Cape Canaveral, FL | 2.0 | 2.0 | 968 | $4,115 | $4.25 | 23d | 1 | 0.93mi |
| 555 Fillmore Ave Unit 1346828P Cape Canaveral, FL | 2.0 | 2.0 | 1194 | $7,455 | $6.24 | 21d | 1 | 0.94mi |
| 7301 Ridgewood Ave Unit A101 Cape Canaveral, FL | 2.0 | 2.0 | 1045 | $1,900 | $1.82 | 25d | 1 | 0.94mi |
| 310 Taylor Ave Unit C19 Cape Canaveral, FL | 2.0 | 1.0 | 921 | $1,525 | $1.66 | 16d | 1 | 0.95mi |
| 310 Taylor Ave Cape Canaveral, FL | 1.0–2.0 | 1.0 | 820 | $1,600 | $1.95 | 25d | 3 | 0.95mi |
| 504 Fillmore Ave Unit A11 Cape Canaveral, FL | 3.0 | 2.0 | 1375 | $3,200 | $2.33 | 16d | 1 | 0.96mi |
| 375 Polk Ave Unit A18 Cape Canaveral, FL | 2.0 | 1.0 | 921 | $1,700 | $1.85 | 25d | 1 | 0.99mi |
| 4105 Ocean Beach Blvd #121 Cocoa Beach, FL | 2.0 | 2.0 | 1101 | $2,000 | $1.82 | 25d | 1 | 1.07mi |
| 4100 Ocean Beach Blvd #406 Cocoa Beach, FL | 2.0 | 2.0 | 1101 | $2,500 | $2.27 | 25d | 1 | 1.09mi |
| 4100 Ocean Beach Blvd #307 Cocoa Beach, FL | 2.0 | 2.0 | 1101 | $2,450 | $2.23 | 25d | 1 | 1.09mi |
| 201 International Dr #653 Cape Canaveral, FL | 2.0 | 2.0 | 1050 | $2,400 | $2.29 | 25d | 1 | 1.12mi |
| 415 Harrison Ave #4 Cape Canaveral, FL | 2.0 | 1.0 | 900 | $1,300 | $1.44 | 25d | 1 | 1.12mi |
| 3833 S Banana River Blvd Unit 1 Cocoa Beach, FL | 3.0 | 2.0 | 1344 | $2,800 | $2.08 | 25d | 1 | 1.13mi |
| 4000 Ocean Beach Blvd Unit 2C Cocoa Beach, FL | 2.0 | 2.0 | 1250 | $2,800 | $2.24 | 25d | 1 | 1.14mi |
| 7777 Magnolia Ave Unit 8 Cape Canaveral, FL | 2.0 | 1.0 | 891 | $1,800 | $2.02 | 25d | 1 | 1.16mi |
| 555 Harrison Ave #402 Cape Canaveral, FL | 2.0 | 2.0 | 1409 | $3,000 | $2.13 | 25d | 1 | 1.16mi |
| 249 Palm Ln Cocoa Beach, FL | 3.0 | 2.0 | 1152 | $3,100 | $2.69 | 16d | 1 | 1.18mi |
| 3799 S Banana River Blvd #926 Cocoa Beach, FL | 2.0 | 2.0 | 1316 | $2,400 | $1.82 | 25d | 1 | 1.19mi |
| 3799 S Banana River Blvd #505 Cocoa Beach, FL | 2.0 | 2.0 | 1058 | $1,950 | $1.84 | 25d | 1 | 1.19mi |
| 3799 S Banana River Blvd #922 Cocoa Beach, FL | 2.0 | 2.0 | 1316 | $2,550 | $1.94 | 25d | 1 | 1.19mi |
| 3799 S Banana River Blvd #1001 Cocoa Beach, FL | 2.0 | 2.0 | 1316 | $2,195 | $1.67 | 16d | 1 | 1.19mi |
HOA detail condo
- Monthly dues
- $614 · $7,368/yr
- Likely covers
- parking
- Assessments
- None detected in remarks — confirm with the listing agent.
Listing history 15 events
-
2026-06-15status $215,000 Pending 54 DOM
-
2026-06-15days on market $215,000 Active Under Contract 54 DOM
-
2026-06-14days on market $215,000 Active Under Contract 52 DOM
-
2026-06-10days on market $215,000 Active Under Contract 49 DOM
-
2026-06-08days on market $215,000 Active Under Contract 47 DOM
-
2026-06-07days on market $215,000 Active Under Contract 46 DOM
-
2026-06-05days on market $215,000 Active Under Contract 43 DOM
-
2026-06-03days on market $215,000 Active Under Contract 42 DOM
-
2026-06-02days on market $215,000 Active Under Contract 41 DOM
-
2026-06-01days on market $215,000 Active Under Contract 40 DOM
-
2026-05-31days on market $215,000 Active Under Contract 39 DOM
-
2026-05-31days on market $215,000 Active Under Contract 38 DOM
-
2026-04-22$215,000 Active
-
1987-09-01soldstatus $66,000
-
1976-12-01soldstatus $22,000
ⓘ Source: listings_history table (triggers on properties + properties_extension) + one-shot
backfill from property_details.listing_events for pre-trigger history.
Tax reassessment forecast FL · Resets to sale price
- Current annual tax
- $867 · $72/mo
- Projected year-2 tax
- $1,784 · $149/mo
- Expected delta
- +$918/yr (+$76/mo · 105.8%)
ⓘ Screening estimate from a state-policy table — verify with the county assessor before closing.
Climate risk First Street
- Flood 5/10 Major FEMA zone X (unshaded) · 43% chance over 30 yrs
- Wildfire 1/10 Low
- Heat 10/10 Extreme 7 d/yr ≥105°F today · 25 d/yr by 30 yrs out
- Wind 10/10 Extreme 99% chance of damaging wind over 30 yrs
- Air quality 1/10 Low 0 unhealthy d/yr today · 0 by 30 yrs out
Nearby sold comps map
Loading sold comps map…
Walkable amenities ~0.75 mi
Loading nearby amenities…
Taxation est. · year 1
- Rental income
- $30,387
- − Mortgage interest
- −$12,043
- − Property taxes
- −$867
- − Insurance
- −$1,075
- − Repairs & maintenance
- −$2,431
- − Management
- −$2,431
- − HOA
- −$7,368
- − Depreciation
- −$6,255
- Taxable loss
- −$2,083
- Est. tax savings @ 24.0%
- +$500
- After-tax cash flow
- $1,666/yr
For passive investors: Depreciation is non-cash, so a rental often shows a tax loss while cash-flowing — sheltering income. Rental losses are passive: they offset passive income freely, and up to $25,000/yr can offset ordinary (W-2) income if you actively participate and your MAGI is under $100k (phasing out to $0 by $150k); unused losses carry forward. On sale, claimed depreciation is recaptured at up to 25%, and gains may owe capital-gains tax (a 1031 exchange can defer both). Figures are a year-1 estimate at your 24.0% rate — not tax advice; consult a CPA.
Schools (NCES district)
- District
- Brevard
- NCES district ID
- 1200150
- Math proficiency
- 53% ▼ -9.00%
- Reading proficiency
- 57% ▼ -4.00%
- Median HH income
- $49,426
- Composite
- 46.86/100
- National rank
- #2370
- State rank
- #19 of 73 in FL
Livability — Cape Canaveral
- Score
- 84/100
- State rank
- #34
- US rank
- #677
Category grades
Schools grade is shown separately in the Schools card above.
Census & demographics
- Census place
- Cape Canaveral, FL
- County
- Brevard County · 602,871 people
- City population
- 10,005
- Metro
- Palm Bay-Melbourne-Titusville, FL
- Population (ZIP)
- 10,005
- Household income
- $66,955
- Rent vs Own
- Severe rent burden
- 477.0
Population outlook (Brevard County) Hauer SSP2
- Today (2025)
- 623,254 people
- By 2030
- 648,420 · +4.0%
- By 2040
- 690,009 · +10.7%
- By 2050
- 715,669 · +14.8%
- By 2075
- 775,744 · +24.5%
- By 2100
- 776,687 · +24.6%
Race, ethnicity, and origin ACS 2023
- Neighborhood character
- Predominantly White (86%)
- Race & ethnicity
- White 86% Hispanic / Latino 9% Two or more races 4%
- Hispanic origin (detail)
- Mexican 1% Puerto Rican 6%
- Common ancestry
- Romanian 5% Lithuanian 5% Serbian 2%
- Foreign-born
- 6% · Canada
- Languages at home
- 93% English-only · Spanish 4% Russian/Polish/Slavic 1% German/W. Germanic 1%
Political lean MEDSL · Brevard
- 2024 margin
- Strong R (+20.8) · D 39.1% · R 59.9% · Other 1.0%
- 2008→2024 swing
- -10.4pp toward R · 2008: -10.4pp · 2024: -20.8pp
- All cycles
- 2024: R+20.8 2020: R+16.4 2016: R+19.8 2012: R+12.7 2008: R+10.4
Not yet ingested
- Civics
- —
Market trends
- HPI YoY
- ▼ -125.71%
- Current HPI
- 300.9707
- Rent YoY
- ▲ 4.02%
- Metro
- Palm Bay-Melbourne-Titusville, FL
- State GDP YoY
- ▲ 3.28%
- F500 in state
- 36
Industry mix (Fortune 500 HQ in FL)
| Industry | F500 HQs | Revenue |
|---|---|---|
| Industrial Technology | 2 | $29B |
|
||
| Insurance | 2 | $17B |
|
||
| Retail | 1 | $60B |
|
||
| Technology Distribution | 1 | $58B |
|
||
| Homebuilding | 1 | $35B |
|
||
| Technology Manufacturing | 1 | $35B |
|
||
Price history
+877.3% since first listed3 events — show timeline
- 2026-04-22 Listed $215,000 SCMLS
- 1987-09-01 Sold (Public Records) $66,000 Public Records
- 1976-12-01 Sold (Public Records) $22,000 Public Records
Property tax history
-5.0%/yrLatest (2025): $867 · +3.2% YoY. Source: county tax records.
Cash-flow waterfall
monthlySold comps — $/sqft
last 12 mo · ≤1 miLoading sold comps…