3300 Binnacle Dr #205 · Naples, FL
Flood risk 5/10 · Moderate
- FEMA flood zone
- X (unshaded)
- Chance of flooding over 30 yrs
- 0.45%
- Est. flood insurance / yr
- $507 – $1,088
Fire risk 1/10 · Minimal
- Est. fire insurance / yr
- $947 – $1,759
Heat risk 10/10 · Severe
- Hot days now (above 107°F)
- 7 days/yr
- Hot days in 30 yrs
- 28 days/yr
Wind risk 10/10 · Severe
- Chance of severe wind over 30 yrs
- 99.0%
Air-quality risk 2/10 · Minimal
- Unhealthy air days now
- 2 days/yr
- Unhealthy air days in 30 yrs
- 2 days/yr
Risk factors via First Street. Map © Google.
Why this score? — see what drove the C- grade
The composite is a weighted blend of 9 inputs, each scored 0–100. Each bar is that input's sub-score; the figure is the points it added to the 100-point composite (weight × sub-score).
- Cash flow +17.2/30.0
- ARV discount +7.5/15.0
- 1% rule +6.5/10.0
- DSCR +5.3/10.0
- Rent growth +5.0/5.0
- Schools +5.0/10.0
- Livability +4.0/5.0
- Condition / age +2.5/5.0
- Appreciation +0.0/10.0
$449,000
🖨 Deal sheet 📄 Offer letter ✓ Due diligence
Listing remarks
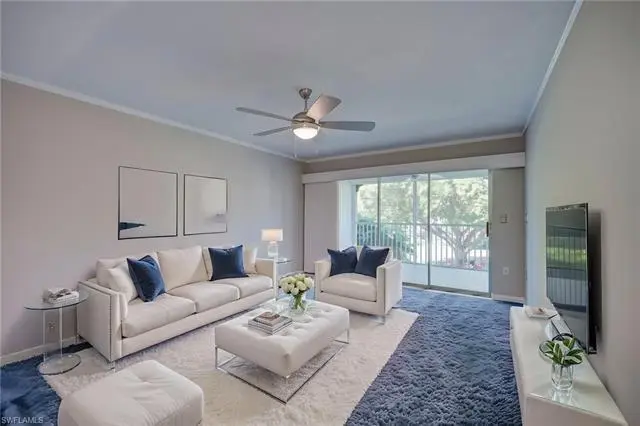
One or more photo(s) has been virtually staged, AI generated or rendered. Discover coastal perfection in this bright and inviting 2-bedroom, 2-bathroom condo located in the highly sought-after Moorings neighborhood. Just a short stroll or quick bike ride from Moorings Private Beach Park, this residence offers convenient access to sugar-sand shores and breathtaking Gulf of America sunsets. Step inside to an open, light-filled layout perfect for relaxed Florida living. The spacious living, dining, and kitchen areas flow seamlessly, while the brand-new hurricane windows and the power hurricane shutters frame beautiful views of tropical landscaping and sunsets while providing superior storm pro
Key facts
- Hurricane windows
- Sugar-sand shores
- Tropical landscaping
Tags
Property features AI
Finance
- Other: Condo documents / Property appraiser used for lot measurements; Deeded restrictions
- Financial info: Total annual recurring HOA fees reported
- HOA & community: Mandatory HOA; Quarterly master HOA fee; Master amenities include beach club access, bike storage, extra storage, and internet access; On-site management; HOA covers irrigation water and lawn/land maintenance; Non-gated community
Exterior
- Parking: 1 assigned parking space; Guest parking available; Detached 1-car carport
- Security: Impact resistant windows; Electric shutters; Impact resistant window storm protection
- Utilities: Central water; Central sewer; Electric service (central)
- Home design: Residential property in The Moorings (BinNacle sub-condo); Low-rise building (1–3 stories); 2-story end unit; Rear exposure facing east
- Construction: Concrete block construction; Stucco and wood siding exterior finish; Shingle roof; Built in 1982
- Exterior features: Courtyard; Below-ground private pool; Zero lot line; Landscaped area view; Irrigation (central)
Interior
- Kitchen: Cooktop (electric); Range / Self-cleaning oven; Dishwasher; Disposal; Microwave; Refrigerator/ice maker; Pantry
- Bedrooms: 2 bedrooms; 3 ceiling fans (total in unit)
- Flooring: Carpet
- Bathrooms: 2 full bathrooms; Master bath with dual sinks
- Heating & cooling: Central electric heat; Central electric air conditioning; Ceiling fans
- Interior features: Built-in cabinets; Cable prewire / Cable available; Closet cabinets; High-speed internet available; Smoke detectors; Pantry; Breakfast bar and eat-in kitchen / Dining (family); Family room; Screened balcony and screened lanai/porch; Storage
- Laundry & utility: Washer and dryer present; Washer/dryer hookup; Laundry in residence
Neighborhood map
What this means for you Summary
Snapshot
- This is a 2-bed/2.0-bath condo listed at $449k.
Deal economics
- At list price, monthly cash flow is $317 ($4k/yr) — positive.
- The deal already cash-flows at list — no discount required.
- Meets the 1% rule at list price ($5k rent vs $449k).
- Recommended offer: $422k (6.0% below list) — sets the bar for market timing.
Location & tenants
- Location reads 80/100 on livability (#126 in FL, #1,903 nationally) — a professional / high-income tenant draw. Strengths: crime A+, amenities A+, employment A+; Watch: commute D+, cost of living F.
- Collier (suburban): math 60% / reading 56% proficiency, ranked #16 of 73 in FL (top 22%) — acceptable for families but not a draw, mixed tenant base, ~2y average lease.
- Zoned schools: Naples High School (math 47% / reading 52%, grade D, #179 of 667 statewide, top 29%, 1,719 students, 39% FRL) — zoned schools average 39% FRL vs 55% district-wide (16 pts lower); this property's tenant base skews higher-income than the district average.
- Market conditions: Rents rising fast (+14.6%/yr); 479 active listings in the ZIP; 40 comparable units currently listed for rent nearby; rentals at typical pace (median 23d on market — plan ~3-4 weeks tenant-placement turnaround); high-income renter base; 3,520 units permitted in Collier County in 2024 (959 in 5+ unit buildings).
- At $5,176/mo this rent would consume 53% of the median local household income ($117k/yr) (locally 311% of renters already pay >50% of income on rent) — very limited rent-growth headroom before tenants either downsize or default.
Forward outlook
- Local home prices are declining (-3.0%/yr); year-one equity from $3k of loan paydown is wiped out by about $13k of value loss. Plan a longer hold.
- Collier County population projected at +30% by 2050 — long-run rental-demand tailwind backs the buy-and-hold thesis.
- At projected returns (-3.0% appreciation + 8.0% rent growth), your $126k cash investment doubles in ~10 years — after that, you're playing with house money.
Negotiation context
- It's been on market 71 days — a 6% lower offer ($422k) is reasonable based on typical stale-listing flexibility.
- Current owner paid $275k; list at $449k implies a 63% gain — meaningful room to come down on a strong offer.
Risks & watch-outs
- Climate carrying-cost: moderate flood risk; severe wind risk, 99% chance of damaging wind over 30y; extreme-heat days projected 7→28/yr by 2055 (HVAC capex compounding) — expect insurance premiums to compound above CPI over the hold.
Questions for the listing agent
- It's been on market 71 days. Have you received any prior offers? Is the seller open to a 6% concession, seller financing, or rate buy-down credit?
- What does the HOA fee cover, when was the last increase, and are there any pending special assessments or reserve-fund shortfalls?
- Any open or pending special assessments — roof, HVAC, plumbing, elevator, façade? What's the per-unit balance and payoff schedule, and is the seller paying it off at close or rolling it to the buyer?
- Why hasn't it sold? Are there any deal-killer items the seller is aware of (foundation, flood, title, zoning, code violations)?
- Is there a deadline driving the sale (1031 exchange, divorce, estate, relocation)? That informs how much negotiation room exists.
- Schools are B-rated — typically a magnet for longer-tenancy family renters. What's the average tenant stay here, and is there a school-zone premium baked into asking?
- What's the average days-on-market for RENTAL listings here right now (not sales)? A rising rental-DOM trend means longer vacancies and softer asking-rent achievability than the comps imply.
- What's the recent tenant-quality profile in this submarket — average credit score on applications, eviction rate, late-payment / NSF rate, and stable-employment percentage? A property-management company in the area should have these aggregated.
- How much new apartment / multifamily construction is in the pipeline within 1–3 miles? Heavy new supply (>2% of stock underway) typically softens rents 12–24 months out; light construction supports rent growth.
Investment metrics
- 1% rule
- 1.15% ✓
- Cap rate
- 7.14%
- Cash-on-cash
- 3.02%
- DSCR
- 1.13
- GRM
- 7.2
CMA / ARV
No comps found within radius.
Projected returns pro-forma
-3.0% appreciation · 8.0% rent growth · sell at horizon
- IRR
- -5.0%
- Equity multiple
- 0.80×
- Total profit
- $-24,744
- Equity at exit
- $66,947
- IRR
- 10.6%
- Equity multiple
- 2.04×
- Total profit
- $130,907
- Equity at exit
- $38,821
Cash invested: $125,720 (down + closing). Projections, not guarantees.
Landlord ↔ Tenant lean methodology
- Overall (STATE)
- 87 Strongly Landlord-Friendly
- State Florida
- 87 Strongly Landlord-Friendly · R+3
- County
- — inherits STATE
- City
- — inherits STATE
ZIP-level market 34103
- Rents YoY
- 14.6%
- Active inventory
- 479
- Price-to-rent
- 7.2×
Monthly cashflow live
- Estimated rent
- $5,176 medium interval (Pro) →
- Mortgage (P&I)
- −$2,355
- Tax from tax record
- −$347 /mo · $4,169/yr
- Insurance
- −$187
- HOA
- −$883
- Vacancy / Maint / Mgmt
- −$1,087
- Net cashflow
- $317
Break-even live
UW: 25.0% down · 7.5% · 30yr · 1.5% tax · 5.0% vac · 8.0% maint · 8.0% mgmt
Financing live
Cash to close
- Down payment
- $112,250
- Closing costs
- $13,470
- Reserves months
- —
- Total cash needed
- —
Loan-product check · same deal, 3 products live
Conventional
25% down · 7.5% · 30yr
- Down + closing
- —
- Monthly P&I
- —
- Monthly cashflow
- —
- DSCR
- —
- Eligible?
- —
Personal DTI + credit; lowest rate.
DSCR
20% down · 8.5% · 30yr
- Down + closing
- —
- Monthly P&I
- —
- Monthly cashflow
- —
- DSCR
- —
- Eligible?
- —
No personal income docs; deal must DSCR.
Hard money
10% down · 12.0% · 12mo
- Down + closing
- —
- Monthly P&I
- —
- Monthly cashflow
- —
- DSCR
- —
- Eligible?
- —
Short-term bridge; refi at stabilization.
Rent comps 40 comps
| Address | Beds | Baths | Sqft | Rent | $/sqft | DOM | Units | Dist |
|---|---|---|---|---|---|---|---|---|
| 3200 Binnacle Dr Unit D3 Naples, FL | 2.0 | 2.0 | 1180 | $9,000 | $7.63 | 21d | 1 | 0.09mi |
| 3105 Riviera Dr Unit A201 Naples, FL | 2.0 | 2.0 | 1625 | $8,000 | $4.92 | 23d | 1 | 0.19mi |
| 656 Binnacle Dr Naples, FL | 3.0 | 2.0 | 1808 | $10,000 | $5.53 | 23d | 1 | 0.24mi |
| 3030 Binnacle Dr #201 Naples, FL | 2.0 | 2.0 | 1092 | $5,000 | $4.58 | 23d | 1 | 0.26mi |
| 788 Park Shore Dr Naples, FL | 1.0–2.0 | 1.5–2.0 | 931 | $5,500 | $5.90 | 13d | 3 | 0.27mi |
| 820 Ketch Dr #2 Naples, FL | 2.0 | 2.0 | 1100 | $5,700 | $5.18 | 23d | 1 | 0.34mi |
| 820 Ketch Dr #3 Naples, FL | 2.0 | 2.0 | 1100 | $5,500 | $5.00 | 23d | 1 | 0.34mi |
| 45 High Point Cir S #303 Naples, FL | 2.0 | 2.0 | 1015 | $5,500 | $5.42 | 23d | 1 | 0.41mi |
| 3930 Belair Ln Naples, FL | 2.0 | 2.0 | 1300 | $6,000 | $4.62 | 23d | 1 | 0.48mi |
| 4082 Belair Ln #11 Naples, FL | 3.0 | 2.0 | 1600 | $6,000 | $3.75 | 23d | 1 | 0.64mi |
| 723 Willowhead Dr Naples, FL | 3.0 | 3.0 | 1776 | $18,000 | $10.14 | 23d | 1 | 0.68mi |
| 4092 Belair Ln #15 Naples, FL | 3.0 | 3.0 | 1500 | $6,200 | $4.13 | 23d | 1 | 0.68mi |
| 333 Harbour Dr #211 Naples, FL | 2.0 | 2.0 | 975 | $5,500 | $5.64 | 13d | 1 | 0.70mi |
| 3400 Gulf Shore Blvd N Unit M3 Naples, FL | 2.0 | 2.0 | 1337 | $9,500 | $7.11 | 23d | 1 | 0.73mi |
| 2515 Royal Palm Ct Naples, FL | 3.0 | 2.0 | 1875 | $17,500 | $9.33 | 23d | 1 | 0.75mi |
| 555 Park Shore Dr Unit B410 Naples, FL | 2.0 | 2.0 | 1200 | $6,000 | $5.00 | 21d | 1 | 0.75mi |
| 3200 Gulf Shore Blvd N #105 Naples, FL | 2.0 | 2.0 | 1116 | $8,500 | $7.62 | 23d | 1 | 0.78mi |
| 3500 Gulf Shore Blvd N Naples, FL | 2.0 | 2.0 | 1258 | $7,650 | $6.08 | 23d | 2 | 0.78mi |
| 3070 Gulf Shore Blvd N #103 Naples, FL | 2.0 | 2.0 | 1300 | $8,000 | $6.15 | 23d | 1 | 0.80mi |
| 222 Harbour Dr #105 Naples, FL | 2.0 | 2.0 | 1393 | $13,000 | $9.33 | 23d | 1 | 0.80mi |
| 1240 Shady Rest Ln #102 Naples, FL | 3.0 | 2.0 | 1619 | $6,000 | $3.71 | 13d | 1 | 0.82mi |
| 250 Park Shore Dr #803 Naples, FL | 3.0 | 2.0 | 1690 | $15,000 | $8.88 | 23d | 1 | 0.84mi |
| 3215 Gulf Shore Blvd N Unit 704N Naples, FL | 2.0 | 2.5 | 1505 | $14,000 | $9.30 | 23d | 1 | 0.86mi |
| 3443 Gulf Shore Blvd N Naples, FL | 2.0 | 2.0 | 1171 | $12,750 | $10.88 | 13d | 11 | 0.86mi |
| 4180 Crayton Rd Unit E7 Naples, FL | 3.0 | 2.0 | 1600 | $8,900 | $5.56 | 23d | 1 | 0.87mi |
| 355 Park Shore Dr Unit 1-114 Naples, FL | 2.0 | 2.0 | 1574 | $13,000 | $8.26 | 23d | 1 | 0.87mi |
| 3115 Gulf Shore Blvd N Unit 608S Naples, FL | 2.0 | 3.0 | 1792 | $10,000 | $5.58 | 23d | 1 | 0.88mi |
| 3115 Gulf Shore Blvd N Unit 412S Naples, FL | 2.0 | 2.5 | 1505 | $12,000 | $7.97 | 23d | 1 | 0.88mi |
| 3115 Gulf Shore Blvd N Unit 203S Naples, FL | 2.0 | 2.0 | 1505 | $15,000 | $9.97 | 23d | 1 | 0.88mi |
| 3951 Gulf Shore Blvd N #1203 Naples, FL | 2.0 | 2.0 | 1770 | $10,000 | $5.65 | 23d | 1 | 0.88mi |
| 2400 14th St N Naples, FL | 3.0 | 2.0 | 1464 | $5,890 | $4.02 | 13d | 1 | 0.93mi |
| 2885 Gulf Shore Blvd N #302 Naples, FL | 2.0 | 2.0 | 1500 | $20,000 | $13.33 | 23d | 1 | 0.94mi |
| 2750 Gulf Shore Blvd N Naples, FL | 2.0 | 2.0 | 1579 | $9,400 | $5.95 | 13d | 2 | 0.95mi |
| 4001 Gulf Shore Blvd N #1104 Naples, FL | 2.0 | 2.0 | 1267 | $11,000 | $8.68 | 23d | 1 | 0.97mi |
| 4001 Gulf Shore Blvd N #1106 Naples, FL | 3.0 | 2.5 | 1667 | $12,500 | $7.50 | 23d | 1 | 0.97mi |
| 4001 Gulf Shore Blvd N #803 Naples, FL | 2.0 | 2.0 | 1267 | $13,000 | $10.26 | 23d | 1 | 0.97mi |
| 4001 Gulf Shore Blvd N #505 Naples, FL | 2.0 | 2.0 | 1271 | $9,000 | $7.08 | 13d | 1 | 0.97mi |
| 4001 Gulf Shore Blvd N #500 Naples, FL | 2.0 | 2.5 | 1646 | $15,000 | $9.11 | 23d | 1 | 0.97mi |
| 4001 Gulf Shore Blvd N #105 Naples, FL | 2.0 | 2.0 | 1247 | $12,000 | $9.62 | 23d | 1 | 0.97mi |
| 4001 Gulf Shore Blvd N #303 Naples, FL | 2.0 | 2.0 | 1248 | $9,000 | $7.21 | 23d | 1 | 0.97mi |
HOA detail condo
- Monthly dues
- $883 · $10,596/yr
- Likely covers
- landscaping
- Assessments
- None detected in remarks — confirm with the listing agent.
Listing history 15 events
-
2026-06-14statusdays on market $449,000 Pending 71 DOM
-
2026-06-10days on market $449,000 Active 70 DOM
-
2026-06-09days on market $449,000 Active 69 DOM
-
2026-06-08days on market $449,000 Active 68 DOM
-
2026-06-07days on market $449,000 Active 67 DOM
-
2026-06-03days on market $449,000 Active 63 DOM
-
2026-06-02days on market $449,000 Active 62 DOM
-
2026-06-01days on market $449,000 Active 61 DOM
-
2026-05-31days on market $449,000 Active 60 DOM
-
2026-05-30days on market $449,000 Active 59 DOM
-
2026-05-12price $449,000
-
2026-04-01$465,000 Active
-
2008-03-20soldstatus $275,000
-
1992-07-01soldstatus $122,000
-
1985-05-01soldstatus $109,900
ⓘ Source: listings_history table (triggers on properties + properties_extension) + one-shot
backfill from property_details.listing_events for pre-trigger history.
Tax reassessment forecast FL · Resets to sale price
- Current annual tax
- $4,169 · $347/mo
- Projected year-2 tax
- $4,169 · $347/mo
- Expected delta
- $0/yr ($0/mo · 0.0%)
ⓘ Screening estimate from a state-policy table — verify with the county assessor before closing.
Climate risk First Street
- Flood 5/10 Major FEMA zone X (unshaded) · 45% chance over 30 yrs
- Wildfire 1/10 Low
- Heat 10/10 Extreme 7 d/yr ≥107°F today · 28 d/yr by 30 yrs out
- Wind 10/10 Extreme 99% chance of damaging wind over 30 yrs
- Air quality 2/10 Low 2 unhealthy d/yr today · 2 by 30 yrs out
Nearby sold comps map
Loading sold comps map…
Walkable amenities ~0.75 mi
Loading nearby amenities…
Taxation est. · year 1
- Rental income
- $62,109
- − Mortgage interest
- −$25,151
- − Property taxes
- −$4,169
- − Insurance
- −$2,245
- − Repairs & maintenance
- −$4,969
- − Management
- −$4,969
- − HOA
- −$10,596
- − Depreciation
- −$13,062
- Taxable loss
- −$3,052
- Est. tax savings @ 24.0%
- +$732
- After-tax cash flow
- $4,533/yr
For passive investors: Depreciation is non-cash, so a rental often shows a tax loss while cash-flowing — sheltering income. Rental losses are passive: they offset passive income freely, and up to $25,000/yr can offset ordinary (W-2) income if you actively participate and your MAGI is under $100k (phasing out to $0 by $150k); unused losses carry forward. On sale, claimed depreciation is recaptured at up to 25%, and gains may owe capital-gains tax (a 1031 exchange can defer both). Figures are a year-1 estimate at your 24.0% rate — not tax advice; consult a CPA.
Schools (NCES district)
- District
- Collier
- NCES district ID
- 1200330
- Math proficiency
- 60% ▼ -4.00%
- Reading proficiency
- 56% ▼ -2.00%
- Median HH income
- $58,275
- Composite
- 50.23/100
- National rank
- #1892
- State rank
- #16 of 73 in FL
Livability — Naples
- Score
- 80/100
- State rank
- #126
- US rank
- #1903
Category grades
Schools grade is shown separately in the Schools card above.
Census & demographics
- Census place
- Naples, FL
- County
- Collier County · 396,295 people
- City population
- 344,941
- Metro
- Naples-Marco Island, FL
- Population (ZIP)
- 11,299
- Household income
- $116,875
- Rent vs Own
- Severe rent burden
- 311.0
Population outlook (Collier County) Hauer SSP2
- Today (2025)
- 420,858 people
- By 2030
- 450,054 · +6.9%
- By 2040
- 502,232 · +19.3%
- By 2050
- 544,932 · +29.5%
- By 2075
- 627,203 · +49.0%
- By 2100
- 659,015 · +56.6%
Race, ethnicity, and origin ACS 2023
- Neighborhood character
- Predominantly White (87%)
- Race & ethnicity
- White 87% Hispanic / Latino 10% Two or more races 8% Asian 1%
- Hispanic origin (detail)
- Common ancestry
- Romanian 4% Lithuanian 2% Portuguese 2%
- Foreign-born
- 13% · Canada
- Languages at home
- 87% English-only · Spanish 9% Other Indo-European 2% German/W. Germanic 1%
Political lean MEDSL · Collier
- 2024 margin
- Solid R (+33.1) · D 33.1% · R 66.2%
- 2008→2024 swing
- -10.6pp toward R · 2008: -22.5pp · 2024: -33.1pp
- All cycles
- 2024: R+33.1 2020: R+24.7 2016: R+26.0 2012: R+30.1 2008: R+22.5
Not yet ingested
- Civics
- —
Market trends
- HPI YoY
- ▼ -327.53%
- Current HPI
- 315.1396
- Rent YoY
- ▲ 14.55%
- Metro
- Naples-Marco Island, FL
- State GDP YoY
- ▲ 3.28%
- F500 in state
- 36
Industry mix (Fortune 500 HQ in FL)
| Industry | F500 HQs | Revenue |
|---|---|---|
| Industrial Technology | 2 | $29B |
|
||
| Insurance | 2 | $17B |
|
||
| Retail | 1 | $60B |
|
||
| Technology Distribution | 1 | $58B |
|
||
| Homebuilding | 1 | $35B |
|
||
| Technology Manufacturing | 1 | $35B |
|
||
Price history
+308.6% since first listed5 events — show timeline
- 2026-05-12 Price Changed $449,000 NAPLESMLS
- 2026-04-01 Listed $465,000 NAPLESMLS
- 2008-03-20 Sold (Public Records) $275,000 Public Records
- 1992-07-01 Sold (Public Records) $122,000 Public Records
- 1985-05-01 Sold (Public Records) $109,900 Public Records
Property tax history
+7.6%/yrLatest (2025): $4,169 · +1.4% YoY. Source: county tax records.
Cash-flow waterfall
monthlySold comps — $/sqft
last 12 mo · ≤1 miLoading sold comps…