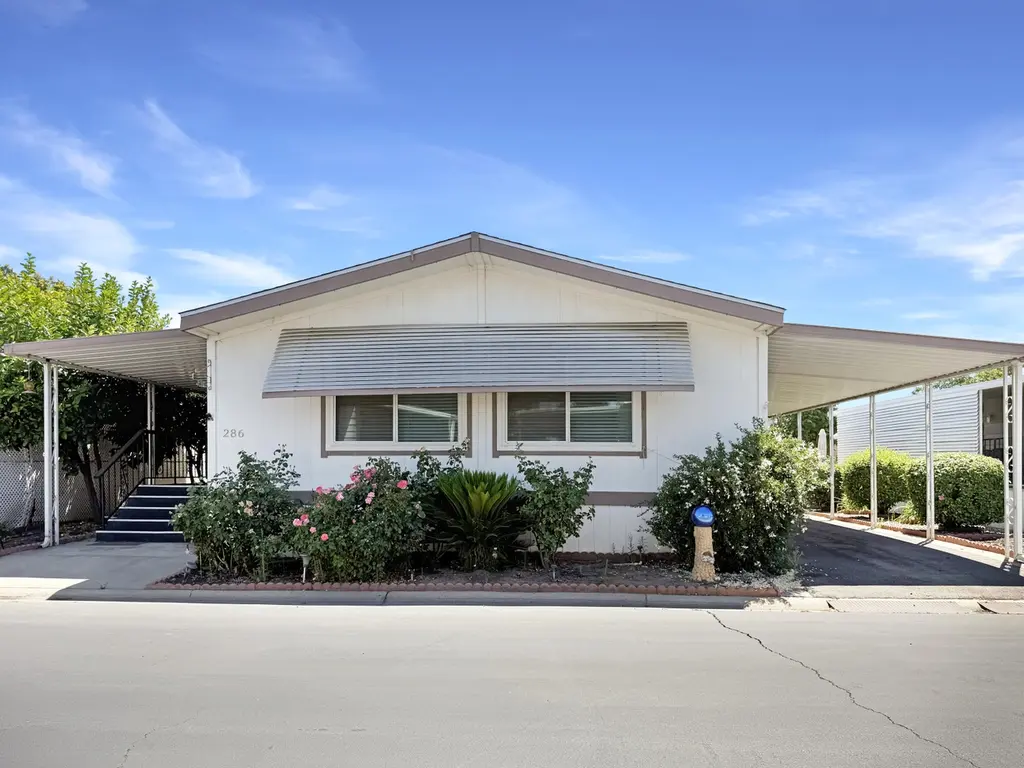
2706 W Ashlan Ave #286 · Fresno, CA
Flood risk 1/10 · Minimal
- FEMA flood zone
- X (unshaded)
- Chance of flooding over 30 yrs
- 0.0%
- Est. flood insurance / yr
- $507 – $1,088
Fire risk 1/10 · Minimal
- Est. fire insurance / yr
- $659 – $1,223
Heat risk 8/10 · Major
- Hot days now (above 105°F)
- 7 days/yr
- Hot days in 30 yrs
- 16 days/yr
Wind risk 1/10 · Minimal
- Chance of severe wind over 30 yrs
- —
Air-quality risk 10/10 · Severe
- Unhealthy air days now
- 48 days/yr
- Unhealthy air days in 30 yrs
- 50 days/yr
Risk factors via First Street. Map © Google.
Why this score? — see what drove the B- grade
The composite is a weighted blend of 9 inputs, each scored 0–100. Each bar is that input's sub-score; the figure is the points it added to the 100-point composite (weight × sub-score).
- Cash flow +30.0/30.0
- 1% rule +10.0/10.0
- DSCR +10.0/10.0
- ARV discount +6.0/15.0
- Rent growth +3.8/5.0
- Livability +3.1/5.0
- Schools +2.7/10.0
- Condition / age +2.2/5.0
- Appreciation +0.0/10.0
$135,000
🖨 Deal sheet 📄 Offer letter ✓ Due diligence
Listing remarks MLS
One of the largest mobile homes in the park, at 1922 sf with 3 bedrooms and 2 baths. Vaulted ceilings, new laminate flooring throughout main living area, upgraded cabinets in kitchen, brand new fridge, granite counters, washer and dryer included. Dual pane windows with faux wood blinds. Extra large storage pantry closet, large laundry room with sink, lighted display case, trash compactor, tThis amazing property also features es a power lift and extra large shed. his is a must see. This gated park has night security, 2 pools, 2 hot tubs, 2 saunas, 2 club houses, an exercise room, a library, pool tables, ping pong tables, card tables, rv storage and daily activities to keep you on the go. This property is located in a 55 and older community. Financing can be obtained for these nowadays. There is also no yearly property taxes, this one is on registration.
Key facts
- Open floor plan
- Updated kitchen
- Granite countertops
Tags
Property features AI
Finance
- HOA & community: Gated community
Exterior
- Parking: Attached carport
- Security: Gated community
- Utilities: Public water; Public sewer; Electricity connected; Natural gas available and connected
- Home design: Manufactured in-park (double wide manufactured home)
- Construction: Metal roof; Aluminum skirting
- Exterior features: Awning(s); Covered porch; Private and community pool access; Community spa/hot tub; Gated community; Accessible entrance with ramp
Interior
- Bathrooms: Two full bathrooms
- Heating & cooling: Central heating (natural gas); Central air conditioning
- Interior features: Ceiling fan(s)
- Laundry & utility: Separate laundry room
Neighborhood map
What this means for you Summary
Snapshot
- This is a 3-bed/2.0-bath manufactured listed at $135k. Condition is rated fair.
Deal economics
- At list price, monthly cash flow is $820 ($10k/yr) — positive.
- The deal already cash-flows at list — no discount required.
- Meets the 1% rule at list price ($2k rent vs $135k).
- Cap rate 13.6% vs local median 3.7% in Fresno — top-decile yield for the area; either an underpriced asset or a hidden risk that comps aren't pricing in. Stress-test before assuming the spread holds.
Location & tenants
- Location reads 62/100 on livability (#469 in CA) — a middle-class / working-renter tenant base. Strengths: commute A+, housing A+; Watch: amenities D+, employment D+, schools D.
- Fresno Unified (urban): math 18% / reading 47% proficiency, ranked #327 of 517 in CA (top 63%) — families likely to look elsewhere, expect single-tenant / working-renter base with shorter leases; 77% free/reduced lunch — lower-income household profile, screen leases tightly.
- Market conditions: Rents rising fast (+5.2%/yr); 96 active listings in the ZIP; 5 comparable units currently listed for rent nearby; rentals at typical pace (median 24d on market — plan ~3-4 weeks tenant-placement turnaround); 40% of comp listings sitting > 30 days — soft ceiling on asking rent; 2,426 units permitted in Fresno County in 2024 (296 in 5+ unit buildings).
- At $2,219/mo this rent would consume 47% of the median local household income ($57k/yr) (locally 2217% of renters already pay >50% of income on rent) — very limited rent-growth headroom before tenants either downsize or default.
Forward outlook
- Local home prices are declining (-3.0%/yr); year-one equity from $933 of loan paydown is wiped out by about $4k of value loss. Plan a longer hold.
- Fresno County population projected at +11% by 2050 — modest demand growth; plan on rents tracking national, not racing it.
- At projected returns (-3.0% appreciation + 5.2% rent growth), your $38k cash investment doubles in ~5 years — after that, you're playing with house money.
Negotiation context
- Only 6 days on market — expect competitive offers; lowballing is unlikely to land.
- 3 sale attempts since 2y ago with the ask held roughly flat each time — persistent listings suggest the price (not the market) is what's stuck; bring a comps-based counter.
Risks & watch-outs
- Climate carrying-cost: extreme-heat days projected 7→16/yr by 2055 (HVAC capex compounding) — expect insurance premiums to compound above CPI over the hold.
Questions for the listing agent
- Have any recent inspections been done? Can we get a copy of the seller's disclosures and any deferred-maintenance estimates?
- Built in 1977 — when were the roof, HVAC, electrical panel, plumbing, and water heater last replaced?
- Is there a deadline driving the sale (1031 exchange, divorce, estate, relocation)? That informs how much negotiation room exists.
- Schools are D-rated, which usually means shorter tenancies and higher turnover. Who's the typical renter profile here, and what's been the actual vacancy rate?
- Crime grade is F in this area — have there been break-ins, vandalism, or insurance claims at this property in the last 3 years? What carrier currently insures it and at what premium?
- What's the average days-on-market for RENTAL listings here right now (not sales)? A rising rental-DOM trend means longer vacancies and softer asking-rent achievability than the comps imply.
- What's the recent tenant-quality profile in this submarket — average credit score on applications, eviction rate, late-payment / NSF rate, and stable-employment percentage? A property-management company in the area should have these aggregated.
- How much new for-sale + rental construction is in the pipeline within 1–3 miles? Heavy new supply typically softens prices + rents 12–24 months out; constrained supply supports both.
Investment metrics
- 1% rule
- 1.64% ✓
- Cap rate
- 13.58%
- Cash-on-cash
- 26.02%
- DSCR
- 2.16
- GRM
- 5.1
CMA / ARV
- ARV (on-the-fly)
- $130,696
- Comps found
- 5
Show comp detail 5 sales within ~0.75 mi
| Address | Dist | Beds/Ba | Sqft | Sold | Price | $/sf | Match |
|---|---|---|---|---|---|---|---|
| 2706 W Ashlan Ave #111 | 0.08mi | 2/2.0 (-1) | 1,900 (-1%) | 0mo | $115,000 | $61 | 89 |
| 2706 W Ashlan Ave #239 | 0.00mi | 3/2.0 | 1,740 (-10%) | 2mo | $139,500 | $80 | 82 |
| 2706 W Ashlan Ave #288 | 0.09mi | 3/2.0 | 1,760 (-8%) | 9mo | $151,900 | $86 | 74 |
| 2706 W Ashlan Ave #150 | 0.09mi | 2/2.0 (-1) | 1,850 (-4%) | 15mo | $126,000 | $68 | 72 |
| 2706 W Ashlan Ave #226 | 0.17mi | 2/2.0 (-1) | 1,760 (-8%) | 7mo | $63,000 | $36 | 67 |
Match score weights: distance 35% · size 25% · config 20% · recency 20%. Top-matched comps best support the ARV.
Projected returns pro-forma
-3.0% appreciation · 5.19% rent growth · sell at horizon
- IRR
- 22.2%
- Equity multiple
- 1.94×
- Total profit
- $35,361
- Equity at exit
- $20,129
- IRR
- 31.6%
- Equity multiple
- 4.16×
- Total profit
- $119,592
- Equity at exit
- $11,672
Cash invested: $37,800 (down + closing). Projections, not guarantees.
Landlord ↔ Tenant lean methodology
- Overall (STATE)
- 18 Strongly Tenant-Friendly
- State California
- 18 Strongly Tenant-Friendly · D+13
- County
- — inherits STATE
- City
- — inherits STATE
ZIP-level market 93705
- Rents YoY
- 5.2%
- Active inventory
- 96
- Price-to-rent
- 5.1×
Monthly cashflow live
- Estimated rent
- $2,219 high interval (Pro) →
- Mortgage (P&I)
- −$708
- Tax est. 1.5%
- −$169 /mo · $2,025/yr
- Insurance
- −$56
- HOA
- −$0
- Vacancy / Maint / Mgmt
- −$466
- Net cashflow
- $820
Break-even live
UW: 25.0% down · 7.5% · 30yr · 1.5% tax · 5.0% vac · 8.0% maint · 8.0% mgmt
Financing live
Cash to close
- Down payment
- $33,750
- Closing costs
- $4,050
- Reserves months
- —
- Total cash needed
- —
Loan-product check · same deal, 3 products live
Conventional
25% down · 7.5% · 30yr
- Down + closing
- —
- Monthly P&I
- —
- Monthly cashflow
- —
- DSCR
- —
- Eligible?
- —
Personal DTI + credit; lowest rate.
DSCR
20% down · 8.5% · 30yr
- Down + closing
- —
- Monthly P&I
- —
- Monthly cashflow
- —
- DSCR
- —
- Eligible?
- —
No personal income docs; deal must DSCR.
Hard money
10% down · 12.0% · 12mo
- Down + closing
- —
- Monthly P&I
- —
- Monthly cashflow
- —
- DSCR
- —
- Eligible?
- —
Short-term bridge; refi at stabilization.
Rent comps 5 comps
| Address | Beds | Baths | Sqft | Rent | $/sqft | DOM | Units | Dist |
|---|---|---|---|---|---|---|---|---|
| 4184 N Briarwood Ave Fresno, CA | 3.0 | 2.0 | 1628 | $2,195 | $1.35 | 43d | 1 | 0.26mi |
| 3058 W San Gabriel Ave Fresno, CA | 3.0 | 2.0 | 1284 | $2,450 | $1.91 | 43d | 1 | 0.53mi |
| 3818 N Cheryl Ave Fresno, CA | 4.0 | 3.0 | 1649 | $2,500 | $1.52 | 23d | 1 | 0.71mi |
| 4467 N Van Dyke Ave Fresno, CA | 3.0 | 2.0 | 1292 | $2,195 | $1.70 | 3d | 1 | 0.87mi |
| 5355 N Valentine Ave Fresno, CA | 2.0–3.0 | 1.5–2.5 | 1318 | $2,799 | $2.12 | 16d | 1 | 1.38mi |
Listing history 7 events
-
2026-06-15status $135,000 Pending 6 DOM
-
2026-06-15days on market $135,000 Active 6 DOM
-
2026-06-13days on market $135,000 Active 4 DOM
-
2026-06-10days on market $135,000 Active 1 DOM
-
2026-06-09days on market $135,000 Active 2 DOM
-
2026-06-08remarks 699-char remark
-
2026-06-08$135,000 Active 1 DOM
ⓘ Source: listings_history table (triggers on properties + properties_extension) + one-shot
backfill from property_details.listing_events for pre-trigger history.
Climate risk First Street
- Flood 1/10 Low FEMA zone X (unshaded) · 0% chance over 30 yrs
- Wildfire 1/10 Low
- Heat 8/10 Severe 7 d/yr ≥105°F today · 16 d/yr by 30 yrs out
- Wind 1/10 Low
- Air quality 10/10 Extreme 48 unhealthy d/yr today · 50 by 30 yrs out
Nearby sold comps map
Loading sold comps map…
Walkable amenities ~0.75 mi
Loading nearby amenities…
Taxation est. · year 1
- Rental income
- $26,623
- − Mortgage interest
- −$7,562
- − Property taxes
- −$2,025
- − Insurance
- −$675
- − Repairs & maintenance
- −$2,130
- − Management
- −$2,130
- − Depreciation
- −$3,927
- Taxable income
- $8,174
- Est. tax owed @ 24.0%
- −$1,962
- After-tax cash flow
- $7,875/yr
For passive investors: Depreciation is non-cash, so a rental often shows a tax loss while cash-flowing — sheltering income. Rental losses are passive: they offset passive income freely, and up to $25,000/yr can offset ordinary (W-2) income if you actively participate and your MAGI is under $100k (phasing out to $0 by $150k); unused losses carry forward. On sale, claimed depreciation is recaptured at up to 25%, and gains may owe capital-gains tax (a 1031 exchange can defer both). Figures are a year-1 estimate at your 24.0% rate — not tax advice; consult a CPA.
Condition & rehab AI · 13 photos
The home is in fair condition with some exterior and landscaping issues that need attention. Painting the exterior siding and landscaping will improve its curb appeal and increase its value.
Repairs flagged
- Major Exterior siding — The exterior siding appears weathered and shows signs of wear, with some discoloration and possible peeling.
- Minor Landscaping — The landscaping appears overgrown and in need of trimming and maintenance.
Value-add opportunities
- Resale Painting the exterior siding — Painting the exterior siding will improve the home's curb appeal and make it look more presentable to potential buyers.
- Rental Landscaping and trimming the vegetation — Landscaping and trimming the vegetation will improve the home's curb appeal and make it more attractive to potential renters.
Renovation cost estimate screening
| Repair item | Severity | Est. cost |
|---|---|---|
| Exterior siding · The exterior siding appears weathered and shows signs of wear, with some discoloration and possible peeling. | Major | $15,000–50,000 |
| Landscaping · The landscaping appears overgrown and in need of trimming and maintenance. | Minor | $500–3,000 |
| Total estimated repair cost · 2 items | $15,500–53,000 |
Value-add ROI direction
- Resale Painting the exterior siding — Painting the exterior siding will improve the home's curb appeal and make it look more presentable to potential buyers. ↑
- Rental Landscaping and trimming the vegetation — Landscaping and trimming the vegetation will improve the home's curb appeal and make it more attractive to potential renters. ↑
ⓘ Cost ranges are severity-bucket heuristics (US national rule-of-thumb). Get contractor quotes + a written scope before underwriting a rehab budget.
Schools (NCES district)
- District
- Fresno Unified
- NCES district ID
- 0614550
- Math proficiency
- 18% ▼ -12.00%
- Reading proficiency
- 47% ▲ 9.00%
- Median HH income
- $36,095
- Composite
- 26.83/100
- National rank
- #7111
- State rank
- #327 of 517 in CA
Livability — Fresno
- Score
- 62/100
- State rank
- #469
- US rank
- #15907
Category grades
Schools grade is shown separately in the Schools card above.
Census & demographics
- Census place
- Fresno, CA
- County
- Fresno County · 834,801 people
- City population
- 593,114
- Metro
- Fresno, CA
- Population (ZIP)
- 38,888
- Household income
- $57,003
- Rent vs Own
- Severe rent burden
- 2217.0
Population outlook (Fresno County) Hauer SSP2
- Today (2025)
- 1,042,971 people
- By 2030
- 1,072,198 · +2.8%
- By 2040
- 1,122,408 · +7.6%
- By 2050
- 1,157,251 · +11.0%
- By 2075
- 1,182,575 · +13.4%
- By 2100
- 1,105,899 · +6.0%
Race, ethnicity, and origin ACS 2023
- Neighborhood character
- Diverse neighborhood (Simpson 0.56)
- Race & ethnicity
- Hispanic / Latino 62% Two or more races 34% White 22% Black 6% Asian 6% Native American 2%
- Hispanic origin (detail)
- Mexican 60%
- Common ancestry
- Lithuanian 1% Iranian 1% Russian 1%
- Foreign-born
- 13% · Canada, China
- Languages at home
- 61% English-only · Spanish 34% Other Asian/Pacific 2% Other Indo-European 1%
Political lean MEDSL · Fresno
- 2024 margin
- Toss-up / Even · D 46.5% · R 50.9% · Other 2.6%
- 2008→2024 swing
- -6.5pp toward R · 2008: 2.1pp · 2024: -4.4pp
- All cycles
- 2024: R+4.4 2020: D+7.8 2016: D+3.9 2012: R+2.9 2008: D+2.1
Not yet ingested
- Civics
- —
Market trends
- HPI YoY
- ▼ -331.23%
- Current HPI
- 399.0061
- Rent YoY
- ▲ 5.19%
- Metro
- Fresno, CA
- State GDP YoY
- ▲ 3.21%
- F500 in state
- 116
Industry mix (Fortune 500 HQ in CA)
| Industry | F500 HQs | Revenue |
|---|---|---|
| Technology | 27 | $1,492B |
|
||
| Financial Services | 3 | $174B |
|
||
| Retail | 3 | $44B |
|
||
| Insurance | 3 | $26B |
|
||
| Media / Entertainment | 2 | $115B |
|
||
| Pharmaceuticals / Biotech | 2 | $62B |
|
||
Price history
-10.0% since first listed7 events — show timeline
- 2026-06-07 Listed $135,000 TCMLS
- 2024-08-06 Sold (MLS) $137,000 FRESNOMLS
- 2024-07-14 Pending — FRESNOMLS
- 2024-06-27 Price Changed $145,000 FRESNOMLS
- 2024-05-06 Relisted — FRESNOMLS
- 2024-04-27 Pending — FRESNOMLS
- 2024-04-01 Listed $150,000 FRESNOMLS
Cash-flow waterfall
monthlySold comps — $/sqft
last 12 mo · ≤1 miLoading sold comps…