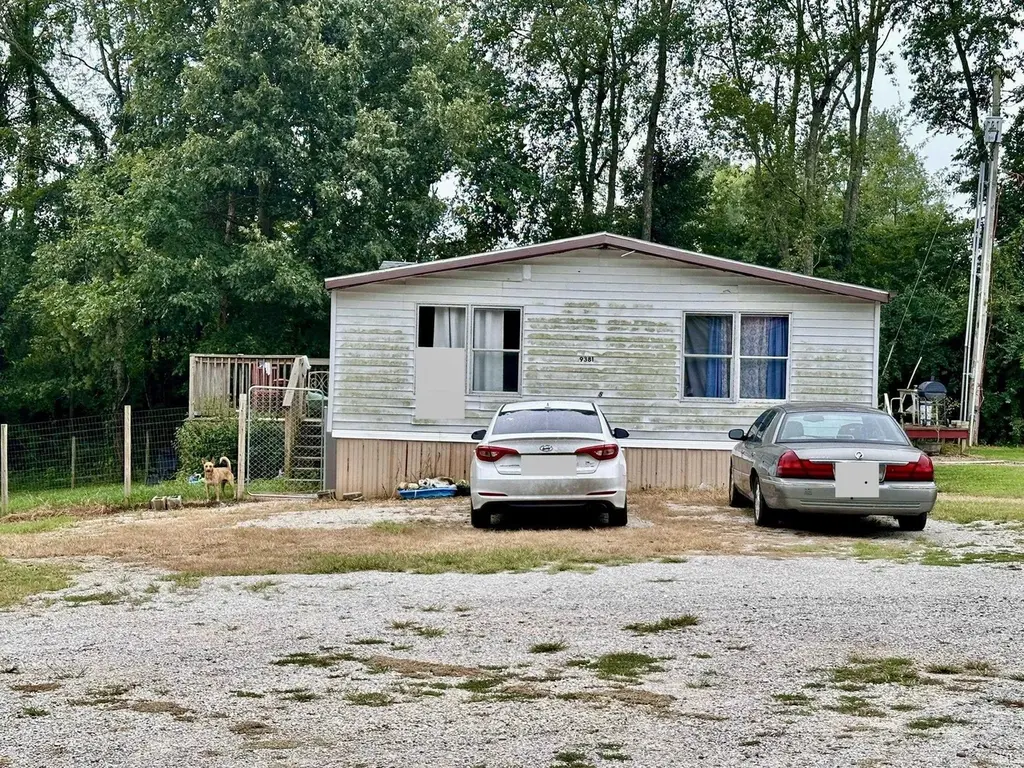
9381 CR 90 N · Hatfield, IN
Flood risk 1/10 · Minimal
- FEMA flood zone
- X (unshaded)
- Chance of flooding over 30 yrs
- 0.0%
- Est. flood insurance / yr
- $507 – $1,088
Fire risk 1/10 · Minimal
- Est. fire insurance / yr
- $717 – $1,331
Heat risk 5/10 · Moderate
- Hot days now (above 107°F)
- 7 days/yr
- Hot days in 30 yrs
- 19 days/yr
Wind risk 2/10 · Minimal
- Chance of severe wind over 30 yrs
- 3.0%
Air-quality risk 2/10 · Minimal
- Unhealthy air days now
- 2 days/yr
- Unhealthy air days in 30 yrs
- 2 days/yr
Risk factors via First Street. Map © Google.
Why this score? — see what drove the B+ grade
The composite is a weighted blend of 9 inputs, each scored 0–100. Each bar is that input's sub-score; the figure is the points it added to the 100-point composite (weight × sub-score).
- Cash flow +30.0/30.0
- 1% rule +10.0/10.0
- DSCR +10.0/10.0
- ARV discount +7.5/15.0
- Appreciation +6.2/10.0
- Schools +4.2/10.0
- Livability +3.2/5.0
- Rent growth +2.5/5.0
- Condition / age +2.2/5.0
$62,500
🖨 Deal sheet 📄 Offer letter ✓ Due diligence
Listing remarks MLS
This property is sold in a package with 9389 W CR 90 N, 935 N. CR 940 W, 9375 W. CR 90 N, 9386 W 90 N, and 9404 W CR 90 N. All properties to be sold together as a package and will not be separated. $375,000 for Package, Package can not be separated, each home priced at $62,500. $375,000 Divided by 6 = $62,500. All properties currently rented, please do not disturb tenants.
Key facts
- 0.3 acre lot
- Built 1995
- Listed 153 days
Neighborhood map
What this means for you Summary
Snapshot
- This is a 4-bed/2.0-bath manufactured listed at $62k. Condition is rated fair.
Deal economics
- At list price, monthly cash flow is $758 ($9k/yr) — positive.
- The deal already cash-flows at list — no discount required.
- Meets the 1% rule at list price ($2k rent vs $62k).
- Recommended offer: $55k (12.0% below list) — sets the bar for market timing.
Location & tenants
- Location reads 63/100 on livability (#438 in IN) — a middle-class / working-renter tenant base. Strengths: cost of living A+, housing A+, employment A; Watch: crime C-, schools F, amenities F.
- South Spencer County School Corporation (rural): math 46% / reading 54% proficiency, ranked #58 of 301 in IN (top 19%) — acceptable for families but not a draw, mixed tenant base, ~2y average lease.
- Market conditions: 40 active listings in the ZIP; 78 units permitted in Spencer County in 2024 (0 in 5+ unit buildings).
Forward outlook
- In year one you build about $2k of equity ($432 loan paydown + $1k appreciation (2.3% local appreciation)).
- Spencer County population projected at -16% by 2050 — secular population decline; favor cash flow + early exit over multi-decade hold.
- At projected returns (2.3% appreciation + 3.0% rent growth), your $18k cash investment doubles in ~2 years — after that, you're playing with house money.
Negotiation context
- It's been on market 154 days — a 12% lower offer ($55k) is reasonable based on typical stale-listing flexibility.
- 2 sale attempts since 2y ago with the ask held roughly flat each time — persistent listings suggest the price (not the market) is what's stuck; bring a comps-based counter.
Risks & watch-outs
- Climate carrying-cost: extreme-heat days projected 7→19/yr by 2055 (HVAC capex compounding) — expect insurance premiums to compound above CPI over the hold.
Questions for the listing agent
- It's been on market 154 days. Have you received any prior offers? Is the seller open to a 12% concession, seller financing, or rate buy-down credit?
- Have any recent inspections been done? Can we get a copy of the seller's disclosures and any deferred-maintenance estimates?
- Why hasn't it sold? Are there any deal-killer items the seller is aware of (foundation, flood, title, zoning, code violations)?
- Is there a deadline driving the sale (1031 exchange, divorce, estate, relocation)? That informs how much negotiation room exists.
- Schools are F-rated, which usually means shorter tenancies and higher turnover. Who's the typical renter profile here, and what's been the actual vacancy rate?
- What's the average days-on-market for RENTAL listings here right now (not sales)? A rising rental-DOM trend means longer vacancies and softer asking-rent achievability than the comps imply.
- What's the recent tenant-quality profile in this submarket — average credit score on applications, eviction rate, late-payment / NSF rate, and stable-employment percentage? A property-management company in the area should have these aggregated.
- How much new for-sale + rental construction is in the pipeline within 1–3 miles? Heavy new supply typically softens prices + rents 12–24 months out; constrained supply supports both.
Investment metrics
- 1% rule
- 2.41% ✓
- Cap rate
- 20.85%
- Cash-on-cash
- 51.98%
- DSCR
- 3.31
- GRM
- 3.5
CMA / ARV
- ARV (median comp)
- $128,126
- List price
- $62,500
- Delta
- -51.22%
- Verdict
- UNDERPRICED
- Comps
- 2 within 1.0 mi
Show comp detail 1 sale within ~0.75 mi
| Address | Dist | Beds/Ba | Sqft | Sold | Price | $/sf | Match |
|---|---|---|---|---|---|---|---|
| 9449 W County Road 70 N | 0.20mi | 3/2.0 (-1) | 1,400 (-14%) | 16mo | $139,900 | $100 | 49 |
Match score weights: distance 35% · size 25% · config 20% · recency 20%. Top-matched comps best support the ARV.
Projected returns pro-forma
2.31% appreciation · 3.0% rent growth · sell at horizon
- IRR
- 56.3%
- Equity multiple
- 4.06×
- Total profit
- $53,582
- Equity at exit
- $25,707
- IRR
- 56.5%
- Equity multiple
- 8.20×
- Total profit
- $126,004
- Equity at exit
- $37,848
Cash invested: $17,500 (down + closing). Projections, not guarantees.
Landlord ↔ Tenant lean methodology
- Overall (STATE)
- 90 Strongly Landlord-Friendly
- State Indiana
- 90 Strongly Landlord-Friendly · R+11
- County
- — inherits STATE
- City
- — inherits STATE
ZIP-level market 47634
- Home prices YoY
- 1.1%
- Active inventory
- 40
- Price-to-rent
- 3.5×
Monthly cashflow live
- Estimated rent
- $1,506 medium interval (Pro) →
- Mortgage (P&I)
- −$328
- Tax est. 1.5%
- −$78 /mo · $938/yr
- Insurance
- −$26
- HOA
- −$0
- Vacancy / Maint / Mgmt
- −$316
- Net cashflow
- $758
Break-even live
UW: 25.0% down · 7.5% · 30yr · 1.5% tax · 5.0% vac · 8.0% maint · 8.0% mgmt
Financing live
Cash to close
- Down payment
- $15,625
- Closing costs
- $1,875
- Reserves months
- —
- Total cash needed
- —
Loan-product check · same deal, 3 products live
Conventional
25% down · 7.5% · 30yr
- Down + closing
- —
- Monthly P&I
- —
- Monthly cashflow
- —
- DSCR
- —
- Eligible?
- —
Personal DTI + credit; lowest rate.
DSCR
20% down · 8.5% · 30yr
- Down + closing
- —
- Monthly P&I
- —
- Monthly cashflow
- —
- DSCR
- —
- Eligible?
- —
No personal income docs; deal must DSCR.
Hard money
10% down · 12.0% · 12mo
- Down + closing
- —
- Monthly P&I
- —
- Monthly cashflow
- —
- DSCR
- —
- Eligible?
- —
Short-term bridge; refi at stabilization.
Listing history 10 events
-
2026-06-08days on market $62,500 Active 154 DOM
-
2026-06-07days on market $62,500 Active 153 DOM
-
2026-06-05days on market $62,500 Active 150 DOM
-
2026-06-03days on market $62,500 Active 149 DOM
-
2026-06-02days on market $62,500 Active 148 DOM
-
2026-06-01days on market $62,500 Active 147 DOM
-
2026-05-31days on market $62,500 Active 146 DOM
-
2026-05-30days on market $62,500 Active 145 DOM
-
2026-01-05$62,500 Active 375-char remark
Show marketing remark (375 chars)
This property is sold in a package with 9389 W CR 90 N, 935 N. CR 940 W, 9375 W. CR 90 N, 9386 W 90 N, and 9404 W CR 90 N. All properties to be sold together as a package and will not be separated. $375,000 for Package, Package can not be separated, each home priced at $62,500. $375,000 Divided by 6 = $62,500. All properties currently rented, please do not disturb tenants.
-
2024-08-08$75,000 Active
ⓘ Source: listings_history table (triggers on properties + properties_extension) + one-shot
backfill from property_details.listing_events for pre-trigger history.
Climate risk First Street
- Flood 1/10 Low FEMA zone X (unshaded) · 0% chance over 30 yrs
- Wildfire 1/10 Low
- Heat 5/10 Major 7 d/yr ≥107°F today · 19 d/yr by 30 yrs out
- Wind 2/10 Low 3% chance of damaging wind over 30 yrs
- Air quality 2/10 Low 2 unhealthy d/yr today · 2 by 30 yrs out
Nearby sold comps map
Loading sold comps map…
Walkable amenities ~0.75 mi
Loading nearby amenities…
Taxation est. · year 1
- Rental income
- $18,076
- − Mortgage interest
- −$3,501
- − Property taxes
- −$938
- − Insurance
- −$312
- − Repairs & maintenance
- −$1,446
- − Management
- −$1,446
- − Depreciation
- −$1,818
- Taxable income
- $8,615
- Est. tax owed @ 24.0%
- −$2,067
- After-tax cash flow
- $7,029/yr
For passive investors: Depreciation is non-cash, so a rental often shows a tax loss while cash-flowing — sheltering income. Rental losses are passive: they offset passive income freely, and up to $25,000/yr can offset ordinary (W-2) income if you actively participate and your MAGI is under $100k (phasing out to $0 by $150k); unused losses carry forward. On sale, claimed depreciation is recaptured at up to 25%, and gains may owe capital-gains tax (a 1031 exchange can defer both). Figures are a year-1 estimate at your 24.0% rate — not tax advice; consult a CPA.
Condition & rehab AI · 2 photos
This manufactured home requires moderate repairs and painting to improve its exterior and interior condition, significantly enhancing its resale and rental value.
Repairs flagged
- Major siding — Significant wear and tear
- Major paint — Faded and uneven
Value-add opportunities
- Both painting and repainting the exterior — Enhances curb appeal and value
- Both repairing and repainting the interior walls — Improves living space and value
- Both repairing the siding — Fixes the most visible and impactful issue
Renovation cost estimate screening
| Repair item | Severity | Est. cost |
|---|---|---|
| siding · Significant wear and tear | Major | $15,000–50,000 |
| paint · Faded and uneven | Major | $15,000–50,000 |
| Total estimated repair cost · 2 items | $30,000–100,000 |
Value-add ROI direction
- Both painting and repainting the exterior — Enhances curb appeal and value ↑
- Both repairing and repainting the interior walls — Improves living space and value ↑
- Both repairing the siding — Fixes the most visible and impactful issue ↑
ⓘ Cost ranges are severity-bucket heuristics (US national rule-of-thumb). Get contractor quotes + a written scope before underwriting a rehab budget.
Schools (NCES district)
- District
- South Spencer County School Corporation
- NCES district ID
- 1810560
- Math proficiency
- 46% ▼ -6.00%
- Reading proficiency
- 54% ▼ -2.00%
- Median HH income
- $47,220
- Composite
- 42.49/100
- National rank
- #3208
- State rank
- #58 of 301 in IN
Livability — Hatfield
- Score
- 63/100
- State rank
- #438
- US rank
- #15721
Category grades
Schools grade is shown separately in the Schools card above.
Census & demographics
- Census place
- Hatfield, IN
- Population (ZIP)
- 2,101
Population outlook (Spencer County) Hauer SSP2
- Today (2025)
- 20,394 people
- By 2030
- 19,912 · -2.4%
- By 2040
- 18,592 · -8.8%
- By 2050
- 17,051 · -16.4%
- By 2075
- 14,010 · -31.3%
- By 2100
- 10,869 · -46.7%
Race, ethnicity, and origin ACS 2023
- Neighborhood character
- Predominantly White (94%)
- Race & ethnicity
- White 94% Two or more races 6% Hispanic / Latino 3%
- Common ancestry
- Lithuanian 4% Romanian 2% English 2%
- Foreign-born
- 3% · Canada
- Languages at home
- 97% English-only · French/Haitian/Cajun 1% Spanish 1%
Political lean MEDSL · Spencer
- 2024 margin
- Solid R (+43.3) · D 27.4% · R 70.6% · Other 2.0%
- 2008→2024 swing
- -43.6pp toward R · 2008: 0.4pp · 2024: -43.3pp
- All cycles
- 2024: R+43.3 2020: R+38.5 2016: R+37.3 2012: R+15.3 2008: D+0.4
Not yet ingested
- Civics
- —
Market trends
- HPI YoY
- ▲ 2.31%
- Current HPI
- 210.8511
- Rent YoY
- —
- Metro
- —
- State GDP YoY
- ▲ 2.90%
- F500 in state
- 18
Industry mix (Fortune 500 HQ in IN)
| Industry | F500 HQs | Revenue |
|---|---|---|
| Industrial Machinery | 2 | $37B |
|
||
| Healthcare | 1 | $177B |
|
||
| Pharmaceuticals | 1 | $45B |
|
||
| Metals / Steel | 1 | $18B |
|
||
| Agriculture | 1 | $17B |
|
||
| Packaging | 1 | $12B |
|
||
Price history
-16.7% since first listed2 events — show timeline
- 2026-01-05 Listed $62,500 IRMLS
- 2024-08-08 Listed $75,000 IRMLS
Cash-flow waterfall
monthlySold comps — $/sqft
last 12 mo · ≤1 miLoading sold comps…