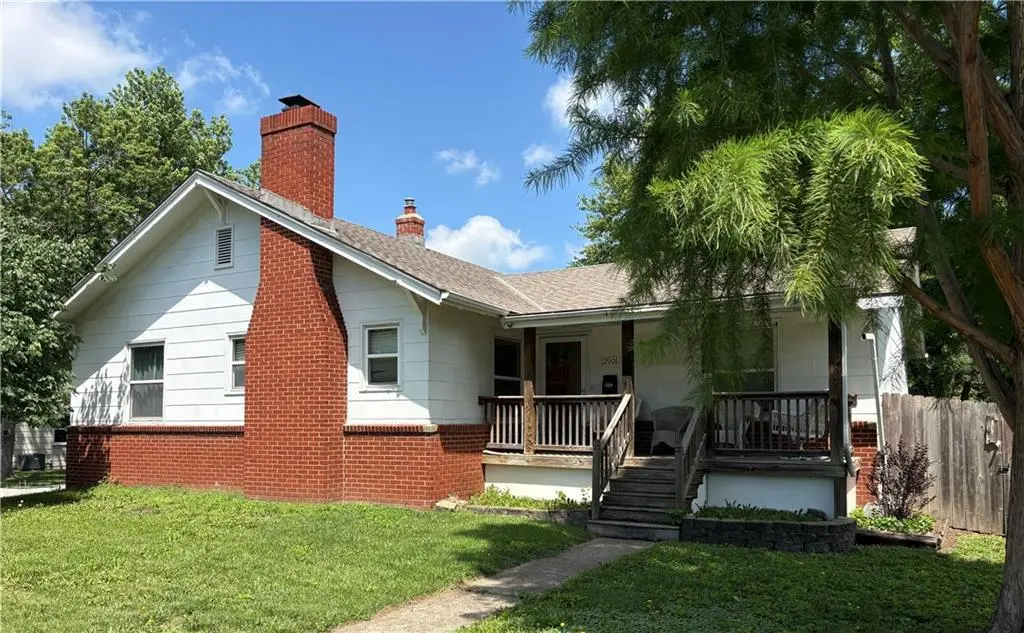
12901 Grandview Rd · Grandview, MO
Flood risk 1/10 · Minimal
- FEMA flood zone
- X (unshaded)
- Chance of flooding over 30 yrs
- 0.0%
- Est. flood insurance / yr
- $473 – $860
Fire risk 3/10 · Minor
- Est. fire insurance / yr
- $1,054 – $1,958
Heat risk 4/10 · Minor
- Hot days now (above 107°F)
- 7 days/yr
- Hot days in 30 yrs
- 17 days/yr
Wind risk 2/10 · Minimal
- Chance of severe wind over 30 yrs
- —
Air-quality risk 3/10 · Minor
- Unhealthy air days now
- 3 days/yr
- Unhealthy air days in 30 yrs
- 3 days/yr
Risk factors via First Street. Map © Google.
Why this score? — see what drove the D+ grade
The composite is a weighted blend of 9 inputs, each scored 0–100. Each bar is that input's sub-score; the figure is the points it added to the 100-point composite (weight × sub-score).
- Cash flow +15.8/30.0
- ARV discount +10.8/15.0
- DSCR +4.9/10.0
- Rent growth +4.0/5.0
- 1% rule +3.9/10.0
- Livability +3.1/5.0
- Condition / age +2.5/5.0
- Schools +2.1/10.0
- Appreciation +0.0/10.0
$197,000
🖨 Deal sheet (PDF) 📄 Offer letter ✓ Due diligence
Listing remarks MLS
NEW ROOF IS ON! This lovely home build in 1910, has the Abstract of Title. Google fiber ready, Kitchen w/ eat-in dining, 3+ BD, Full & 1/2 BA, Large Fam rm has WBFP. Full Bsmt w/ "Man Cave", laundry. All appliances 3 Car Gar. Gorgeous landscaping! Greenhouse w/ raised beds ready for planting. Patio, beautiful Coy Pond w/ Banana Trees, Fish, fountain. Home on corner lot. Quiet neighborhood, Close to shopping, parks, schools, Community Center 5 mins away. Comes with 1 yr Seller Paid HMS Warranty Located walking distance to Historic Downtown. Truman Marketplace Shopping, Valley Park, John Anderson Splash Park, Freedom Park just blocks down the street, next to Gazebo, the Historic Depot Museum and Caboose. Behind Grandview City Hall.
Key facts
- 0.23 acre lot
- 3 garage spots
- Built 1912
Property features AI
Finance
- HOA & community: Community center
Exterior
- Parking: Detached 3-car garage
- Security: Smoke detector(s)
- Utilities: Public water; Public sewer; Cable available; High-speed internet available
- Home design: Single-family residence; Attached property; Raised ranch floor plan; Home is over 100 years old
- Construction: Frame construction; Composition roof; Full basement
- Exterior features: Patio; Wood fencing; Corner lot; Greenhouse (other structure)
Interior
- Kitchen: Pantry; Built-in features; Dishwasher; Gas range; Refrigerator; Stainless steel appliances
- Bedrooms: 3 bedrooms (all on the main level)
- Flooring: Wood flooring; Carpet
- Bathrooms: 1 full bathroom with ceramic tile and shower-over-tub; 1 half bathroom
- Heating & cooling: Natural gas heating; Electric cooling
- Interior features: Ceiling fans; Window coverings; Smoke detector(s)
- Laundry & utility: Washer and dryer included; Laundry located in the basement
Neighborhood map
What this means for you Summary
Snapshot
- This is a 3-bed/1.5-bath single-family listed at $197k.
Deal economics
- At list price, monthly cash flow is $92 ($1k/yr) — positive.
- The deal already cash-flows at list — no discount required.
- To meet the 1% rule (rent ≥ 1% of price), the offer needs to be $175k (10.9% below list).
- Recommended offer: $175k (10.9% below list) — sets the bar for 1% rule.
- Cap rate 6.9% vs local median 5.0% in Grandview — top-decile yield for the area; either an underpriced asset or a hidden risk that comps aren't pricing in. Stress-test before assuming the spread holds.
Location & tenants
- Location reads 61/100 on livability (#454 in MO) — a middle-class / working-renter tenant base. Strengths: cost of living A+, housing A+; Watch: employment D, crime F, amenities F.
- Grandview C-4 (suburban): math 17% / reading 32% proficiency, ranked #284 of 324 in MO (top 88%) — low school quality limits family demand, transient renter base, plan for 1-2y turnover; 65% free/reduced lunch — lower-income household profile, screen leases tightly.
- Zoned schools: Conn-West Elem. (math 8% / reading 17%, grade F, #1,007 of 1,115 statewide, top 91%, 321 students, 77% FRL); Grandview Middle (math 18% / reading 39%, grade F, #303 of 391 statewide, top 78%, 517 students, 68% FRL); Grandview Sr. High (math 15% / reading 41%, grade F, #414 of 521 statewide, top 80%, 1,122 students, 62% FRL) — zoned schools at 69% FRL track the district average.
- Market conditions: Rents rising fast (+6.1%/yr); 120 active listings in the ZIP; 12 comparable units currently listed for rent nearby; rentals at typical pace (median 23d on market — plan ~3-4 weeks tenant-placement turnaround); 4,002 units permitted in Jackson County in 2024 (2,271 in 5+ unit buildings).
- This rent runs 40% of the median local income ($53k/yr) — at the standard rent-burdened threshold; future hikes will face affordability resistance.
Forward outlook
- Local home prices are declining (-3.0%/yr); year-one equity from $1k of loan paydown is wiped out by about $6k of value loss. Plan a longer hold.
- Jackson County population projected at +4% by 2050 — modest demand growth; plan on rents tracking national, not racing it.
Negotiation context
- Only 4 days on market — expect competitive offers; lowballing is unlikely to land.
Risks & watch-outs
- Watch-outs: built in 1912 — expect roof / HVAC / electrical / plumbing capex.
Questions for the listing agent
- Built in 1912 — when were the roof, HVAC, electrical panel, plumbing, and water heater last replaced?
- Is there a deadline driving the sale (1031 exchange, divorce, estate, relocation)? That informs how much negotiation room exists.
- Schools are D-rated, which usually means shorter tenancies and higher turnover. Who's the typical renter profile here, and what's been the actual vacancy rate?
- Crime grade is F in this area — have there been break-ins, vandalism, or insurance claims at this property in the last 3 years? What carrier currently insures it and at what premium?
- The area grade is low — what's the realistic commute time and amenity access for the typical tenant pool here? Any planned neighborhood developments (good or bad) we should know about?
- What's the average days-on-market for RENTAL listings here right now (not sales)? A rising rental-DOM trend means longer vacancies and softer asking-rent achievability than the comps imply.
- What's the recent tenant-quality profile in this submarket — average credit score on applications, eviction rate, late-payment / NSF rate, and stable-employment percentage? A property-management company in the area should have these aggregated.
- How much new for-sale + rental construction is in the pipeline within 1–3 miles? Heavy new supply typically softens prices + rents 12–24 months out; constrained supply supports both.
Investment metrics
- 1% rule
- 0.89% ✗
- Cap rate
- 6.85%
- Cash-on-cash
- 2.00%
- DSCR
- 1.09
- GRM
- 9.4
CMA / ARV
- ARV (on-the-fly)
- $212,390
- Comps found
- 12
Show comp detail 12 sales within ~0.75 mi
| Address | Dist | Beds/Ba | Sqft | Sold | Price | $/sf | Match |
|---|---|---|---|---|---|---|---|
| 908 Jones Ave | 0.04mi | 3/1.0 | 1,668 (+5%) | 13mo | $200,000 | $120 | 77 |
| 12805 8th St | 0.13mi | 4/2.0 (+1) | 1,626 (+3%) | 12mo | $225,000 | $138 | 73 |
| 1009 High Grove Rd | 0.28mi | 3/2.0 | 1,580 (-0%) | 17mo | $190,000 | $120 | 70 |
| 12901 10 St | 0.07mi | 4/2.0 (+1) | 1,672 (+6%) | 14mo | $230,000 | $138 | 69 |
| 1007 Skyline Dr | 0.34mi | 3/2.0 | 1,600 (+1%) | 14mo | $215,000 | $134 | 69 |
| 1003 Jones Ave | 0.09mi | 4/2.0 (+1) | 1,550 (-2%) | 19mo | $239,900 | $155 | 69 |
| 12701 10th St | 0.25mi | 3/2.0 | 1,397 (-12%) | 4mo | $240,000 | $172 | 63 |
| 6041 E 127th St | 0.71mi | 2/1.5 (-1) | 1,600 (+1%) | 1mo | $115,000 | $72 | 60 |
| 1321 Skyline Dr | 0.45mi | 3/1.5 | 1,673 (+6%) | 13mo | $249,900 | $149 | 59 |
| 13302 11th St | 0.52mi | 3/1.0 | 1,408 (-11%) | 3mo | $170,000 | $121 | 52 |
| 1326 E 126th St | 0.52mi | 3/2.5 | 1,385 (-13%) | 7mo | $185,000 | $134 | 45 |
| 13112 15th St | 0.45mi | 2/1.0 (-1) | 1,407 (-11%) | 12mo | $180,000 | $128 | 43 |
Match score weights: distance 35% · size 25% · config 20% · recency 20%. Top-matched comps best support the ARV.
Projected returns pro-forma
-3.0% appreciation · 6.1% rent growth · sell at horizon
- IRR
- -9.9%
- Equity multiple
- 0.63×
- Total profit
- $-20,450
- Equity at exit
- $29,373
- IRR
- 3.2%
- Equity multiple
- 1.26×
- Total profit
- $14,333
- Equity at exit
- $17,033
Cash invested: $55,160 (down + closing). Projections, not guarantees.
Landlord ↔ Tenant lean methodology
- Overall (STATE)
- 81 Strongly Landlord-Friendly
- State Missouri
- 81 Strongly Landlord-Friendly · R+10
- County
- — inherits STATE
- City
- — inherits STATE
ZIP-level market 64030
- Home prices YoY
- -30.7%
- Rents YoY
- 6.1%
- Active inventory
- 120
- Price-to-rent
- 9.4×
Monthly cashflow live
- Estimated rent
- $1,754 high interval (Pro) →
- Mortgage (P&I)
- −$1,033
- Tax from tax record
- −$179 /mo · $2,149/yr
- Insurance
- −$82
- HOA
- −$0
- Vacancy / Maint / Mgmt
- −$368
- Net cashflow
- $92
Break-even live
Sensitivity live
| Price | -10% $203 | -5% $148 | +0% $92 | +5% $36 | +10% $-20 |
|---|---|---|---|---|---|
| Rent | -10% $-47 | -5% $22 | +0% $92 | +5% $161 | +10% $230 |
| Rate | -1.0pp $191 | -0.5pp $142 | base $92 | +0.5pp $41 | +1.0pp $-11 |
UW: 25.0% down · 7.5% · 30yr · 1.5% tax · 5.0% vac · 8.0% maint · 8.0% mgmt
Financing live
Cash to close
- Down payment
- $49,250
- Closing costs
- $5,910
- Reserves months
- —
- Total cash needed
- —
Loan-product check · same deal, 3 products live
Conventional
25% down · 7.5% · 30yr
- Down + closing
- —
- Monthly P&I
- —
- Monthly cashflow
- —
- DSCR
- —
- Eligible?
- —
Personal DTI + credit; lowest rate.
DSCR
20% down · 8.5% · 30yr
- Down + closing
- —
- Monthly P&I
- —
- Monthly cashflow
- —
- DSCR
- —
- Eligible?
- —
No personal income docs; deal must DSCR.
Hard money
10% down · 12.0% · 12mo
- Down + closing
- —
- Monthly P&I
- —
- Monthly cashflow
- —
- DSCR
- —
- Eligible?
- —
Short-term bridge; refi at stabilization.
Rent comps 12 comps
| Address | Beds | Baths | Sqft | Rent | $/sqft | DOM | Units | Dist |
|---|---|---|---|---|---|---|---|---|
| 12712 7th St Grandview, MO | 3.0 | 2.0 | 1050 | $1,545 | $1.47 | 14d | 1 | 0.24mi |
| 1325 Duck Rd Grandview, MO | 3.0 | 1.5 | 1480 | $1,600 | $1.08 | 45d | 1 | 0.44mi |
| 13206 15th St Grandview, MO | 3.0 | 2.0 | 1204 | $1,735 | $1.44 | 23d | 1 | 0.58mi |
| 6003 E 133rd St Grandview, MO | 4.0 | 2.5 | 1560 | $1,990 | $1.28 | 14d | 1 | 0.84mi |
| 13701 11th Ter Grandview, MO | 4.0 | 2.0 | 1900 | $1,940 | $1.02 | 45d | 1 | 1.05mi |
| 6505 Yorkshire Ct Grandview, MO | 3.0 | 2.0 | 1697 | $2,090 | $1.23 | 6d | 1 | 1.05mi |
| 5940 E 136th St Grandview, MO | 4.0 | 2.0 | 1897 | $1,575 | $0.83 | 25d | 1 | 1.08mi |
| 13718 Cypress Ave Grandview, MO | 3.0 | 1.0 | 1050 | $1,445 | $1.38 | 9d | 1 | 1.14mi |
| 13915 Grandboro Ln Grandview, MO | 4.0 | 2.5 | 1515 | $1,895 | $1.25 | 3d | 1 | 1.37mi |
| 13915 Grandboro Ln Grandview, MO | 4.0 | 2.5 | 1515 | $1,895 | $1.25 | 4d | 1 | 1.37mi |
| 6501 E 137th St Grandview, MO | 4.0 | 3.0 | 1469 | $2,135 | $1.45 | 45d | 1 | 1.40mi |
| 11805 Lawndale Ave Kansas City, MO | 3.0 | 1.0 | 1152 | $1,565 | $1.36 | 25d | 1 | 1.42mi |
Listing history 5 events
-
2026-06-08status $197,000 Pending 4 DOM
-
2026-06-07remarks 282-char remark
-
2026-06-07statusdays on market $197,000 Active 4 DOM
-
2026-06-03remarks 144-char remark
-
2026-06-03$197,000 Coming Soon 1 DOM
ⓘ Source: listings_history table (triggers on properties + properties_extension) + one-shot
backfill from property_details.listing_events for pre-trigger history.
Tax reassessment forecast MO · Resets to sale price
- Current annual tax
- $2,149 · $179/mo
- Projected year-2 tax
- $2,149 · $179/mo
- Expected delta
- $0/yr ($0/mo · 0.0%)
ⓘ Screening estimate from a state-policy table — verify with the county assessor before closing.
Climate risk First Street
- Flood 1/10 Low FEMA zone X (unshaded) · 0% chance over 30 yrs
- Wildfire 3/10 Moderate
- Heat 4/10 Moderate 7 d/yr ≥107°F today · 17 d/yr by 30 yrs out
- Wind 2/10 Low
- Air quality 3/10 Moderate 3 unhealthy d/yr today · 3 by 30 yrs out
Nearby sold comps map
Loading sold comps map…
Walkable amenities ~0.75 mi
Loading nearby amenities…
Taxation est. · year 1
- Rental income
- $21,053
- − Mortgage interest
- −$11,035
- − Property taxes
- −$2,149
- − Insurance
- −$985
- − Repairs & maintenance
- −$1,684
- − Management
- −$1,684
- − Depreciation
- −$5,731
- Taxable loss
- −$2,215
- Est. tax savings @ 24.0%
- +$532
- After-tax cash flow
- $1,633/yr
For passive investors: Depreciation is non-cash, so a rental often shows a tax loss while cash-flowing — sheltering income. Rental losses are passive: they offset passive income freely, and up to $25,000/yr can offset ordinary (W-2) income if you actively participate and your MAGI is under $100k (phasing out to $0 by $150k); unused losses carry forward. On sale, claimed depreciation is recaptured at up to 25%, and gains may owe capital-gains tax (a 1031 exchange can defer both). Figures are a year-1 estimate at your 24.0% rate — not tax advice; consult a CPA.
Schools (NCES district)
- District
- Grandview C-4
- NCES district ID
- 2913140
- Math proficiency
- 17% ▼ -12.00%
- Reading proficiency
- 32% ▼ -3.00%
- Median HH income
- $48,934
- Composite
- 21.49/100
- National rank
- #8326
- State rank
- #284 of 324 in MO
Livability — Grandview
- Score
- 61/100
- State rank
- #454
- US rank
- #18350
Category grades
Schools grade is shown separately in the Schools card above.
Census & demographics
- Census place
- Grandview, MO
- County
- Jackson County · 687,798 people
- City population
- 26,422
- Metro
- Kansas City, MO-KS
- Population (ZIP)
- 26,422
- Household income
- $53,216
- Rent vs Own
- Severe rent burden
- 1449.0
Population outlook (Jackson County) Hauer SSP2
- Today (2025)
- 719,589 people
- By 2030
- 731,456 · +1.6%
- By 2040
- 746,689 · +3.8%
- By 2050
- 749,289 · +4.1%
- By 2075
- 736,227 · +2.3%
- By 2100
- 668,210 · -7.1%
Race, ethnicity, and origin ACS 2023
- Neighborhood character
- Diverse neighborhood (Simpson 0.68)
- Race & ethnicity
- White 44% Black 33% Hispanic / Latino 14% Two or more races 7% Asian 3%
- Hispanic origin (detail)
- Mexican 8%
- Common ancestry
- Lithuanian 1% Romanian 1% Slovak 1%
- Foreign-born
- 9% · Canada, South Korea
- Languages at home
- 86% English-only · Spanish 11% Korean 1% Arabic 1%
Political lean MEDSL · Jackson
- 2024 margin
- D (+19.3) · D 58.9% · R 39.5% · Other 1.6%
- 2008→2024 swing
- -6.1pp toward R · 2008: 25.4pp · 2024: 19.3pp
- All cycles
- 2024: D+19.3 2020: D+22.0 2016: D+16.6 2012: D+19.0 2008: D+25.4
Not yet ingested
- Civics
- —
Market trends
- HPI YoY
- ▼ -142.24%
- Current HPI
- 321.6905
- Rent YoY
- ▲ 6.10%
- Metro
- Kansas City, MO-KS
- State GDP YoY
- ▲ 1.84%
- F500 in state
- 20
Industry mix (Fortune 500 HQ in MO)
| Industry | F500 HQs | Revenue |
|---|---|---|
| Healthcare | 1 | $163B |
|
||
| Insurance | 1 | $21B |
|
||
| Industrial Technology | 1 | $17B |
|
||
| Retail | 1 | $16B |
|
||
| Industrial Distribution | 1 | $10B |
|
||
| Utilities | 1 | $9B |
|
||
Price history
+38.7% since first listed7 events — show timeline
- 2026-06-02 Coming Soon $197,000 Heartland MLS as Distributed by MLS Grid
- 2017-08-01 Sold (Public Records) — Public Records
- 2017-07-31 Sold (MLS) — Heartland MLS as Distributed by MLS Grid
- 2017-06-23 Pending — Heartland MLS as Distributed by MLS Grid
- 2017-03-28 Price Changed $138,000 Heartland MLS as Distributed by MLS Grid
- 2017-02-17 Listed $142,000 Heartland MLS as Distributed by MLS Grid
- 1992-11-23 Sold (Public Records) — Public Records
Property tax history
+3.6%/yrLatest (2025): $2,149 · -14.4% YoY. Source: county tax records.
Cash-flow waterfall
monthlySold comps — $/sqft
last 12 mo · ≤1 miLoading sold comps…