2271 Tough Boy Rd · Pahrump, NV
Flood risk 1/10 · Minimal
- FEMA flood zone
- X (shaded)
- Chance of flooding over 30 yrs
- 0.0%
- Est. flood insurance / yr
- $507 – $1,088
Fire risk 5/10 · Moderate
- Est. fire insurance / yr
- $490 – $910
Heat risk 7/10 · Major
- Hot days now (above 103°F)
- 7 days/yr
- Hot days in 30 yrs
- 18 days/yr
Wind risk 1/10 · Minimal
- Chance of severe wind over 30 yrs
- —
Air-quality risk 1/10 · Minimal
- Unhealthy air days now
- 0 days/yr
- Unhealthy air days in 30 yrs
- 0 days/yr
Risk factors via First Street. Map © Google.
Why this score? — see what drove the D+ grade
The composite is a weighted blend of 9 inputs, each scored 0–100. Each bar is that input's sub-score; the figure is the points it added to the 100-point composite (weight × sub-score).
- ARV discount +14.6/15.0
- Cash flow +13.3/30.0
- DSCR +4.0/10.0
- Livability +3.4/5.0
- 1% rule +2.6/10.0
- Appreciation +2.5/10.0
- Rent growth +2.5/5.0
- Condition / age +2.5/5.0
- Schools +2.2/10.0
$229,900
🖨 Deal sheet (PDF) 📄 Offer letter ✓ Due diligence
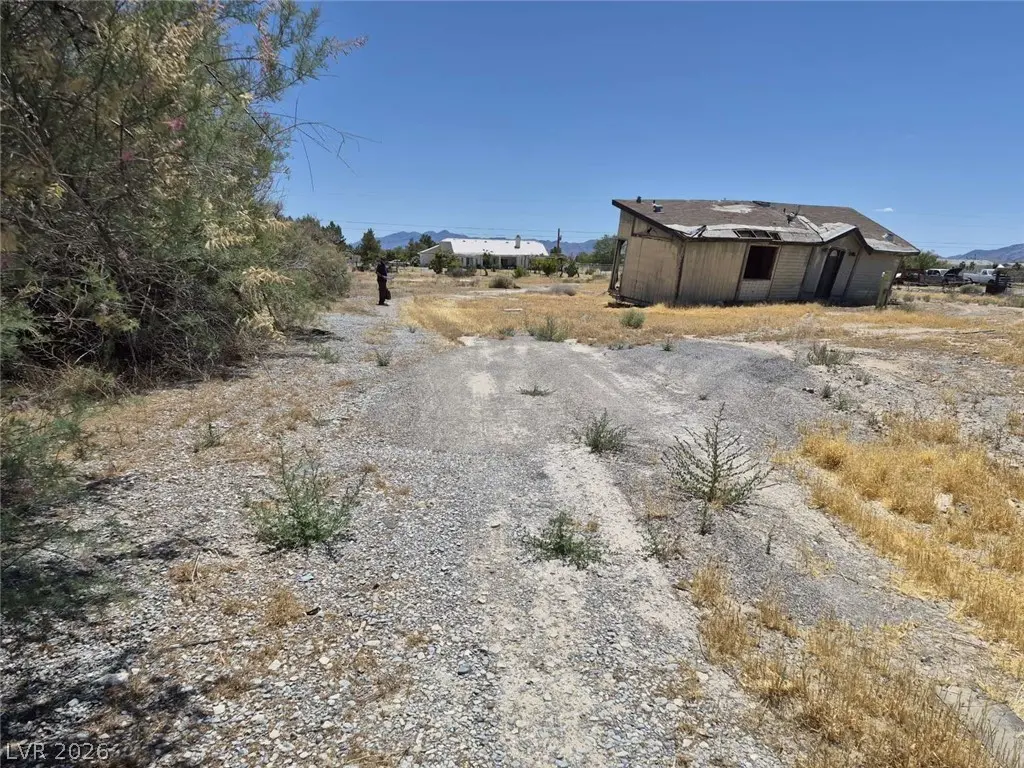
Listing remarks
Incredible opportunity in Pahrump! This property spans 2.5 acres of spacious desert land, offering a blank canvas with immense potential for investors or visionaries. An older structure on-site is partially dismantled, clearing the way for your new plans. The existing structure features an all-electric setup, functioning electricity, and a recently leveled foundation. Bring your creative vision to completely reimagine the interior spaces, flooring, countertops, and baths. Perfect for anyone looking to build equity or customize a desert retreat from the ground up.
Key facts
- All-electric setup
- 2.5 acres of land
- 2.42 acre lot
Tags
Property features AI
Finance
- Financial info: Lease amount listed at $970
Exterior
- Parking: Open parking
- Utilities: Electricity available; Septic available (septic tank installed); Community/coop water and shared well
- Home design: Single-story home; Resale property
- Construction: Composition/shingle roof; Resale construction (year built details listed as resale)
- Exterior features: No notable exterior features listed; Property faces south; One to five acre lot; approximately 2.418 acres; Zoned for single family
Interior
- Kitchen: Tile flooring in kitchen
- Bedrooms: 3 possible bedrooms; Bedroom 3 with built-in shelves and closet (approx. 12 x 12); Bedroom 2 with closet (approx. 8 x 12); Third bedroom/room with closet (approx. 18 x 12)
- Flooring: Hardwood floors
- Bathrooms: 2 full bathrooms
- Heating & cooling: Central heating (electric); Central air conditioning (electric)
- Interior features: Unfurnished; Bedroom on main level; Primary bedroom downstairs; Built-in shelves
Neighborhood map
What this means for you Summary
Snapshot
- This is a 3-bed/2.0-bath manufactured listed at $230k.
Deal economics
- At list price, monthly cash flow is $-1 ($-9/yr) — negative.
- To cash-flow at today's rent, offer at most $230k (0.1% below list).
- To meet the 1% rule (rent ≥ 1% of price), the offer needs to be $175k (23.8% below list).
- Recommended offer: $175k (23.8% below list) — sets the bar for 1% rule.
- Cap rate 6.3% vs local median 3.4% in Pahrump — top-decile yield for the area; either an underpriced asset or a hidden risk that comps aren't pricing in. Stress-test before assuming the spread holds.
Location & tenants
- Location reads 68/100 on livability (#30 in NV) — a middle-class / working-renter tenant base. Strengths: cost of living A+, housing A+, health & safety A+; Watch: employment D, crime F, amenities F.
- Nye County School District (rural): math 20% / reading 33% proficiency, ranked #16 of 17 in NV (top 94%) — low school quality limits family demand, transient renter base, plan for 1-2y turnover.
- Zoned schools: Manse Elementary School (math 21% / reading 36%, grade F, #214 of 402 statewide, top 53%, 515 students, 100% FRL); Rosemary Clarke Middle School (math 20% / reading 31%, grade F, #62 of 109 statewide, top 58%, 1,060 students, 100% FRL); Pahrump Valley High School (math 14% / reading 41%, grade F, #74 of 131 statewide, top 56%, 1,362 students, 100% FRL) — zoned schools average 100% FRL vs 54% district-wide (46 pts higher); higher-poverty schools than district average — tighter screening recommended.
- Market conditions: 657 active listings in the ZIP; 1 comparable units currently listed for rent nearby.
- This rent runs 42% of the median local income ($50k/yr) — at the standard rent-burdened threshold; future hikes will face affordability resistance.
Forward outlook
- Local home prices are declining (-3.0%/yr); year-one equity from $2k of loan paydown is wiped out by about $7k of value loss. Plan a longer hold.
- Nye County population projected at -28% by 2050 — secular population decline; favor cash flow + early exit over multi-decade hold.
Negotiation context
- It's been on market 17 days — a 2% lower offer ($226k) is reasonable based on typical stale-listing flexibility.
- Current owner paid $36k; list at $230k implies a 539% gain — meaningful room to come down on a strong offer.
Risks & watch-outs
- Climate carrying-cost: moderate wildfire risk; extreme-heat days projected 7→18/yr by 2055 (HVAC capex compounding) — expect insurance premiums to compound above CPI over the hold.
Questions for the listing agent
- What do current leases actually rent for vs. the listed asking? Can we see a recent rent roll and the last 12 months of T-12 income?
- Is there a deadline driving the sale (1031 exchange, divorce, estate, relocation)? That informs how much negotiation room exists.
- Schools are F-rated, which usually means shorter tenancies and higher turnover. Who's the typical renter profile here, and what's been the actual vacancy rate?
- Crime grade is F in this area — have there been break-ins, vandalism, or insurance claims at this property in the last 3 years? What carrier currently insures it and at what premium?
- The area grade is low — what's the realistic commute time and amenity access for the typical tenant pool here? Any planned neighborhood developments (good or bad) we should know about?
- What's the average days-on-market for RENTAL listings here right now (not sales)? A rising rental-DOM trend means longer vacancies and softer asking-rent achievability than the comps imply.
- What's the recent tenant-quality profile in this submarket — average credit score on applications, eviction rate, late-payment / NSF rate, and stable-employment percentage? A property-management company in the area should have these aggregated.
- How much new for-sale + rental construction is in the pipeline within 1–3 miles? Heavy new supply typically softens prices + rents 12–24 months out; constrained supply supports both.
Investment metrics
- 1% rule
- 0.76% ✗
- Cap rate
- 6.29%
- Cash-on-cash
- -0.01%
- DSCR
- 1.00
- GRM
- 10.9
CMA / ARV
- ARV (on-the-fly)
- $273,240
- Comps found
- 6
Show comp detail 6 sales within ~0.75 mi
| Address | Dist | Beds/Ba | Sqft | Sold | Price | $/sf | Match |
|---|---|---|---|---|---|---|---|
| 2140 Appaloosa Ln | 0.41mi | 3/1.5 | 1,152 (-3%) | 14mo | $125,000 | $109 | 62 |
| 2740 N Chanele Cir | 0.42mi | 3/2.0 | 1,154 (-3%) | 24mo | $264,950 | $230 | 56 |
| 1711 Royal Ave | 0.62mi | 3/2.0 | 1,120 (-6%) | 7mo | $100,000 | $89 | 56 |
| 2111 W Mesquite Ave | 0.37mi | 3/2.0 | 1,350 (+14%) | 8mo | $178,000 | $132 | 53 |
| 1761 W Greta Blvd | 0.51mi | 2/2.0 (-1) | 1,068 (-10%) | 20mo | $248,000 | $232 | 38 |
| 2340 Stardust St | 0.54mi | 2/2.0 (-1) | 1,038 (-13%) | 18mo | $295,500 | $285 | 34 |
Match score weights: distance 35% · size 25% · config 20% · recency 20%. Top-matched comps best support the ARV.
Projected returns pro-forma
-3.0% appreciation · 3.0% rent growth · sell at horizon
- IRR
- -16.4%
- Equity multiple
- 0.42×
- Total profit
- $-37,402
- Equity at exit
- $34,279
- IRR
- -8.2%
- Equity multiple
- 0.49×
- Total profit
- $-33,035
- Equity at exit
- $19,878
Cash invested: $64,372 (down + closing). Projections, not guarantees.
Landlord ↔ Tenant lean methodology
- Overall (STATE)
- 71 Landlord-Friendly
- State Nevada
- 71 Landlord-Friendly · R+1
- County
- — inherits STATE
- City
- — inherits STATE
ZIP-level market 89060
- Home prices YoY
- -1.6%
- Active inventory
- 657
- Price-to-rent
- 10.9×
Monthly cashflow live
- Estimated rent
- $1,752 medium interval (Pro) →
- Mortgage (P&I)
- −$1,206
- Tax from tax record
- −$84 /mo · $1,003/yr
- Insurance
- −$96
- HOA
- −$0
- Vacancy / Maint / Mgmt
- −$368
- Net cashflow
- $-1
Break-even live
Sensitivity live
| Price | -10% $129 | -5% $64 | +0% $-1 | +5% $-66 | +10% $-131 |
|---|---|---|---|---|---|
| Rent | -10% $-139 | -5% $-70 | +0% $-1 | +5% $68 | +10% $138 |
| Rate | -1.0pp $115 | -0.5pp $58 | base $-1 | +0.5pp $-60 | +1.0pp $-121 |
UW: 25.0% down · 7.5% · 30yr · 1.5% tax · 5.0% vac · 8.0% maint · 8.0% mgmt
Financing live
Cash to close
- Down payment
- $57,475
- Closing costs
- $6,897
- Reserves months
- —
- Total cash needed
- —
Loan-product check · same deal, 3 products live
Conventional
25% down · 7.5% · 30yr
- Down + closing
- —
- Monthly P&I
- —
- Monthly cashflow
- —
- DSCR
- —
- Eligible?
- —
Personal DTI + credit; lowest rate.
DSCR
20% down · 8.5% · 30yr
- Down + closing
- —
- Monthly P&I
- —
- Monthly cashflow
- —
- DSCR
- —
- Eligible?
- —
No personal income docs; deal must DSCR.
Hard money
10% down · 12.0% · 12mo
- Down + closing
- —
- Monthly P&I
- —
- Monthly cashflow
- —
- DSCR
- —
- Eligible?
- —
Short-term bridge; refi at stabilization.
Rent comps 1 comps
| Address | Beds | Baths | Sqft | Rent | $/sqft | DOM | Units | Dist |
|---|---|---|---|---|---|---|---|---|
| 2120 McMurray Dr Unit 7 Pahrump, NV | 2.0 | 2.0 | 1200 | $1,295 | $1.08 | 45d | 1 | 1.42mi |
Listing history 12 events
-
2026-06-22days on market $229,900 Active 17 DOM
-
2026-06-19days on market $229,900 Active 14 DOM
-
2026-06-18days on market $229,900 Active 13 DOM
-
2026-06-17days on market $229,900 Active 12 DOM
-
2026-06-16days on market $229,900 Active 11 DOM
-
2026-06-15days on market $229,900 Active 10 DOM
-
2026-06-14days on market $229,900 Active 8 DOM
-
2026-06-12days on market $229,900 Active 7 DOM
-
2026-06-09days on market $229,900 Active 4 DOM
-
2026-06-08days on market $229,900 Active 3 DOM
-
2026-06-07remarks 569-char remark
-
2026-06-07$229,900 Active 2 DOM
ⓘ Source: listings_history table (triggers on properties + properties_extension) + one-shot
backfill from property_details.listing_events for pre-trigger history.
Tax reassessment forecast NV · Resets to sale price
- Current annual tax
- $1,003 · $84/mo
- Projected year-2 tax
- $1,356 · $113/mo
- Expected delta
- +$354/yr (+$29/mo · 35.3%)
ⓘ Screening estimate from a state-policy table — verify with the county assessor before closing.
Climate risk First Street
- Flood 1/10 Low FEMA zone X (shaded) · 0% chance over 30 yrs
- Wildfire 5/10 Major
- Heat 7/10 Severe 7 d/yr ≥103°F today · 18 d/yr by 30 yrs out
- Wind 1/10 Low
- Air quality 1/10 Low 0 unhealthy d/yr today · 0 by 30 yrs out
Nearby sold comps map
Loading sold comps map…
Walkable amenities ~0.75 mi
Loading nearby amenities…
Taxation est. · year 1
- Rental income
- $21,026
- − Mortgage interest
- −$12,878
- − Property taxes
- −$1,003
- − Insurance
- −$1,150
- − Repairs & maintenance
- −$1,682
- − Management
- −$1,682
- − Depreciation
- −$6,688
- Taxable loss
- −$4,057
- Est. tax savings @ 24.0%
- +$974
- After-tax cash flow
- $964/yr
For passive investors: Depreciation is non-cash, so a rental often shows a tax loss while cash-flowing — sheltering income. Rental losses are passive: they offset passive income freely, and up to $25,000/yr can offset ordinary (W-2) income if you actively participate and your MAGI is under $100k (phasing out to $0 by $150k); unused losses carry forward. On sale, claimed depreciation is recaptured at up to 25%, and gains may owe capital-gains tax (a 1031 exchange can defer both). Figures are a year-1 estimate at your 24.0% rate — not tax advice; consult a CPA.
Schools (NCES district)
- District
- Nye County School District
- NCES district ID
- 3200360
- Math proficiency
- 20% ▼ -6.00%
- Reading proficiency
- 33% ▼ -5.00%
- Median HH income
- $41,447
- Composite
- 22.43/100
- National rank
- #8110
- State rank
- #16 of 17 in NV
Livability — Pahrump
- Score
- 68/100
- State rank
- #30
- US rank
- #9226
Category grades
Schools grade is shown separately in the Schools card above.
Census & demographics
- Census place
- Pahrump, NV
- County
- Nye County · 47,491 people
- City population
- 47,491
- Metro
- Pahrump, NV
- Population (ZIP)
- 12,864
- Household income
- $50,000
- Rent vs Own
- Severe rent burden
- 170.0
Population outlook (Nye County) Hauer SSP2
- Today (2025)
- 40,727 people
- By 2030
- 38,812 · -4.7%
- By 2040
- 33,952 · -16.6%
- By 2050
- 29,393 · -27.8%
- By 2075
- 21,122 · -48.1%
- By 2100
- 14,400 · -64.6%
Race, ethnicity, and origin ACS 2023
- Neighborhood character
- Predominantly White (71%)
- Race & ethnicity
- White 71% Hispanic / Latino 20% Two or more races 12% Asian 2% Black 1% Pacific Islander 1%
- Hispanic origin (detail)
- Mexican 16%
- Common ancestry
- Iranian 4% Romanian 3% Lithuanian 2%
- Foreign-born
- 9% · Canada, China
- Languages at home
- 85% English-only · Spanish 12% Other Indo-European 1% German/W. Germanic 1%
Political lean MEDSL · Nye
- 2024 margin
- Solid R (+42.2) · D 28.0% · R 70.2% · Other 1.8%
- 2008→2024 swing
- -28.8pp toward R · 2008: -13.4pp · 2024: -42.2pp
- All cycles
- 2024: R+42.2 2020: R+40.4 2016: R+42.0 2012: R+24.2 2008: R+13.4
Not yet ingested
- Civics
- —
Market trends
- HPI YoY
- ▼ -4.93%
- Current HPI
- 312.3758
- Rent YoY
- —
- Metro
- Pahrump, NV
- State GDP YoY
- ▲ 3.08%
- F500 in state
- 6
Industry mix (Fortune 500 HQ in NV)
| Industry | F500 HQs | Revenue |
|---|---|---|
| Hotels / Casinos | 3 | $36B |
|
||
Price history
+538.6% since first listed2 events — show timeline
- 2026-06-05 Listed $229,900 GLVAR
- 2001-10-11 Sold (Public Records) $36,000 Public Records
Property tax history
-1.5%/yrLatest (2025): $1,003 · +3.4% YoY. Source: county tax records.
Cash-flow waterfall
monthlySold comps — $/sqft
last 12 mo · ≤1 miLoading sold comps…