 Multi-family
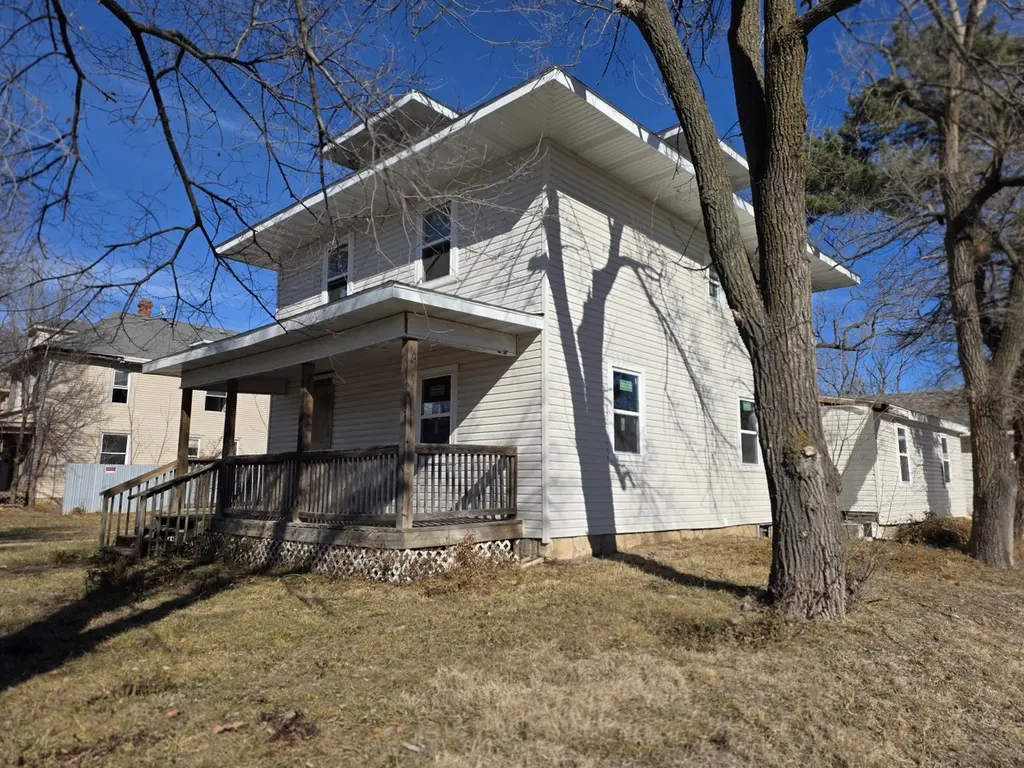
1502 N Grant Ave · Springfield, MO
Flood risk 1/10 · Minimal
- FEMA flood zone
- X (unshaded)
- Chance of flooding over 30 yrs
- 0.0%
- Est. flood insurance / yr
- $473 – $860
Fire risk 1/10 · Minimal
- Est. fire insurance / yr
- $1,054 – $1,958
Heat risk 5/10 · Moderate
- Hot days now (above 104°F)
- 7 days/yr
- Hot days in 30 yrs
- 18 days/yr
Wind risk 2/10 · Minimal
- Chance of severe wind over 30 yrs
- —
Air-quality risk 2/10 · Minimal
- Unhealthy air days now
- 1 days/yr
- Unhealthy air days in 30 yrs
- 2 days/yr
Risk factors via First Street. Map © Google.
Why this score? — see what drove the C+ grade
The composite is a weighted blend of 9 inputs, each scored 0–100. Each bar is that input's sub-score; the figure is the points it added to the 100-point composite (weight × sub-score).
- Cash flow +30.0/30.0
- 1% rule +10.0/10.0
- DSCR +10.0/10.0
- Livability +3.8/5.0
- Condition / age +3.8/5.0
- Rent growth +3.6/5.0
- Schools +3.2/10.0
- ARV discount +0.0/15.0
- Appreciation +0.0/10.0
$375,000
🖨 Deal sheet 📄 Offer letter ✓ Due diligence
Multi-family units
County records classify this as Multi-Family (5+ Unit). Listing-text estimate: 1 unit. estimate disagrees with records
5+ unit building — per-unit beds/baths from public records are typically unavailable; the breakdown below (if shown) is an estimate from the listing text.
Listing remarks
Completely Remodeled Exterior and Gutted down to the studs, Zoned Med Density MF 7 Units or 11BR Group housing Project. See attached Zoning for guidelines. Over 100 Million in development within 3 Block Radius. Located Near Price Cutter Dollar General and Historic Commercial St and Cox Hospital. Owner is Selling due to Health Reasons.
Key facts
- Remodeled exterior
- Zoned med density mf
- 9,583 sq ft lot
Tags
Property features AI
Finance
- Other: Zoned for multi-family
- Financial info: Annual tax amount listed
Exterior
- Parking: Attached garage; 2 garage spaces
- Utilities: Public water; Public sewer
- Home design: Residential income property; Duplex
- Exterior features: Corner lot (corner of Grant and Division); Subdivision: Jenkins
Interior
- Heating & cooling: No central heating; No central cooling
- Interior features: Has a view
Neighborhood map
What this means for you Summary
Snapshot
- This is a 11-bed/?-bath multifamily listed at $375k. Condition is rated good.
Deal economics
- At list price, monthly cash flow is $2k ($27k/yr) — positive.
- The deal already cash-flows at list — no discount required.
- Meets the 1% rule at list price ($6k rent vs $375k).
- Recommended offer: $341k (9.0% below list) — sets the bar for market timing.
- Cap rate 13.4% vs local median 4.6% in Springfield — top-decile yield for the area; either an underpriced asset or a hidden risk that comps aren't pricing in. Stress-test before assuming the spread holds.
Location & tenants
- Location reads 75/100 on livability (#57 in MO, #4,121 nationally) — a middle-class / working-renter tenant base. Strengths: commute A+, cost of living A+, housing A+; Watch: crime F, employment F.
- Springfield R-XII (urban): math 32% / reading 46% proficiency, ranked #174 of 324 in MO (top 54%) — families likely to look elsewhere, expect single-tenant / working-renter base with shorter leases.
- Zoned schools: Weaver Elem. (math 27% / reading 47%, grade F, #611 of 1,115 statewide, top 59%, 224 students, 91% FRL); Central High (math 42% / reading 62%, grade D+, #92 of 521 statewide, top 20%, 1,464 students, 51% FRL) — zoned schools average 71% FRL vs 46% district-wide (25 pts higher); higher-poverty schools than district average — tighter screening recommended.
- Market conditions: Rents rising fast (+4.2%/yr); 394 active listings in the ZIP; 1,302 units permitted in Greene County in 2024 (250 in 5+ unit buildings).
- At $6,079/mo this rent would consume 144% of the median local household income ($51k/yr) (locally 1305% of renters already pay >50% of income on rent) — very limited rent-growth headroom before tenants either downsize or default.
Forward outlook
- Local home prices are declining (-3.0%/yr); year-one equity from $3k of loan paydown is wiped out by about $11k of value loss. Plan a longer hold.
- Greene County population projected at +25% by 2050 — long-run rental-demand tailwind backs the buy-and-hold thesis.
- At projected returns (-3.0% appreciation + 4.2% rent growth), your $105k cash investment doubles in ~5 years — after that, you're playing with house money.
Negotiation context
- It's been on market 120 days — a 9% lower offer ($341k) is reasonable based on typical stale-listing flexibility.
Risks & watch-outs
- Watch-outs: built in 1918 — expect roof / HVAC / electrical / plumbing capex.
- Climate carrying-cost: extreme-heat days projected 7→18/yr by 2055 (HVAC capex compounding) — expect insurance premiums to compound above CPI over the hold.
Questions for the listing agent
- It's been on market 120 days. Have you received any prior offers? Is the seller open to a 9% concession, seller financing, or rate buy-down credit?
- Built in 1918 — when were the roof, HVAC, electrical panel, plumbing, and water heater last replaced?
- Why hasn't it sold? Are there any deal-killer items the seller is aware of (foundation, flood, title, zoning, code violations)?
- Is there a deadline driving the sale (1031 exchange, divorce, estate, relocation)? That informs how much negotiation room exists.
- Crime grade is F in this area — have there been break-ins, vandalism, or insurance claims at this property in the last 3 years? What carrier currently insures it and at what premium?
- What's the average days-on-market for RENTAL listings here right now (not sales)? A rising rental-DOM trend means longer vacancies and softer asking-rent achievability than the comps imply.
- What's the recent tenant-quality profile in this submarket — average credit score on applications, eviction rate, late-payment / NSF rate, and stable-employment percentage? A property-management company in the area should have these aggregated.
- How much new apartment / multifamily construction is in the pipeline within 1–3 miles? Heavy new supply (>2% of stock underway) typically softens rents 12–24 months out; light construction supports rent growth.
Investment metrics
- 1% rule
- 1.62% ✓
- Cap rate
- 13.37%
- Cash-on-cash
- 25.27%
- DSCR
- 2.12
- GRM
- 5.1
CMA / ARV
- ARV (median comp)
- $300,056
- List price
- $375,000
- Delta
- 24.98%
- Verdict
- OVERPRICED
- Comps
- 3 within 1.0 mi
Projected returns pro-forma
-3.0% appreciation · 4.24% rent growth · sell at horizon
- IRR
- 20.2%
- Equity multiple
- 1.84×
- Total profit
- $87,815
- Equity at exit
- $55,914
- IRR
- 29.3%
- Equity multiple
- 3.77×
- Total profit
- $290,469
- Equity at exit
- $32,423
Cash invested: $105,000 (down + closing). Projections, not guarantees.
Landlord ↔ Tenant lean methodology
- Overall (STATE)
- 81 Strongly Landlord-Friendly
- State Missouri
- 81 Strongly Landlord-Friendly · R+10
- County
- — inherits STATE
- City
- — inherits STATE
ZIP-level market 65803
- Home prices YoY
- -29.8%
- Rents YoY
- 4.2%
- Active inventory
- 394
- Price-to-rent
- 36.0×
Monthly cashflow live
- Estimated rent
- $6,079 high interval (Pro) →
- Mortgage (P&I)
- −$1,967
- Tax est. 1.5%
- −$469 /mo · $5,625/yr
- Insurance
- −$156
- HOA
- −$0
- Vacancy / Maint / Mgmt
- −$1,277
- Net cashflow
- $2,211
Break-even live
7-unit breakdown (identical units grouped — click to expand)
| Units | Beds | Baths | Est. rent |
|---|---|---|---|
| 7× units | 1 | 1 | $6,076 |
| #1 | 1 | 1 | $868 |
| #2 | 1 | 1 | $868 |
| #3 | 1 | 1 | $868 |
| #4 | 1 | 1 | $868 |
| #5 | 1 | 1 | $868 |
| #6 | 1 | 1 | $868 |
| #7 | 1 | 1 | $868 |
| Total (7 units) | $6,079 | ||
UW: 25.0% down · 7.5% · 30yr · 1.5% tax · 5.0% vac · 8.0% maint · 8.0% mgmt
Financing live
Cash to close
- Down payment
- $93,750
- Closing costs
- $11,250
- Reserves months
- —
- Total cash needed
- —
Loan-product check · same deal, 3 products live
Conventional
25% down · 7.5% · 30yr
- Down + closing
- —
- Monthly P&I
- —
- Monthly cashflow
- —
- DSCR
- —
- Eligible?
- —
Personal DTI + credit; lowest rate.
DSCR
20% down · 8.5% · 30yr
- Down + closing
- —
- Monthly P&I
- —
- Monthly cashflow
- —
- DSCR
- —
- Eligible?
- —
No personal income docs; deal must DSCR.
Hard money
10% down · 12.0% · 12mo
- Down + closing
- —
- Monthly P&I
- —
- Monthly cashflow
- —
- DSCR
- —
- Eligible?
- —
Short-term bridge; refi at stabilization.
Listing history 16 events
-
2026-06-18days on market $375,000 Active 120 DOM
-
2026-06-17days on market $375,000 Active 119 DOM
-
2026-06-16days on market $375,000 Active 118 DOM
-
2026-06-15days on market $375,000 Active 117 DOM
-
2026-06-14days on market $375,000 Active 115 DOM
-
2026-06-10days on market $375,000 Active 112 DOM
-
2026-06-09days on market $375,000 Active 111 DOM
-
2026-06-08days on market $375,000 Active 110 DOM
-
2026-06-07days on market $375,000 Active 109 DOM
-
2026-06-03days on market $375,000 Active 105 DOM
-
2026-06-02days on market $375,000 Active 104 DOM
-
2026-06-01days on market $375,000 Active 103 DOM
-
2026-05-31days on market $375,000 Active 102 DOM
-
2026-05-30days on market $375,000 Active 101 DOM
-
2026-04-15price $375,000
-
2026-02-18$395,000 Active
ⓘ Source: listings_history table (triggers on properties + properties_extension) + one-shot
backfill from property_details.listing_events for pre-trigger history.
Climate risk First Street
- Flood 1/10 Low FEMA zone X (unshaded) · 0% chance over 30 yrs
- Wildfire 1/10 Low
- Heat 5/10 Major 7 d/yr ≥104°F today · 18 d/yr by 30 yrs out
- Wind 2/10 Low
- Air quality 2/10 Low 1 unhealthy d/yr today · 2 by 30 yrs out
Nearby sold comps map
Loading sold comps map…
Walkable amenities ~0.75 mi
Loading nearby amenities…
Taxation est. · year 1
- Rental income
- $72,948
- − Mortgage interest
- −$21,006
- − Property taxes
- −$5,625
- − Insurance
- −$1,875
- − Repairs & maintenance
- −$5,836
- − Management
- −$5,836
- − Depreciation
- −$10,909
- Taxable income
- $21,861
- Est. tax owed @ 24.0%
- −$5,247
- After-tax cash flow
- $21,284/yr
For passive investors: Depreciation is non-cash, so a rental often shows a tax loss while cash-flowing — sheltering income. Rental losses are passive: they offset passive income freely, and up to $25,000/yr can offset ordinary (W-2) income if you actively participate and your MAGI is under $100k (phasing out to $0 by $150k); unused losses carry forward. On sale, claimed depreciation is recaptured at up to 25%, and gains may owe capital-gains tax (a 1031 exchange can defer both). Figures are a year-1 estimate at your 24.0% rate — not tax advice; consult a CPA.
Condition & rehab AI · 12 photos
This property is in good condition with a gut renovation in progress. It offers significant potential for value increase through comprehensive interior finishing and updates.
Repairs flagged
- Minor Exterior siding — Some areas may need touch-up paint.
- Major Interior walls — Exposed framing indicates extensive renovation needed.
Value-add opportunities
- Both Complete interior finishing and drywall installation — Creates move-in ready condition, ideal for both resale and rental.
- Both Kitchen and bathroom updates — Modern kitchens and bathrooms attract more buyers and renters.
- Both Landscaping and curb appeal improvements — Enhances property's visual appeal and marketability.
- Both HVAC and mechanical updates — Ensures comfort and energy efficiency, important for both buyers and renters.
Renovation cost estimate screening
| Repair item | Severity | Est. cost |
|---|---|---|
| Exterior siding · Some areas may need touch-up paint. | Minor | $500–3,000 |
| Interior walls · Exposed framing indicates extensive renovation needed. | Major | $15,000–50,000 |
| Total estimated repair cost · 2 items | $15,500–53,000 |
Value-add ROI direction
- Both Complete interior finishing and drywall installation — Creates move-in ready condition, ideal for both resale and rental. ↑
- Both Kitchen and bathroom updates — Modern kitchens and bathrooms attract more buyers and renters. ↑
- Both Landscaping and curb appeal improvements — Enhances property's visual appeal and marketability. ↑
- Both HVAC and mechanical updates — Ensures comfort and energy efficiency, important for both buyers and renters. ↑
ⓘ Cost ranges are severity-bucket heuristics (US national rule-of-thumb). Get contractor quotes + a written scope before underwriting a rehab budget.
Schools (NCES district)
- District
- Springfield R-XII
- NCES district ID
- 2928860
- Math proficiency
- 32% ▼ -2.00%
- Reading proficiency
- 46% ▼ -3.00%
- Median HH income
- $37,886
- Composite
- 32.45/100
- National rank
- #5717
- State rank
- #174 of 324 in MO
Livability — Springfield
- Score
- 75/100
- State rank
- #57
- US rank
- #4121
Category grades
Schools grade is shown separately in the Schools card above.
Census & demographics
- Census place
- Springfield, MO
- County
- Greene County · 244,327 people
- City population
- 223,044
- Metro
- Springfield, MO
- Population (ZIP)
- 42,882
- Household income
- $50,572
- Rent vs Own
- Severe rent burden
- 1305.0
Population outlook (Greene County) Hauer SSP2
- Today (2025)
- 319,054 people
- By 2030
- 335,135 · +5.0%
- By 2040
- 366,186 · +14.8%
- By 2050
- 397,431 · +24.6%
- By 2075
- 477,035 · +49.5%
- By 2100
- 520,828 · +63.2%
Race, ethnicity, and origin ACS 2023
- Neighborhood character
- Predominantly White (82%)
- Race & ethnicity
- White 82% Two or more races 9% Hispanic / Latino 6% Black 4%
- Hispanic origin (detail)
- Mexican 2% Puerto Rican 2%
- Common ancestry
- Lithuanian 2% Italian 2% Iranian 2%
- Foreign-born
- 3% · Canada
- Languages at home
- 95% English-only · Spanish 3%
Political lean MEDSL · Greene
- 2024 margin
- Strong R (+20.8) · D 38.9% · R 59.7% · Other 1.4%
- 2008→2024 swing
- -5.0pp toward R · 2008: -15.8pp · 2024: -20.8pp
- All cycles
- 2024: R+20.8 2020: R+20.1 2016: R+27.4 2012: R+24.4 2008: R+15.8
Not yet ingested
- Civics
- —
Market trends
- HPI YoY
- ▼ -87.08%
- Current HPI
- 205.0439
- Rent YoY
- ▲ 4.24%
- Metro
- Springfield, MO
- State GDP YoY
- ▲ 1.84%
- F500 in state
- 20
Industry mix (Fortune 500 HQ in MO)
| Industry | F500 HQs | Revenue |
|---|---|---|
| Healthcare | 1 | $163B |
|
||
| Insurance | 1 | $21B |
|
||
| Industrial Technology | 1 | $17B |
|
||
| Retail | 1 | $16B |
|
||
| Industrial Distribution | 1 | $10B |
|
||
| Utilities | 1 | $9B |
|
||
Price history
-5.1% since first listed2 events — show timeline
- 2026-04-15 Price Changed $375,000 SOMO
- 2026-02-18 Listed $395,000 SOMO
Cash-flow waterfall
monthlySold comps — $/sqft
last 12 mo · ≤1 miLoading sold comps…