1145 E Barham Dr Spc 260 · San Marcos, CA
Flood risk 1/10 · Minimal
- FEMA flood zone
- X (unshaded)
- Chance of flooding over 30 yrs
- 0.0%
- Est. flood insurance / yr
- $507 – $1,088
Fire risk 5/10 · Moderate
- Est. fire insurance / yr
- $659 – $1,223
Heat risk 4/10 · Minor
- Hot days now (above 98°F)
- 7 days/yr
- Hot days in 30 yrs
- 22 days/yr
Wind risk 1/10 · Minimal
- Chance of severe wind over 30 yrs
- —
Air-quality risk 4/10 · Minor
- Unhealthy air days now
- 5 days/yr
- Unhealthy air days in 30 yrs
- 5 days/yr
Risk factors via First Street. Map © Google.
Why this score? — see what drove the C+ grade
The composite is a weighted blend of 9 inputs, each scored 0–100. Each bar is that input's sub-score; the figure is the points it added to the 100-point composite (weight × sub-score).
- Cash flow +23.6/30.0
- ARV discount +9.3/15.0
- DSCR +7.6/10.0
- 1% rule +6.1/10.0
- Schools +5.4/10.0
- Livability +3.9/5.0
- Rent growth +2.6/5.0
- Condition / age +2.5/5.0
- Appreciation +0.0/10.0
$279,000
🖨 Deal sheet 📄 Offer letter ✓ Due diligence
Listing remarks MLS
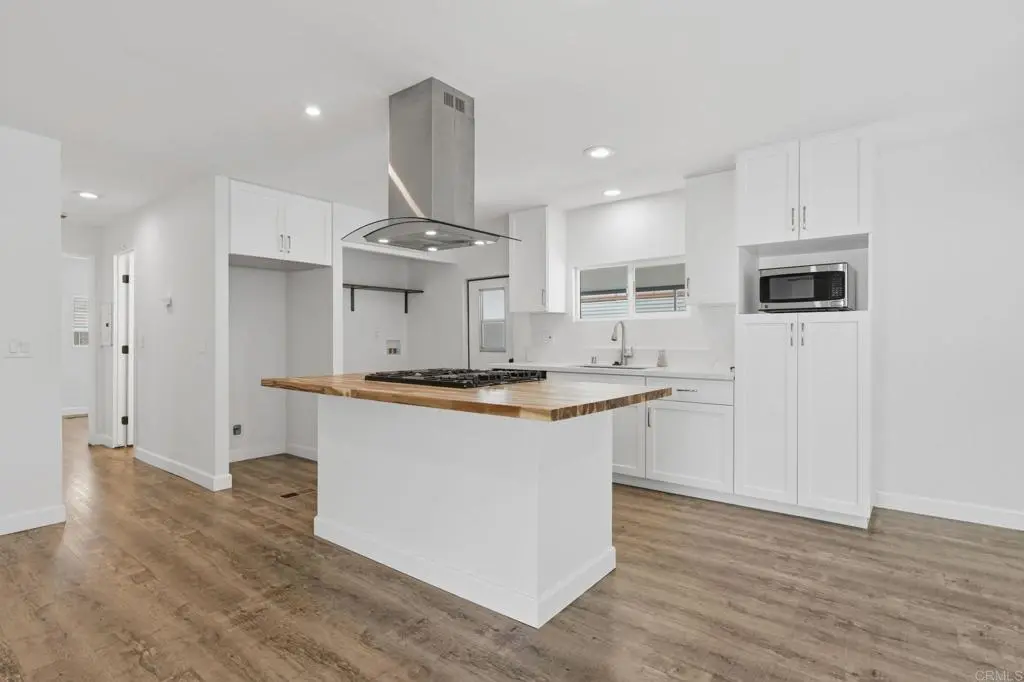
Beautifully remodeled home in San Marcos Mobile Estates. Located high on the hill with no one behind. Great open floorplan with modern updates. New vinyl plank flooring, butcher block kitchen island with gas stove and hood. Farmhouse sink with quarts counters. This home stays comfortable in the summer and winter with dual pained windows, new insulation and fresh acrylic coat on roof. The master bedroom has a barn door leading to a new walk in shower and new sink and toilet. Guest bathroom has been remodeled with quartz counters and new tub. The remodel included drywall, light switched, ceiling fans, paint, light fixtures, recess lighting and more! There is a large front yard, nice side patio and back yard with shed! This home is close to shopping, Costco and Kaiser hospital. Financing available!
Key facts
- Quartz counters
- Dual pained windows
- Farmhouse sink
Tags
Neighborhood map
What this means for you Summary
Snapshot
- This is a 2-bed/2.0-bath manufactured listed at $279k.
Deal economics
- At list price, monthly cash flow is $527 ($6k/yr) — positive.
- The deal already cash-flows at list — no discount required.
- Meets the 1% rule at list price ($3k rent vs $279k).
- Recommended offer: $262k (6.0% below list) — sets the bar for market timing.
- Cap rate 8.6% vs local median 2.5% in San Marcos — top-decile yield for the area; either an underpriced asset or a hidden risk that comps aren't pricing in. Stress-test before assuming the spread holds.
Location & tenants
- Location reads 77/100 on livability (#80 in CA, #3,074 nationally) — a middle-class / working-renter tenant base. Strengths: amenities A+, commute A+, employment A+; Watch: health & safety D+, cost of living F.
- San Marcos Unified (suburban): math 52% / reading 67% proficiency, ranked #249 of 1,400 in CA (top 18%) — acceptable for families but not a draw, mixed tenant base, ~2y average lease.
- Market conditions: Rents flat; 232 active listings in the ZIP; 15 comparable units currently listed for rent nearby; rentals leasing fast (median 5d on market — plan ~1-2 weeks tenant-placement turnaround); high-income renter base; 11,759 units permitted in San Diego County in 2024 (7,244 in 5+ unit buildings).
- This rent runs 31% of the median local income ($120k/yr) — at the standard rent-burdened threshold; future hikes will face affordability resistance.
Forward outlook
- Local home prices are declining (-3.0%/yr); year-one equity from $2k of loan paydown is wiped out by about $8k of value loss. Plan a longer hold.
- San Diego County population projected at +20% by 2050 — long-run rental-demand tailwind backs the buy-and-hold thesis.
Negotiation context
- It's been on market 65 days — a 6% lower offer ($262k) is reasonable based on typical stale-listing flexibility.
Risks & watch-outs
- Climate carrying-cost: moderate wildfire risk — expect insurance premiums to compound above CPI over the hold.
Questions for the listing agent
- It's been on market 65 days. Have you received any prior offers? Is the seller open to a 6% concession, seller financing, or rate buy-down credit?
- Built in 1972 — when were the roof, HVAC, electrical panel, plumbing, and water heater last replaced?
- Why hasn't it sold? Are there any deal-killer items the seller is aware of (foundation, flood, title, zoning, code violations)?
- Is there a deadline driving the sale (1031 exchange, divorce, estate, relocation)? That informs how much negotiation room exists.
- What's the average days-on-market for RENTAL listings here right now (not sales)? A rising rental-DOM trend means longer vacancies and softer asking-rent achievability than the comps imply.
- What's the recent tenant-quality profile in this submarket — average credit score on applications, eviction rate, late-payment / NSF rate, and stable-employment percentage? A property-management company in the area should have these aggregated.
- How much new for-sale + rental construction is in the pipeline within 1–3 miles? Heavy new supply typically softens prices + rents 12–24 months out; constrained supply supports both.
Investment metrics
- 1% rule
- 1.11% ✓
- Cap rate
- 8.56%
- Cash-on-cash
- 8.10%
- DSCR
- 1.36
- GRM
- 7.5
CMA / ARV
- ARV (median comp)
- $290,760
- List price
- $279,000
- Delta
- -4.04%
- Verdict
- FAIR
- Comps
- 3 within 1.0 mi
Show comp detail 4 sales within ~0.75 mi
| Address | Dist | Beds/Ba | Sqft | Sold | Price | $/sf | Match |
|---|---|---|---|---|---|---|---|
| 1145 E Barham Dr #180 | 0.00mi | 2/2.0 | 1,056 (+10%) | 7mo | $145,000 | $137 | 78 |
| 1145 E Barham Dr #125 | 0.05mi | 2/2.0 | 1,008 (+5%) | 17mo | $215,000 | $213 | 75 |
| 1145 E Barham Dr #267 | 0.00mi | 2/2.0 | 1,100 (+15%) | 10mo | $295,000 | $268 | 67 |
| 1145 E Barham Dr #123 | 0.00mi | 2/1.0 | 1,070 (+12%) | 22mo | $285,000 | $266 | 58 |
Match score weights: distance 35% · size 25% · config 20% · recency 20%. Top-matched comps best support the ARV.
Projected returns pro-forma
-3.0% appreciation · 0.35% rent growth · sell at horizon
- IRR
- -7.0%
- Equity multiple
- 0.75×
- Total profit
- $-19,662
- Equity at exit
- $41,600
- IRR
- -1.1%
- Equity multiple
- 0.93×
- Total profit
- $-5,114
- Equity at exit
- $24,123
Cash invested: $78,120 (down + closing). Projections, not guarantees.
Landlord ↔ Tenant lean methodology
- Overall (STATE)
- 18 Strongly Tenant-Friendly
- State California
- 18 Strongly Tenant-Friendly · D+13
- County
- — inherits STATE
- City
- — inherits STATE
ZIP-level market 92078
- Rents YoY
- 0.3%
- Active inventory
- 232
- Price-to-rent
- 7.5×
Monthly cashflow live
- Estimated rent
- $3,108 high interval (Pro) →
- Mortgage (P&I)
- −$1,463
- Tax est. 1.5%
- −$349 /mo · $4,185/yr
- Insurance
- −$116
- HOA
- −$0
- Vacancy / Maint / Mgmt
- −$653
- Net cashflow
- $527
Break-even live
UW: 25.0% down · 7.5% · 30yr · 1.5% tax · 5.0% vac · 8.0% maint · 8.0% mgmt
Financing live
Cash to close
- Down payment
- $69,750
- Closing costs
- $8,370
- Reserves months
- —
- Total cash needed
- —
Loan-product check · same deal, 3 products live
Conventional
25% down · 7.5% · 30yr
- Down + closing
- —
- Monthly P&I
- —
- Monthly cashflow
- —
- DSCR
- —
- Eligible?
- —
Personal DTI + credit; lowest rate.
DSCR
20% down · 8.5% · 30yr
- Down + closing
- —
- Monthly P&I
- —
- Monthly cashflow
- —
- DSCR
- —
- Eligible?
- —
No personal income docs; deal must DSCR.
Hard money
10% down · 12.0% · 12mo
- Down + closing
- —
- Monthly P&I
- —
- Monthly cashflow
- —
- DSCR
- —
- Eligible?
- —
Short-term bridge; refi at stabilization.
Rent comps 15 comps
| Address | Beds | Baths | Sqft | Rent | $/sqft | DOM | Units | Dist |
|---|---|---|---|---|---|---|---|---|
| 1113 Privet St San Marcos, CA | 2.0 | 2.0 | 1008 | $2,595 | $2.57 | 24d | 1 | 0.47mi |
| 220 Woodland Pkwy #250 San Marcos, CA | 1.0 | 1.0 | 700 | $3,500 | $5.00 | 43d | 1 | 0.70mi |
| 218 Woodland Pkwy #146 San Marcos, CA | 2.0 | 2.0 | 908 | $2,900 | $3.19 | 43d | 1 | 0.70mi |
| 852 Avenida Ricardo San Marcos, CA | 1.0–2.0 | 1.0–2.0 | 784 | $4,081 | $5.21 | 1d | 13 | 0.79mi |
| 570 E Barham Dr San Marcos, CA | 1.0–3.0 | 1.0–2.0 | 840 | $3,108 | $3.70 | 3d | 14 | 0.85mi |
| 506 E Barham Dr San Marcos, CA | 1.0–2.0 | 1.0–2.0 | 770 | $3,095 | $4.02 | 16d | 4 | 0.87mi |
| 823 Nordahl Rd San Marcos, CA | 1.0–3.0 | 1.0–2.0 | 887 | $2,808 | $3.17 | 2d | 1 | 0.89mi |
| 506 E Barham Dr Unit 230 San Marcos, CA | 2.0 | 2.0 | 900 | $3,095 | $3.44 | 3d | 1 | 0.90mi |
| 506 E Barham Dr Unit 224 San Marcos, CA | 2.0 | 2.0 | 900 | $2,895 | $3.22 | 2d | 1 | 0.90mi |
| 506 E Barham Dr Unit 130 San Marcos, CA | 2.0 | 2.0 | 900 | $2,975 | $3.31 | 2d | 1 | 0.90mi |
| 452 Lynwood Ln San Marcos, CA | 3.0 | 2.0 | 1000 | $3,250 | $3.25 | 43d | 1 | 0.92mi |
| 1898 Matin Cir #189 San Marcos, CA | 2.0 | 2.0 | 1001 | $3,195 | $3.19 | 43d | 1 | 1.02mi |
| 1412 Pine Heights Way San Marcos, CA | 2.0 | 2.0 | 1100 | $2,900 | $2.64 | 12d | 1 | 1.16mi |
| 250 N City Dr San Marcos, CA | 3.0 | 1.0–3.0 | 821 | $3,684 | $4.49 | 5d | 21 | 1.43mi |
| 975 Woodland Pkwy San Marcos, CA | 1.0–2.0 | 1.0–2.0 | 755 | $3,275 | $4.33 | 1d | 1 | 1.49mi |
Listing history 14 events
-
2026-06-18days on market $279,000 Active 65 DOM
-
2026-06-17days on market $279,000 Active 64 DOM
-
2026-06-16days on market $279,000 Active 63 DOM
-
2026-06-15days on market $279,000 Active 62 DOM
-
2026-06-13days on market $279,000 Active 60 DOM
-
2026-06-09days on market $279,000 Active 56 DOM
-
2026-06-08days on market $279,000 Active 55 DOM
-
2026-06-07days on market $279,000 Active 54 DOM
-
2026-06-04days on market $279,000 Active 51 DOM
-
2026-06-03days on market $279,000 Active 50 DOM
-
2026-06-02days on market $279,000 Active 49 DOM
-
2026-06-01days on market $279,000 Active 48 DOM
-
2026-05-31days on market $279,000 Active 47 DOM
-
2026-04-13$279,000 Active 807-char remark
Show marketing remark (807 chars)
Beautifully remodeled home in San Marcos Mobile Estates. Located high on the hill with no one behind. Great open floorplan with modern updates. New vinyl plank flooring, butcher block kitchen island with gas stove and hood. Farmhouse sink with quarts counters. This home stays comfortable in the summer and winter with dual pained windows, new insulation and fresh acrylic coat on roof. The master bedroom has a barn door leading to a new walk in shower and new sink and toilet. Guest bathroom has been remodeled with quartz counters and new tub. The remodel included drywall, light switched, ceiling fans, paint, light fixtures, recess lighting and more! There is a large front yard, nice side patio and back yard with shed! This home is close to shopping, Costco and Kaiser hospital. Financing available!
ⓘ Source: listings_history table (triggers on properties + properties_extension) + one-shot
backfill from property_details.listing_events for pre-trigger history.
Climate risk First Street
- Flood 1/10 Low FEMA zone X (unshaded) · 0% chance over 30 yrs
- Wildfire 5/10 Major
- Heat 4/10 Moderate 7 d/yr ≥98°F today · 22 d/yr by 30 yrs out
- Wind 1/10 Low
- Air quality 4/10 Moderate 5 unhealthy d/yr today · 5 by 30 yrs out
Nearby sold comps map
Loading sold comps map…
Walkable amenities ~0.75 mi
Loading nearby amenities…
Taxation est. · year 1
- Rental income
- $37,295
- − Mortgage interest
- −$15,628
- − Property taxes
- −$4,185
- − Insurance
- −$1,395
- − Repairs & maintenance
- −$2,984
- − Management
- −$2,984
- − Depreciation
- −$8,116
- Taxable income
- $2,003
- Est. tax owed @ 24.0%
- −$481
- After-tax cash flow
- $5,845/yr
For passive investors: Depreciation is non-cash, so a rental often shows a tax loss while cash-flowing — sheltering income. Rental losses are passive: they offset passive income freely, and up to $25,000/yr can offset ordinary (W-2) income if you actively participate and your MAGI is under $100k (phasing out to $0 by $150k); unused losses carry forward. On sale, claimed depreciation is recaptured at up to 25%, and gains may owe capital-gains tax (a 1031 exchange can defer both). Figures are a year-1 estimate at your 24.0% rate — not tax advice; consult a CPA.
Schools (NCES district)
- District
- San Marcos Unified
- NCES district ID
- 0634880
- Math proficiency
- 52% ▲ 1.00%
- Reading proficiency
- 67% ▲ 2.00%
- Median HH income
- $64,752
- Composite
- 53.67/100
- National rank
- #3093
- State rank
- #249 of 1400 in CA
Livability — San Marcos
- Score
- 77/100
- State rank
- #80
- US rank
- #3074
Category grades
Schools grade is shown separately in the Schools card above.
Census & demographics
- Census place
- San Marcos, CA
- County
- San Diego County · 3,178,799 people
- City population
- 100,940
- Metro
- San Diego-Chula Vista-Carlsbad, CA
- Population (ZIP)
- 53,605
- Household income
- $120,268
- Rent vs Own
- Severe rent burden
- 1594.0
Population outlook (San Diego County) Hauer SSP2
- Today (2025)
- 3,678,185 people
- By 2030
- 3,856,546 · +4.8%
- By 2040
- 4,171,407 · +13.4%
- By 2050
- 4,421,607 · +20.2%
- By 2075
- 4,831,599 · +31.4%
- By 2100
- 4,832,502 · +31.4%
Race, ethnicity, and origin ACS 2023
- Neighborhood character
- Diverse neighborhood (Simpson 0.62)
- Race & ethnicity
- White 53% Hispanic / Latino 28% Two or more races 17% Asian 10% Black 1%
- Hispanic origin (detail)
- Mexican 23%
- Common ancestry
- Italian 3% Slovak 3% Romanian 2%
- Foreign-born
- 19% · Canada, China, Vietnam
- Languages at home
- 73% English-only · Spanish 18% Other Indo-European 3% Chinese 1%
Political lean MEDSL · San Diego
- 2024 margin
- D (+16.8) · D 56.9% · R 40.1% · Other 2.9%
- 2008→2024 swing
- +6.6pp toward D · 2008: 10.2pp · 2024: 16.8pp
- All cycles
- 2024: D+16.8 2020: D+22.8 2016: D+17.8 2012: D+5.1 2008: D+10.2
Not yet ingested
- Civics
- —
Market trends
- HPI YoY
- ▼ -351.55%
- Current HPI
- 358.3294
- Rent YoY
- ▲ 0.35%
- Metro
- San Diego-Chula Vista-Carlsbad, CA
- State GDP YoY
- ▲ 3.21%
- F500 in state
- 116
Industry mix (Fortune 500 HQ in CA)
| Industry | F500 HQs | Revenue |
|---|---|---|
| Technology | 27 | $1,492B |
|
||
| Financial Services | 3 | $174B |
|
||
| Retail | 3 | $44B |
|
||
| Insurance | 3 | $26B |
|
||
| Media / Entertainment | 2 | $115B |
|
||
| Pharmaceuticals / Biotech | 2 | $62B |
|
||
Price history
1 event — show timeline
- 2026-04-13 Listed $279,000 CRMLS
Property tax history
+2.6%/yrLatest (2013): $257 · +2.1% YoY. Source: county tax records.
Cash-flow waterfall
monthlySold comps — $/sqft
last 12 mo · ≤1 miLoading sold comps…