 Fourplex
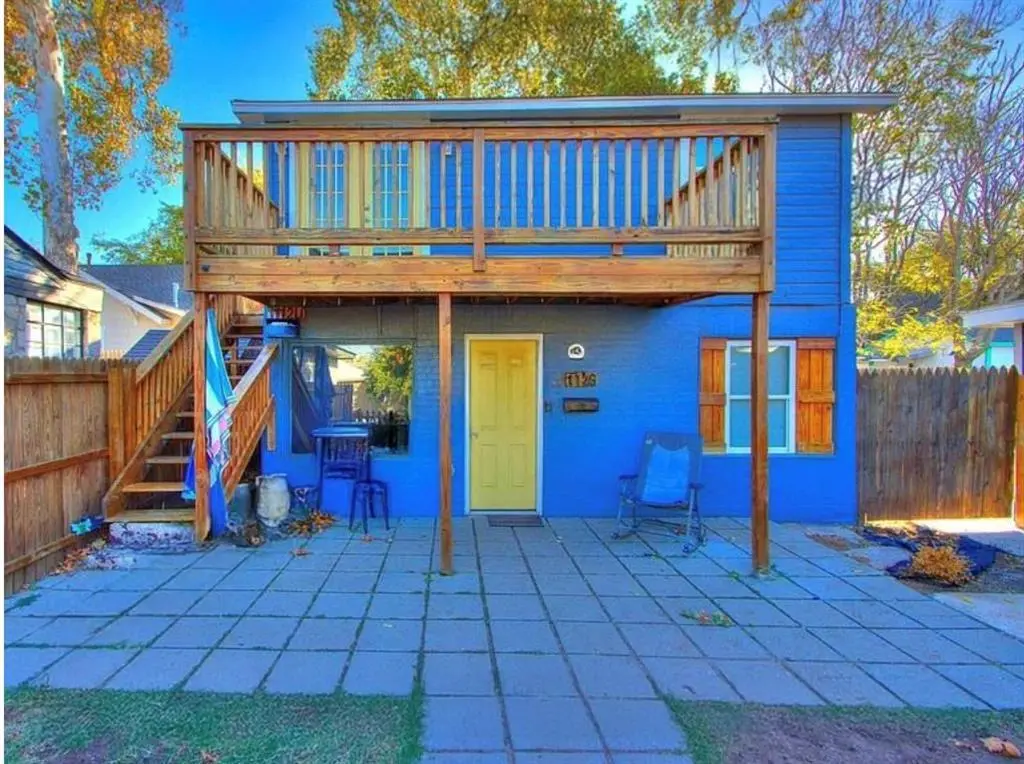
1112 N Ross Ave · Oklahoma City, OK
Flood risk 1/10 · Minimal
- FEMA flood zone
- X (unshaded)
- Chance of flooding over 30 yrs
- 0.0%
- Est. flood insurance / yr
- $507 – $1,088
Fire risk 1/10 · Minimal
- Est. fire insurance / yr
- $2,463 – $4,575
Heat risk 6/10 · Moderate
- Hot days now (above 107°F)
- 7 days/yr
- Hot days in 30 yrs
- 19 days/yr
Wind risk 2/10 · Minimal
- Chance of severe wind over 30 yrs
- 3.0%
Air-quality risk 2/10 · Minimal
- Unhealthy air days now
- 1 days/yr
- Unhealthy air days in 30 yrs
- 2 days/yr
Risk factors via First Street. Map © Google.
Why this score? — see what drove the C grade
The composite is a weighted blend of 9 inputs, each scored 0–100. Each bar is that input's sub-score; the figure is the points it added to the 100-point composite (weight × sub-score).
- Cash flow +30.0/30.0
- DSCR +10.0/10.0
- 1% rule +8.1/10.0
- Rent growth +4.3/5.0
- Livability +4.0/5.0
- Condition / age +2.5/5.0
- Schools +0.7/10.0
- ARV discount +0.0/15.0
- Appreciation +0.0/10.0
$259,900
🖨 Deal sheet (PDF) 📄 Offer letter ✓ Due diligence
Multi-family units
County records classify this as Multi-Family (2-4 Unit). Listing-text estimate: 4 units. confirmed
Listing remarks MLS
PRICE IMPROVED — PACKAGE NOW $349,900 (see MLS #1222622 for companion 1110 N Ross). 1112 N Ross is a three-unit building in OKC's Miller neighborhood, minutes from the Plaza District, the Paseo, OKC Fairgrounds, and OSU-OKC. 1112 F is physically attached to 1110 N Ross cottage on adjacent parcels — sharing a structural wall while remaining on separate lots. All four units in the package are currently vacant — buyer controls tenant selection and lease-up from day one. Recent renovations include LVP flooring, tiled showers, recessed lighting, and central HVAC across all units. Separate electric meters per unit; owner pays only water and trash. Documented rental history through mid-2025; three of four units priced below current market with meaningful upside at re-lease. Must be sold together with 1110 N Ross cottage — 4 doors across two parcels at sub-$90K/door. Full investment package, rent roll, and underwriting in MLS supplements. Buyer to verify all information including square footage, rents, and expenses. Seller is an inactive licensed real estate professional.
Key facts
- Value-add potential
- Multi-unit property
- 4,831 sq ft lot
Tags
Neighborhood map
What this means for you Summary
Snapshot
- This is a 4 × 1-bed/?-bath units multifamily listed at $260k.
Deal economics
- At list price, monthly cash flow is $974 ($12k/yr) — positive. Per door: $244/mo.
- The deal already cash-flows at list — no discount required.
- Meets the 1% rule at list price ($3k rent vs $260k).
- Recommended offer: $244k (6.0% below list) — sets the bar for market timing.
- Cap rate 10.8% vs local median 3.7% in Oklahoma City — top-decile yield for the area; either an underpriced asset or a hidden risk that comps aren't pricing in. Stress-test before assuming the spread holds.
Location & tenants
- Location reads 80/100 on livability (#3 in OK, #1,635 nationally) — a professional / high-income tenant draw. Strengths: amenities A+, commute A+, cost of living A+; Watch: schools F, crime F.
- Oklahoma City (urban): math 7% / reading 10% proficiency, ranked #254 of 270 in OK (top 94%) — low school quality limits family demand, transient renter base, plan for 1-2y turnover; 82% free/reduced lunch — lower-income household profile, screen leases tightly.
- Market conditions: Rents rising fast (+7.3%/yr); 216 active listings in the ZIP; 40 comparable units currently listed for rent nearby; rentals at typical pace (median 22d on market — plan ~3-4 weeks tenant-placement turnaround); 5,365 units permitted in Oklahoma County in 2024 (569 in 5+ unit buildings).
- At $3,399/mo this rent would consume 72% of the median local household income ($57k/yr) (locally 1210% of renters already pay >50% of income on rent) — very limited rent-growth headroom before tenants either downsize or default.
Forward outlook
- Local home prices are declining (-3.0%/yr); year-one equity from $2k of loan paydown is wiped out by about $8k of value loss. Plan a longer hold.
- Oklahoma County population projected at +41% by 2050 — long-run rental-demand tailwind backs the buy-and-hold thesis.
- At projected returns (-3.0% appreciation + 7.3% rent growth), your $73k cash investment doubles in ~6 years — after that, you're playing with house money.
Negotiation context
- It's been on market 73 days — a 6% lower offer ($244k) is reasonable based on typical stale-listing flexibility.
- 6 sale attempts since 11y ago; this cycle's ask has dropped $30k (10%) from the opening price — seller is motivated, your offer sets the floor, not the list.
Risks & watch-outs
- Watch-outs: built in 1950 — expect roof / HVAC / electrical / plumbing capex.
- Climate carrying-cost: extreme-heat days projected 7→19/yr by 2055 (HVAC capex compounding) — expect insurance premiums to compound above CPI over the hold.
Questions for the listing agent
- It's been on market 73 days. Have you received any prior offers? Is the seller open to a 6% concession, seller financing, or rate buy-down credit?
- Can we see the unit-by-unit rent roll, current vacancy, and any below-market leases? What's the average tenancy length?
- What capital expenditures (roof, boiler, parking lot, exteriors) have been made in the last 5 years, and what's planned in the next 2?
- Built in 1950 — when were the roof, HVAC, electrical panel, plumbing, and water heater last replaced?
- Why hasn't it sold? Are there any deal-killer items the seller is aware of (foundation, flood, title, zoning, code violations)?
- Is there a deadline driving the sale (1031 exchange, divorce, estate, relocation)? That informs how much negotiation room exists.
- Schools are F-rated, which usually means shorter tenancies and higher turnover. Who's the typical renter profile here, and what's been the actual vacancy rate?
- Crime grade is F in this area — have there been break-ins, vandalism, or insurance claims at this property in the last 3 years? What carrier currently insures it and at what premium?
- What's the average days-on-market for RENTAL listings here right now (not sales)? A rising rental-DOM trend means longer vacancies and softer asking-rent achievability than the comps imply.
- What's the recent tenant-quality profile in this submarket — average credit score on applications, eviction rate, late-payment / NSF rate, and stable-employment percentage? A property-management company in the area should have these aggregated.
- How much new apartment / multifamily construction is in the pipeline within 1–3 miles? Heavy new supply (>2% of stock underway) typically softens rents 12–24 months out; light construction supports rent growth.
Investment metrics
- 1% rule
- 1.31% ✓
- Cap rate
- 10.79%
- Cash-on-cash
- 16.06%
- DSCR
- 1.71
- GRM
- 6.4
CMA / ARV
- ARV (median comp)
- $177,752
- List price
- $259,900
- Delta
- 46.22%
- Verdict
- OVERPRICED
- Comps
- 8 within 2.0 mi
Projected returns pro-forma
-3.0% appreciation · 7.29% rent growth · sell at horizon
- IRR
- 11.6%
- Equity multiple
- 1.48×
- Total profit
- $35,224
- Equity at exit
- $38,752
- IRR
- 23.7%
- Equity multiple
- 3.46×
- Total profit
- $179,173
- Equity at exit
- $22,471
Cash invested: $72,772 (down + closing). Projections, not guarantees.
Landlord ↔ Tenant lean methodology
- Overall (STATE)
- 83 Strongly Landlord-Friendly
- State Oklahoma
- 83 Strongly Landlord-Friendly · R+20
- County
- — inherits STATE
- City
- — inherits STATE
ZIP-level market 73107
- Rents YoY
- 7.3%
- Active inventory
- 216
- Price-to-rent
- 25.5×
Monthly cashflow live
- Estimated rent
- $3,399 medium interval (Pro) →
- Mortgage (P&I)
- −$1,363
- Tax from tax record
- −$240 /mo · $2,880/yr
- Insurance
- −$108
- HOA
- −$0
- Vacancy / Maint / Mgmt
- −$714
- Net cashflow
- $974
Break-even live
Sensitivity live
| Price | -10% $1,121 | -5% $1,048 | +0% $974 | +5% $900 | +10% $827 |
|---|---|---|---|---|---|
| Rent | -10% $705 | -5% $840 | +0% $974 | +5% $1,108 | +10% $1,243 |
| Rate | -1.0pp $1,105 | -0.5pp $1,040 | base $974 | +0.5pp $907 | +1.0pp $838 |
4-unit breakdown (identical units grouped — click to expand)
| Units | Beds | Baths | Est. rent |
|---|---|---|---|
| 4× units | 1 | — | $3,400 |
| #1 | 1 | — | $850 |
| #2 | 1 | — | $850 |
| #3 | 1 | — | $850 |
| #4 | 1 | — | $850 |
| Total (4 units) | $3,399 | ||
UW: 25.0% down · 7.5% · 30yr · 1.5% tax · 5.0% vac · 8.0% maint · 8.0% mgmt
Financing live
Cash to close
- Down payment
- $64,975
- Closing costs
- $7,797
- Reserves months
- —
- Total cash needed
- —
Loan-product check · same deal, 3 products live
Conventional
25% down · 7.5% · 30yr
- Down + closing
- —
- Monthly P&I
- —
- Monthly cashflow
- —
- DSCR
- —
- Eligible?
- —
Personal DTI + credit; lowest rate.
DSCR
20% down · 8.5% · 30yr
- Down + closing
- —
- Monthly P&I
- —
- Monthly cashflow
- —
- DSCR
- —
- Eligible?
- —
No personal income docs; deal must DSCR.
Hard money
10% down · 12.0% · 12mo
- Down + closing
- —
- Monthly P&I
- —
- Monthly cashflow
- —
- DSCR
- —
- Eligible?
- —
Short-term bridge; refi at stabilization.
Rent comps 40 comps
| Address | Beds | Baths | Sqft | Rent | $/sqft | DOM | Units | Dist |
|---|---|---|---|---|---|---|---|---|
| 2801 NW 11th St Oklahoma City, OK | 2.0 | 1.0 | 1100 | $1,150 | $1.05 | 15d | 1 | 0.13mi |
| 1207 N Ross Ave Unit 1 Oklahoma City, OK | 2.0 | 1.0 | 850 | $880 | $1.04 | 4d | 1 | 0.15mi |
| 2612 NW 12th St Oklahoma City, OK | 1.0 | 1.0 | 925 | $750 | $0.81 | 24d | 1 | 0.26mi |
| 2608 NW 12th St Oklahoma City, OK | 1.0 | 1.0 | 860 | $950 | $1.10 | 24d | 1 | 0.26mi |
| 2608 NW 12th St Oklahoma City, OK | 1.0 | 1.0 | 860 | $950 | $1.10 | 44d | 1 | 0.26mi |
| 1403 N Miller Blvd Oklahoma City, OK | 2.0 | 1.0 | 1200 | $1,100 | $0.92 | 4d | 1 | 0.28mi |
| 2531 W Park Pl Oklahoma City, OK | 1.0 | 1.0 | 716 | $725 | $1.01 | 4d | 1 | 0.28mi |
| 2609 NW 12th St Oklahoma City, OK | 1.0 | 1.0 | 850 | $800 | $0.94 | 44d | 1 | 0.29mi |
| 2645 NW 13th St Unit A Oklahoma City, OK | 1.0 | 1.0 | 700 | $600 | $0.86 | 22d | 1 | 0.30mi |
| 2515 W Park Pl Oklahoma City, OK | 1.0 | 1.0 | 950 | $950 | $1.00 | 44d | 1 | 0.32mi |
| 2526 1/2 NW 12th St Oklahoma City, OK | 1.0 | 1.0 | 715 | $900 | $1.26 | 44d | 1 | 0.34mi |
| 2820 General Pershing Blvd Oklahoma City, OK | 1.0–3.0 | 1.0–2.0 | 951 | $1,013 | $1.07 | 2d | 39 | 0.38mi |
| 2916 NW 14th St Oklahoma City, OK | 2.0 | 4.0 | 800 | $900 | $1.12 | 3d | 1 | 0.39mi |
| 3024 NW 14th St Oklahoma City, OK | 2.0 | 1.0 | 924 | $895 | $0.97 | 16d | 1 | 0.48mi |
| 2325 NW 12th St Unit C Oklahoma City, OK | 2.0 | 1.0 | 736 | $899 | $1.22 | 17d | 1 | 0.58mi |
| 2325 NW 12th St Unit D Oklahoma City, OK | 2.0 | 1.0 | 836 | $899 | $1.08 | 44d | 1 | 0.58mi |
| 2502 NW 16th St Oklahoma City, OK | 2.0 | 1.0 | 780 | $1,100 | $1.41 | 44d | 1 | 0.58mi |
| 2319 NW 12th St Unit A Oklahoma City, OK | 2.0 | 1.0 | 874 | $925 | $1.06 | 44d | 1 | 0.59mi |
| 2854 NW 19th St Unit 2854 Oklahoma City, OK | 2.0 | 1.0 | 811 | $1,280 | $1.58 | 3d | 1 | 0.68mi |
| 2231 NW 12th St Unit 22315 Oklahoma City, OK | 1.0 | 1.0 | 983 | $795 | $0.81 | 15d | 1 | 0.69mi |
| 2229 NW 12th St Unit 22295 Oklahoma City, OK | 1.0 | 1.0 | 983 | $895 | $0.91 | 15d | 1 | 0.69mi |
| 2308 NW 16th St Oklahoma City, OK | 1.0 | 1.0 | 850 | $1,125 | $1.32 | 3d | 1 | 0.74mi |
| 2306 NW 16th St Oklahoma City, OK | 1.0 | 1.0 | 850 | $1,050 | $1.24 | 44d | 1 | 0.74mi |
| 3003 NW 20th St Oklahoma City, OK | 2.0 | 1.0 | 909 | $999 | $1.10 | 44d | 1 | 0.81mi |
| 2748 NW 22nd St Oklahoma City, OK | 2.0 | 1.0 | 1066 | $1,500 | $1.41 | 3d | 1 | 0.89mi |
| 1233 1/2 N Grand Blvd Oklahoma City, OK | 2.0 | 1.0 | 950 | $925 | $0.97 | 24d | 1 | 0.93mi |
| 1945 W Park Pl Oklahoma City, OK | 2.0 | 1.0 | 912 | $1,215 | $1.33 | 3d | 1 | 1.00mi |
| 2209 NW 19th St Oklahoma City, OK | 1.0 | 1.0 | 950 | $1,000 | $1.05 | 2d | 1 | 1.02mi |
| 2209 NW 19th St Oklahoma City, OK | 1.0 | 1.0 | 950 | $1,000 | $1.05 | 4d | 1 | 1.02mi |
| 2207 NW 19th St Oklahoma City, OK | 1.0 | 1.5 | 1208 | $1,050 | $0.87 | 4d | 1 | 1.02mi |
| 2004 NW 15th St Oklahoma City, OK | 2.0 | 1.0 | 982 | $975 | $0.99 | 44d | 1 | 1.02mi |
| 2605 NW 24th St Oklahoma City, OK | 2.0 | 1.0 | 1300 | $1,525 | $1.17 | 3d | 1 | 1.08mi |
| 3109 NW 23rd St Oklahoma City, OK | 2.0 | 1.0 | 1006 | $925 | $0.92 | 44d | 1 | 1.08mi |
| 2300 N Youngs Blvd Oklahoma City, OK | 1.0 | 1.0 | 1176 | $865 | $0.74 | 44d | 1 | 1.08mi |
| 2236 NW 22nd St Oklahoma City, OK | 2.0 | 1.0 | 1200 | $950 | $0.79 | 22d | 1 | 1.09mi |
| 3609 NW 13th St Oklahoma City, OK | 2.0 | 1.5 | 1042 | $1,250 | $1.20 | 3d | 1 | 1.10mi |
| 3608 NW 16th St Oklahoma City, OK | 2.0 | 1.0 | 784 | $950 | $1.21 | 44d | 1 | 1.15mi |
| 2010 NW 20th St Unit 2428 Oklahoma City, OK | 1.0 | 1.0 | 800 | $899 | $1.12 | 44d | 1 | 1.21mi |
| 907 N Indiana Ave Oklahoma City, OK | 2.0 | 1.0 | 850 | $895 | $1.05 | 24d | 1 | 1.23mi |
| 3000 NW 27th St Oklahoma City, OK | 2.0 | 1.0 | 967 | $1,095 | $1.13 | 4d | 1 | 1.25mi |
Listing history 36 events
-
2026-06-18days on market $259,900 Active 73 DOM
-
2026-06-17days on market $259,900 Active 72 DOM
-
2026-06-16days on market $259,900 Active 71 DOM
-
2026-06-15days on market $259,900 Active 70 DOM
-
2026-06-13days on market $259,900 Active 68 DOM
-
2026-06-09days on market $259,900 Active 64 DOM
-
2026-06-08days on market $259,900 Active 63 DOM
-
2026-06-07days on market $259,900 Active 62 DOM
-
2026-06-05days on market $259,900 Active 59 DOM
-
2026-06-03days on market $259,900 Active 58 DOM
-
2026-06-02days on market $259,900 Active 57 DOM
-
2026-06-02price $259,900 Active 56 DOM
-
2026-06-01days on market $275,000 Active 56 DOM
-
2026-05-31days on market $275,000 Active 55 DOM
-
2026-05-07price $275,000 1104-char remark
Show marketing remark (1104 chars)
PRICE IMPROVED — PACKAGE NOW $349,900 (see MLS #1222622 for companion 1110 N Ross). 1112 N Ross is a three-unit building in OKC's Miller neighborhood, minutes from the Plaza District, the Paseo, OKC Fairgrounds, and OSU-OKC. 1112 F is physically attached to 1110 N Ross cottage on adjacent parcels — sharing a structural wall while remaining on separate lots. All four units in the package are currently vacant — buyer controls tenant selection and lease-up from day one. Recent renovations include LVP flooring, tiled showers, recessed lighting, and central HVAC across all units. Separate electric meters per unit; owner pays only water and trash. Documented rental history through mid-2025; three of four units priced below current market with meaningful upside at re-lease. Must be sold together with 1110 N Ross cottage — 4 doors across two parcels at sub-$90K/door. Full investment package, rent roll, and underwriting in MLS supplements. Buyer to verify all information including square footage, rents, and expenses. Seller is an inactive licensed real estate professional.
-
2026-04-06$290,000 Active 1104-char remark
Show marketing remark (1104 chars)
PRICE IMPROVED — PACKAGE NOW $349,900 (see MLS #1222622 for companion 1110 N Ross). 1112 N Ross is a three-unit building in OKC's Miller neighborhood, minutes from the Plaza District, the Paseo, OKC Fairgrounds, and OSU-OKC. 1112 F is physically attached to 1110 N Ross cottage on adjacent parcels — sharing a structural wall while remaining on separate lots. All four units in the package are currently vacant — buyer controls tenant selection and lease-up from day one. Recent renovations include LVP flooring, tiled showers, recessed lighting, and central HVAC across all units. Separate electric meters per unit; owner pays only water and trash. Documented rental history through mid-2025; three of four units priced below current market with meaningful upside at re-lease. Must be sold together with 1110 N Ross cottage — 4 doors across two parcels at sub-$90K/door. Full investment package, rent roll, and underwriting in MLS supplements. Buyer to verify all information including square footage, rents, and expenses. Seller is an inactive licensed real estate professional.
-
2026-03-31historical
-
2026-03-24price $290,000
-
2026-01-07$302,000 Active
-
2025-12-31historical
-
2025-10-23price $302,000
-
2025-10-13price $310,000
-
2025-09-16price $329,600
-
2025-08-21price $339,000
-
2025-07-16$345,000 Active
-
2022-02-16soldstatus $285,000
-
2018-07-20soldstatus $120,000
-
2016-03-21soldstatus $74,500
-
2016-03-16soldstatus $74,500 Sold
-
2016-02-18status Pending
-
2016-01-23$75,000 Active
-
2015-12-02historical
-
2015-10-22price $99,900
-
2015-09-14$110,000
-
2015-09-14historical
-
2015-09-07$110,000 Active
ⓘ Source: listings_history table (triggers on properties + properties_extension) + one-shot
backfill from property_details.listing_events for pre-trigger history.
Tax reassessment forecast OK · Resets to sale price
- Current annual tax
- $2,880 · $240/mo
- Projected year-2 tax
- $2,880 · $240/mo
- Expected delta
- $0/yr ($0/mo · 0.0%)
ⓘ Screening estimate from a state-policy table — verify with the county assessor before closing.
Climate risk First Street
- Flood 1/10 Low FEMA zone X (unshaded) · 0% chance over 30 yrs
- Wildfire 1/10 Low
- Heat 6/10 Major 7 d/yr ≥107°F today · 19 d/yr by 30 yrs out
- Wind 2/10 Low 3% chance of damaging wind over 30 yrs
- Air quality 2/10 Low 1 unhealthy d/yr today · 2 by 30 yrs out
Nearby sold comps map
Loading sold comps map…
Walkable amenities ~0.75 mi
Loading nearby amenities…
Taxation est. · year 1
- Rental income
- $40,788
- − Mortgage interest
- −$14,558
- − Property taxes
- −$2,880
- − Insurance
- −$1,300
- − Repairs & maintenance
- −$3,263
- − Management
- −$3,263
- − Depreciation
- −$7,561
- Taxable income
- $7,964
- Est. tax owed @ 24.0%
- −$1,911
- After-tax cash flow
- $9,777/yr
For passive investors: Depreciation is non-cash, so a rental often shows a tax loss while cash-flowing — sheltering income. Rental losses are passive: they offset passive income freely, and up to $25,000/yr can offset ordinary (W-2) income if you actively participate and your MAGI is under $100k (phasing out to $0 by $150k); unused losses carry forward. On sale, claimed depreciation is recaptured at up to 25%, and gains may owe capital-gains tax (a 1031 exchange can defer both). Figures are a year-1 estimate at your 24.0% rate — not tax advice; consult a CPA.
Schools (NCES district)
- District
- Oklahoma City
- NCES district ID
- 4022770
- Math proficiency
- 7% ▼ -5.00%
- Reading proficiency
- 10% ▼ -6.00%
- Median HH income
- $35,606
- Composite
- 7.0/100
- National rank
- #9970
- State rank
- #254 of 270 in OK
Livability — Oklahoma City
- Score
- 80/100
- State rank
- #3
- US rank
- #1635
Category grades
Schools grade is shown separately in the Schools card above.
Census & demographics
- Census place
- Oklahoma City, OK
- County
- Oklahoma County · 771,644 people
- City population
- 498,656
- Metro
- Oklahoma City, OK
- Population (ZIP)
- 25,791
- Household income
- $56,873
- Rent vs Own
- Severe rent burden
- 1210.0
Population outlook (Oklahoma County) Hauer SSP2
- Today (2025)
- 911,875 people
- By 2030
- 982,413 · +7.7%
- By 2040
- 1,130,468 · +24.0%
- By 2050
- 1,288,422 · +41.3%
- By 2075
- 1,711,482 · +87.7%
- By 2100
- 2,088,448 · +129.0%
Race, ethnicity, and origin ACS 2023
- Neighborhood character
- Diverse neighborhood (Simpson 0.64)
- Race & ethnicity
- White 47% Hispanic / Latino 37% Two or more races 13% Native American 6% Black 5% Asian 2%
- Hispanic origin (detail)
- Mexican 22%
- Common ancestry
- Lithuanian 1% Italian 1% Slovak 1%
- Foreign-born
- 19% · Canada, Vietnam
- Languages at home
- 67% English-only · Spanish 30% Vietnamese 1%
Political lean MEDSL · Oklahoma
- 2024 margin
- Toss-up / Even · D 48.0% · R 49.7% · Other 2.3%
- 2008→2024 swing
- +15.1pp toward D · 2008: -16.8pp · 2024: -1.7pp
- All cycles
- 2024: R+1.7 2020: R+1.1 2016: R+10.5 2012: R+16.7 2008: R+16.8
Not yet ingested
- Civics
- —
Market trends
- HPI YoY
- ▼ -245.03%
- Current HPI
- 274.7844
- Rent YoY
- ▲ 7.29%
- Metro
- Oklahoma City, OK
- State GDP YoY
- ▲ 1.55%
- F500 in state
- 6
Industry mix (Fortune 500 HQ in OK)
| Industry | F500 HQs | Revenue |
|---|---|---|
| Energy | 3 | $48B |
|
||
Price history
+150.0% since first listed22 events — show timeline
- 2026-05-07 Price Changed $275,000 MLSOK
- 2026-04-06 Listed $290,000 MLSOK
- 2026-03-31 Listing Removed — MLSOK
- 2026-03-24 Price Changed $290,000 MLSOK
- 2026-01-07 Listed $302,000 MLSOK
- 2025-12-31 Listing Removed — MLSOK
- 2025-10-23 Price Changed $302,000 MLSOK
- 2025-10-13 Price Changed $310,000 MLSOK
- 2025-09-16 Price Changed $329,600 MLSOK
- 2025-08-21 Price Changed $339,000 MLSOK
- 2025-07-16 Listed $345,000 MLSOK
- 2022-02-16 Sold (Public Records) $285,000 Public Records
- 2018-07-20 Sold (Public Records) $120,000 Public Records
- 2016-03-21 Sold (Public Records) $74,500 Public Records
- 2016-03-16 Sold (MLS) $74,500 MLSOK
- 2016-02-18 Pending — MLSOK
- 2016-01-23 Listed $75,000 MLSOK
- 2015-12-02 Listing Removed — MLSOK
- 2015-10-22 Price Changed $99,900 MLSOK
- 2015-09-14 Listed $110,000 MLSOK
- 2015-09-14 Listing Removed — MLSOK
- 2015-09-07 Listed $110,000 MLSOK
Property tax history
+13.2%/yrLatest (2025): $2,880 · +1.8% YoY. Source: county tax records.
Cash-flow waterfall
monthlySold comps — $/sqft
last 12 mo · ≤1 miLoading sold comps…