 Triplex
157 S 800 E · Salt Lake City, UT
Flood risk 1/10 · Minimal
- FEMA flood zone
- X (unshaded)
- Chance of flooding over 30 yrs
- 0.0%
- Est. flood insurance / yr
- $507 – $1,088
Fire risk 3/10 · Minor
- Est. fire insurance / yr
- $453 – $841
Heat risk 4/10 · Minor
- Hot days now (above 94°F)
- 7 days/yr
- Hot days in 30 yrs
- 19 days/yr
Wind risk 1/10 · Minimal
- Chance of severe wind over 30 yrs
- —
Air-quality risk 4/10 · Minor
- Unhealthy air days now
- 5 days/yr
- Unhealthy air days in 30 yrs
- 7 days/yr
Risk factors via First Street. Map © Google.
Why this score? — see what drove the D grade
The composite is a weighted blend of 9 inputs, each scored 0–100. Each bar is that input's sub-score; the figure is the points it added to the 100-point composite (weight × sub-score).
- Cash flow +13.2/30.0
- ARV discount +7.5/15.0
- DSCR +4.0/10.0
- Livability +3.8/5.0
- 1% rule +3.7/10.0
- Rent growth +3.0/5.0
- Schools +2.9/10.0
- Condition / age +2.2/5.0
- Appreciation +0.0/10.0
$975,000
🖨 Deal sheet 📄 Offer letter ✓ Due diligence
Multi-family units
County records classify this as Multi-Family (5+ Unit). Listing-text estimate: 3 units. estimate disagrees with records
5+ unit building — per-unit beds/baths from public records are typically unavailable; the breakdown below (if shown) is an estimate from the listing text.
Listing remarks
This multi-unit property was originally built as an elderly care facility that required overhead water sprinklers, which are still in place. Currently, the property is licensed and used as a single-room boarding home with multiple tenants. There is one 2-bedroom apartment and a 1-bedroom apartment on the main. Both have kitchens. The 2-bedroom apartment has a 3/4 bath, and the 1-bedroom has a full bath. One of the 1-bedroom units has a 1/2 bath; the other 7 rooms share two common baths. Upstairs, there are 2 common full bathrooms and a common area kitchen. THIS PROPERTY IS PERFECT "AS IS" OR CAN BE DEVELOPED INTO AN AIRBNB, HOSTEL, GROUP HOME, OR APARTMENT HOMES! THE BOILER IS A
Key facts
- Private bath
- 9,583 sq ft lot
- 5 garage spots
Tags
Property features AI
Finance
- Other: Zoned for multi-family (MR GRM); Landscaping present on part of the lot; Topography generally flat
- Financial info: 10 total units; Reported actual rent: $69,920 (unit-level summary); Annual tax amount listed
- HOA & community: No HOA information provided
Exterior
- Parking: Five total parking spaces; Five covered garage spaces (garage present); Open/uncovered parking available
- Security: No specific security features listed
- Utilities: Natural gas connected; Electricity connected; Public sewer connected; Culinary (public) water connected
- Home design: Multi-family property; Two stories; Faces west; Currently used as residential
- Construction: Stucco exterior; Asphalt roof; Built and standing (existing construction)
- Exterior features: Partially fenced lot; Curb and gutter; Sidewalks; Mountain view; Private lot
Interior
- Kitchen: No appliance details provided
- Bedrooms: 10-unit property with a total of 11 bedrooms
- Flooring: Carpet; Hardwood; Linoleum; Vinyl
- Bathrooms: Total of 5 bathrooms
- Heating & cooling: Gas radiant heating; Hot water heating
- Interior features: Blinds and drapes on some windows; Accessible doors; Entry foyer; Lighting fixtures; Window coverings included
- Laundry & utility: No laundry details provided
Neighborhood map
What this means for you Summary
Snapshot
- This is a 3 × 3-bed/2.2-bath units multifamily listed at $975k. Condition is rated fair.
Deal economics
- At list price, monthly cash flow is $-15 ($-181/yr) — negative. Per door: $-5/mo.
- To cash-flow at today's rent, offer at most $973k (0.2% below list).
- To meet the 1% rule (rent ≥ 1% of price), the offer needs to be $851k (12.7% below list).
- Recommended offer: $851k (12.7% below list) — sets the bar for 1% rule.
Location & tenants
- Location reads 75/100 on livability (#64 in UT, #3,994 nationally) — a middle-class / working-renter tenant base. Strengths: amenities A+, commute A+, housing A; Watch: cost of living D+, crime F.
- Salt Lake District (urban): math 30% / reading 37% proficiency, ranked #65 of 80 in UT (top 81%) — families likely to look elsewhere, expect single-tenant / working-renter base with shorter leases.
- Zoned schools: Wasatch School (math 53% / reading 56%, grade C, #106 of 585 statewide, top 19%, 337 students, 31% FRL); Salt Lake Center For Science Education Bryant (math 14% / reading 29%, grade F, #125 of 138 statewide, top 91%, 407 students, 64% FRL); East High (math 17% / reading 36%, grade F, #136 of 171 statewide, top 79%, 1,886 students, 51% FRL).
- Market conditions: Rents rising (+2.0%/yr); 133 active listings in the ZIP; 4,970 units permitted in Salt Lake County in 2024 (1,963 in 5+ unit buildings).
- At $8,510/mo this rent would consume 196% of the median local household income ($52k/yr) (locally 2450% of renters already pay >50% of income on rent) — very limited rent-growth headroom before tenants either downsize or default.
Forward outlook
- Local home prices are declining (-3.0%/yr); year-one equity from $7k of loan paydown is wiped out by about $29k of value loss. Plan a longer hold.
- Salt Lake County population projected at +37% by 2050 — long-run rental-demand tailwind backs the buy-and-hold thesis.
Negotiation context
- It's been on market 30 days — a 2% lower offer ($960k) is reasonable based on typical stale-listing flexibility.
Risks & watch-outs
- Watch-outs: built in 1950 — expect roof / HVAC / electrical / plumbing capex.
Questions for the listing agent
- What do current leases actually rent for vs. the listed asking? Can we see a recent rent roll and the last 12 months of T-12 income?
- Can we see the unit-by-unit rent roll, current vacancy, and any below-market leases? What's the average tenancy length?
- What capital expenditures (roof, boiler, parking lot, exteriors) have been made in the last 5 years, and what's planned in the next 2?
- Have any recent inspections been done? Can we get a copy of the seller's disclosures and any deferred-maintenance estimates?
- Built in 1950 — when were the roof, HVAC, electrical panel, plumbing, and water heater last replaced?
- Is there a deadline driving the sale (1031 exchange, divorce, estate, relocation)? That informs how much negotiation room exists.
- Crime grade is F in this area — have there been break-ins, vandalism, or insurance claims at this property in the last 3 years? What carrier currently insures it and at what premium?
- The area grade is low — what's the realistic commute time and amenity access for the typical tenant pool here? Any planned neighborhood developments (good or bad) we should know about?
- What's the average days-on-market for RENTAL listings here right now (not sales)? A rising rental-DOM trend means longer vacancies and softer asking-rent achievability than the comps imply.
- What's the recent tenant-quality profile in this submarket — average credit score on applications, eviction rate, late-payment / NSF rate, and stable-employment percentage? A property-management company in the area should have these aggregated.
- How much new apartment / multifamily construction is in the pipeline within 1–3 miles? Heavy new supply (>2% of stock underway) typically softens rents 12–24 months out; light construction supports rent growth.
Investment metrics
- 1% rule
- 0.87% ✗
- Cap rate
- 6.27%
- Cash-on-cash
- -0.07%
- DSCR
- 1.00
- GRM
- 9.5
CMA / ARV
No comps found within radius.
Projected returns pro-forma
-3.0% appreciation · 2.02% rent growth · sell at horizon
- IRR
- -17.5%
- Equity multiple
- 0.39×
- Total profit
- $-167,136
- Equity at exit
- $145,376
- IRR
- -11.5%
- Equity multiple
- 0.34×
- Total profit
- $-179,691
- Equity at exit
- $84,300
Cash invested: $273,000 (down + closing). Projections, not guarantees.
Landlord ↔ Tenant lean methodology
- Overall (STATE)
- 86 Strongly Landlord-Friendly
- State Utah
- 86 Strongly Landlord-Friendly · R+15
- County
- — inherits STATE
- City
- — inherits STATE
ZIP-level market 84102
- Rents YoY
- 2.0%
- Active inventory
- 133
- Price-to-rent
- 28.6×
Monthly cashflow live
- Estimated rent
- $8,510 high interval (Pro) →
- Mortgage (P&I)
- −$5,113
- Tax est. 1.5%
- −$1,219 /mo · $14,625/yr
- Insurance
- −$406
- HOA
- −$0
- Vacancy / Maint / Mgmt
- −$1,787
- Net cashflow
- $-15
Break-even live
3-unit breakdown (identical units grouped — click to expand)
| Units | Beds | Baths | Est. rent |
|---|---|---|---|
| 3× units | 3 | 2.2 | $8,511 |
| #1 | 3 | 2.2 | $2,837 |
| #2 | 3 | 2.2 | $2,837 |
| #3 | 3 | 2.2 | $2,837 |
| Total (3 units) | $8,510 | ||
UW: 25.0% down · 7.5% · 30yr · 1.5% tax · 5.0% vac · 8.0% maint · 8.0% mgmt
Financing live
Cash to close
- Down payment
- $243,750
- Closing costs
- $29,250
- Reserves months
- —
- Total cash needed
- —
Loan-product check · same deal, 3 products live
Conventional
25% down · 7.5% · 30yr
- Down + closing
- —
- Monthly P&I
- —
- Monthly cashflow
- —
- DSCR
- —
- Eligible?
- —
Personal DTI + credit; lowest rate.
DSCR
20% down · 8.5% · 30yr
- Down + closing
- —
- Monthly P&I
- —
- Monthly cashflow
- —
- DSCR
- —
- Eligible?
- —
No personal income docs; deal must DSCR.
Hard money
10% down · 12.0% · 12mo
- Down + closing
- —
- Monthly P&I
- —
- Monthly cashflow
- —
- DSCR
- —
- Eligible?
- —
Short-term bridge; refi at stabilization.
Listing history 1 events
-
2026-04-29$975,000 Active
ⓘ Source: listings_history table (triggers on properties + properties_extension) + one-shot
backfill from property_details.listing_events for pre-trigger history.
Climate risk First Street
- Flood 1/10 Low FEMA zone X (unshaded) · 0% chance over 30 yrs
- Wildfire 3/10 Moderate
- Heat 4/10 Moderate 7 d/yr ≥94°F today · 19 d/yr by 30 yrs out
- Wind 1/10 Low
- Air quality 4/10 Moderate 5 unhealthy d/yr today · 7 by 30 yrs out
Nearby sold comps map
Loading sold comps map…
Walkable amenities ~0.75 mi
Loading nearby amenities…
Taxation est. · year 1
- Rental income
- $102,120
- − Mortgage interest
- −$54,615
- − Property taxes
- −$14,625
- − Insurance
- −$4,875
- − Repairs & maintenance
- −$8,170
- − Management
- −$8,170
- − Depreciation
- −$28,364
- Taxable loss
- −$16,698
- Est. tax savings @ 24.0%
- +$4,008
- After-tax cash flow
- $3,826/yr
For passive investors: Depreciation is non-cash, so a rental often shows a tax loss while cash-flowing — sheltering income. Rental losses are passive: they offset passive income freely, and up to $25,000/yr can offset ordinary (W-2) income if you actively participate and your MAGI is under $100k (phasing out to $0 by $150k); unused losses carry forward. On sale, claimed depreciation is recaptured at up to 25%, and gains may owe capital-gains tax (a 1031 exchange can defer both). Figures are a year-1 estimate at your 24.0% rate — not tax advice; consult a CPA.
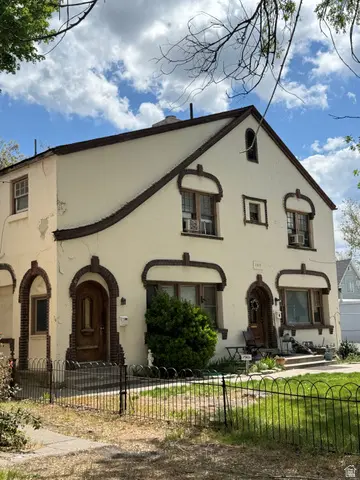
Condition & rehab AI · 5 photos
This multi-unit property requires moderate renovations, including painting the exterior siding and trimming the landscaping, to improve its curb appeal and property value.
Repairs flagged
- Major Exterior siding — Weathered and in need of repainting
- Major Landscaping — Overgrown and requires trimming
Value-add opportunities
- Both Paint exterior siding — Enhances curb appeal and property value
- Both Trim landscaping — Improves curb appeal and property value
Renovation cost estimate screening
| Repair item | Severity | Est. cost |
|---|---|---|
| Exterior siding · Weathered and in need of repainting | Major | $15,000–50,000 |
| Landscaping · Overgrown and requires trimming | Major | $15,000–50,000 |
| Total estimated repair cost · 2 items | $30,000–100,000 |
Value-add ROI direction
- Both Paint exterior siding — Enhances curb appeal and property value ↑
- Both Trim landscaping — Improves curb appeal and property value ↑
ⓘ Cost ranges are severity-bucket heuristics (US national rule-of-thumb). Get contractor quotes + a written scope before underwriting a rehab budget.
Schools (NCES district)
- District
- Salt Lake District
- NCES district ID
- 4900870
- Math proficiency
- 30% ▼ -13.00%
- Reading proficiency
- 37% ▼ -6.00%
- Median HH income
- $47,550
- Composite
- 28.85/100
- National rank
- #6645
- State rank
- #65 of 80 in UT
Livability — Salt Lake City
- Score
- 75/100
- State rank
- #64
- US rank
- #3994
Category grades
Schools grade is shown separately in the Schools card above.
Census & demographics
- Census place
- Salt Lake City, UT
- County
- Salt Lake County · 1,195,750 people
- City population
- 172,615
- Metro
- Salt Lake City, UT
- Population (ZIP)
- 18,777
- Household income
- $52,199
- Rent vs Own
- Severe rent burden
- 2450.0
Population outlook (Salt Lake County) Hauer SSP2
- Today (2025)
- 1,305,860 people
- By 2030
- 1,402,611 · +7.4%
- By 2040
- 1,594,533 · +22.1%
- By 2050
- 1,787,244 · +36.9%
- By 2075
- 2,224,138 · +70.3%
- By 2100
- 2,551,390 · +95.4%
Race, ethnicity, and origin ACS 2023
- Neighborhood character
- Predominantly White (76%)
- Race & ethnicity
- White 76% Hispanic / Latino 9% Two or more races 8% Asian 7% Black 2%
- Hispanic origin (detail)
- Mexican 5% Puerto Rican 1%
- Common ancestry
- Italian 5% Slovak 4% Lithuanian 3%
- Foreign-born
- 11% · Canada, China
- Languages at home
- 85% English-only · Spanish 6% Chinese 3% Other Indo-European 2%
Political lean MEDSL · Salt Lake
- 2024 margin
- D (+10.2) · D 53.7% · R 43.5% · Other 2.8%
- 2008→2024 swing
- +10.1pp toward D · 2008: 0.1pp · 2024: 10.2pp
- All cycles
- 2024: D+10.2 2020: D+11.0 2016: D+10.2 2012: R+19.3 2008: D+0.1
Not yet ingested
- Civics
- —
Market trends
- HPI YoY
- ▼ -316.89%
- Current HPI
- 343.2303
- Rent YoY
- ▲ 2.02%
- Metro
- Salt Lake City, UT
- State GDP YoY
- ▲ 3.54%
- F500 in state
- 2
Industry mix (Fortune 500 HQ in UT)
| Industry | F500 HQs | Revenue |
|---|---|---|
| Financial Services | 1 | $3B |
|
||
Price history
1 event — show timeline
- 2026-04-29 Listed $975,000 WFRMLS
Cash-flow waterfall
monthlySold comps — $/sqft
last 12 mo · ≤1 miLoading sold comps…