 🏗️ New Construction
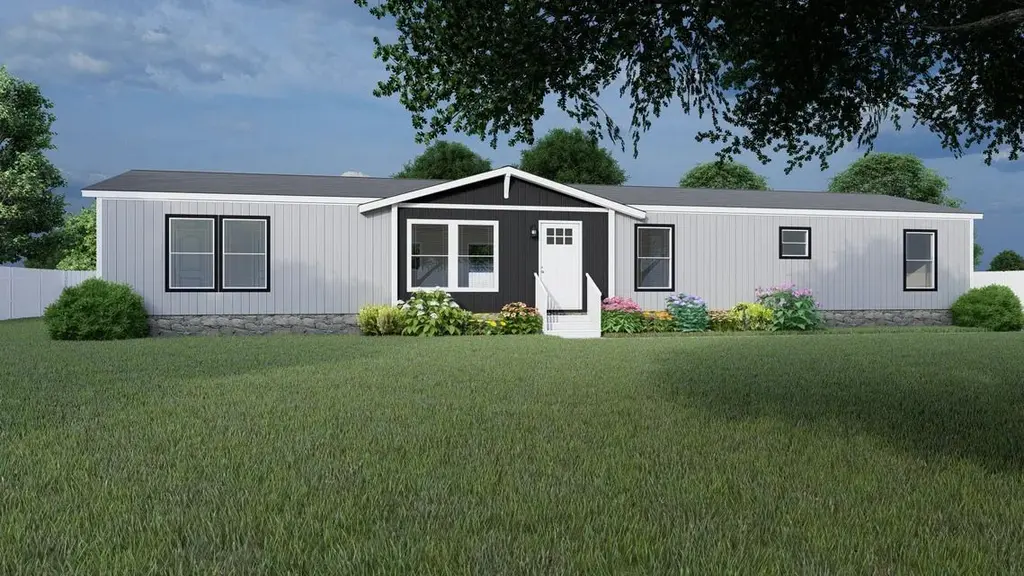
El Sueno Plan · Austin, TX
Flood risk 1/10 · Minimal
- FEMA flood zone
- X (unshaded)
- Chance of flooding over 30 yrs
- 0.0%
- Est. flood insurance / yr
- $507 – $1,088
Fire risk 5/10 · Moderate
- Est. fire insurance / yr
- $1,222 – $2,270
Heat risk 8/10 · Major
- Hot days now (above 108°F)
- 7 days/yr
- Hot days in 30 yrs
- 22 days/yr
Wind risk 8/10 · Major
- Chance of severe wind over 30 yrs
- 80.0%
Air-quality risk 1/10 · Minimal
- Unhealthy air days now
- 0 days/yr
- Unhealthy air days in 30 yrs
- 0 days/yr
Risk factors via First Street. Map © Google.
Why this score? — see what drove the B grade
The composite is a weighted blend of 9 inputs, each scored 0–100. Each bar is that input's sub-score; the figure is the points it added to the 100-point composite (weight × sub-score).
- Cash flow +30.0/30.0
- 1% rule +10.0/10.0
- DSCR +10.0/10.0
- ARV discount +7.5/15.0
- Livability +4.1/5.0
- Condition / age +3.8/5.0
- Appreciation +3.4/10.0
- Rent growth +2.4/5.0
- Schools +1.9/10.0
$142,995
🖨 Deal sheet 📄 Offer letter ✓ Due diligence
Listing remarks MLS
Indulge in the ultimate comfort and space with the El Sueno. This premium manufactured home offers an unparalleled living experience. With 2,016 square feet, four bedrooms, and two bathrooms, the El Sueno is perfect for families of all sizes. Designed with sophistication in mind, this home boasts a spacious layout and high-end finishes. Experience the epitome of modern living in the heart of Austin, combined with the eco-friendly benefits of Clayton's eBuilt system. This innovative technology incorporates over 25 sustainable features without compromising on luxury or style.
Key facts
- Listed 71 days
Neighborhood map
What this means for you Summary
Snapshot
- This is a 4-bed/2.0-bath manufactured listed at $143k. Condition is rated good.
Deal economics
- At list price, monthly cash flow is $714 ($9k/yr) — positive.
- The deal already cash-flows at list — no discount required.
- Meets the 1% rule at list price ($2k rent vs $143k).
- Recommended offer: $134k (6.0% below list) — sets the bar for market timing.
- Cap rate 12.3% vs local median 1.8% in Austin — top-decile yield for the area; either an underpriced asset or a hidden risk that comps aren't pricing in. Stress-test before assuming the spread holds.
Location & tenants
- Location reads 82/100 on livability (#16 in TX, #1,208 nationally) — a professional / high-income tenant draw. Strengths: amenities A+, commute A+, employment A+; Watch: cost of living D, crime F.
- Del Valle ISD (rural): math 19% / reading 26% proficiency, ranked #749 of 826 in TX (top 91%) — low school quality limits family demand, transient renter base, plan for 1-2y turnover; 77% free/reduced lunch — lower-income household profile, screen leases tightly.
- Market conditions: Rents soft (-0.4%/yr); 246 active listings in the ZIP; 27 comparable units currently listed for rent nearby; rentals at typical pace (median 16d on market — plan ~3-4 weeks tenant-placement turnaround); 17,121 units permitted in Travis County in 2024 (11,963 in 5+ unit buildings).
- This rent runs 36% of the median local income ($72k/yr) — at the standard rent-burdened threshold; future hikes will face affordability resistance.
Forward outlook
- Local home prices are declining (-3.0%/yr); year-one equity from $988 of loan paydown is wiped out by about $4k of value loss. Plan a longer hold.
- Travis County population projected at +60% by 2050 — long-run rental-demand tailwind backs the buy-and-hold thesis.
- At projected returns (-3.0% appreciation + 0.0% rent growth), your $40k cash investment doubles in ~8 years — after that, you're playing with house money.
Negotiation context
- It's been on market 71 days — a 6% lower offer ($134k) is reasonable based on typical stale-listing flexibility.
Risks & watch-outs
- Climate carrying-cost: severe wind risk, 80% chance of damaging wind over 30y; moderate wildfire risk; extreme-heat days projected 7→22/yr by 2055 (HVAC capex compounding) — expect insurance premiums to compound above CPI over the hold.
Questions for the listing agent
- It's been on market 71 days. Have you received any prior offers? Is the seller open to a 6% concession, seller financing, or rate buy-down credit?
- Why hasn't it sold? Are there any deal-killer items the seller is aware of (foundation, flood, title, zoning, code violations)?
- Is there a deadline driving the sale (1031 exchange, divorce, estate, relocation)? That informs how much negotiation room exists.
- Crime grade is F in this area — have there been break-ins, vandalism, or insurance claims at this property in the last 3 years? What carrier currently insures it and at what premium?
- What's the average days-on-market for RENTAL listings here right now (not sales)? A rising rental-DOM trend means longer vacancies and softer asking-rent achievability than the comps imply.
- What's the recent tenant-quality profile in this submarket — average credit score on applications, eviction rate, late-payment / NSF rate, and stable-employment percentage? A property-management company in the area should have these aggregated.
- How much new for-sale + rental construction is in the pipeline within 1–3 miles? Heavy new supply typically softens prices + rents 12–24 months out; constrained supply supports both.
Investment metrics
- 1% rule
- 1.51% ✓
- Cap rate
- 12.28%
- Cash-on-cash
- 21.39%
- DSCR
- 1.95
- GRM
- 5.5
CMA / ARV
No comps found within radius.
Projected returns pro-forma
-3.0% appreciation · 0.0% rent growth · sell at horizon
- IRR
- 10.5%
- Equity multiple
- 1.40×
- Total profit
- $16,010
- Equity at exit
- $21,321
- IRR
- 17.0%
- Equity multiple
- 2.20×
- Total profit
- $48,213
- Equity at exit
- $12,364
Cash invested: $40,039 (down + closing). Projections, not guarantees.
Landlord ↔ Tenant lean methodology
- Overall (STATE)
- 87 Strongly Landlord-Friendly
- State Texas
- 87 Strongly Landlord-Friendly · R+5
- County
- — inherits STATE
- City
- — inherits STATE
ZIP-level market 78617
- Home prices YoY
- -1.7%
- Rents YoY
- -0.4%
- Active inventory
- 246
- Price-to-rent
- 5.5×
Monthly cashflow live
- Estimated rent
- $2,154 high interval (Pro) →
- Mortgage (P&I)
- −$750
- Tax est. 1.5%
- −$179 /mo · $2,145/yr
- Insurance
- −$60
- HOA
- −$0
- Vacancy / Maint / Mgmt
- −$452
- Net cashflow
- $714
Break-even live
UW: 25.0% down · 7.5% · 30yr · 1.5% tax · 5.0% vac · 8.0% maint · 8.0% mgmt
Financing live
Cash to close
- Down payment
- $35,749
- Closing costs
- $4,290
- Reserves months
- —
- Total cash needed
- —
Loan-product check · same deal, 3 products live
Conventional
25% down · 7.5% · 30yr
- Down + closing
- —
- Monthly P&I
- —
- Monthly cashflow
- —
- DSCR
- —
- Eligible?
- —
Personal DTI + credit; lowest rate.
DSCR
20% down · 8.5% · 30yr
- Down + closing
- —
- Monthly P&I
- —
- Monthly cashflow
- —
- DSCR
- —
- Eligible?
- —
No personal income docs; deal must DSCR.
Hard money
10% down · 12.0% · 12mo
- Down + closing
- —
- Monthly P&I
- —
- Monthly cashflow
- —
- DSCR
- —
- Eligible?
- —
Short-term bridge; refi at stabilization.
Rent comps 27 comps
| Address | Beds | Baths | Sqft | Rent | $/sqft | DOM | Units | Dist |
|---|---|---|---|---|---|---|---|---|
| 12417 Sky Harbor Dr Del Valle, TX | 3.0 | 2.0 | 1586 | $1,975 | $1.25 | 24d | 1 | 0.55mi |
| 12604 Paloma Blanca Way Del Valle, TX | 3.0 | 2.0 | 1423 | $1,700 | $1.19 | 16d | 1 | 0.67mi |
| 6200 Albany Sleigh Dr Del Valle, TX | 3.0 | 2.0 | 1647 | $2,350 | $1.43 | 43d | 1 | 0.76mi |
| 5032 Irvine Ln Del Valle, TX | 4.0 | 2.5 | 2499 | $2,200 | $0.88 | 21d | 1 | 0.76mi |
| 6316 Carriage Pines Dr Del Valle, TX | 3.0 | 2.5 | 2305 | $2,300 | $1.00 | 43d | 1 | 0.80mi |
| 6400 Wagon Spring St Del Valle, TX | 3.0 | 2.5 | 1665 | $1,975 | $1.19 | 4d | 1 | 0.80mi |
| 4917 Stockton Ln Del Valle, TX | 4.0 | 2.5 | 2334 | $2,400 | $1.03 | 43d | 1 | 0.81mi |
| 6408 Wagon Spring St Del Valle, TX | 4.0 | 3.0 | 2497 | $2,495 | $1.00 | 43d | 1 | 0.82mi |
| 6409 Wagon Spring St Del Valle, TX | 4.0 | 2.0 | 1421 | $1,895 | $1.33 | 16d | 1 | 0.82mi |
| 6417 Wagon Spring St Del Valle, TX | 3.0 | 2.5 | 2230 | $2,149 | $0.96 | 43d | 1 | 0.84mi |
| 6417 Wagon Spring St Del Valle, TX | 3.0 | 2.5 | 2230 | $2,100 | $0.94 | 12d | 1 | 0.84mi |
| 6420 Carriage Pines Dr Del Valle, TX | 3.0 | 2.5 | 1665 | $1,995 | $1.20 | 43d | 1 | 0.85mi |
| 6521 Carriage Pines Dr Del Valle, TX | 5.0 | 3.5 | 2466 | $2,500 | $1.01 | 24d | 1 | 0.90mi |
| 5204 Bahan Dr Del Valle, TX | 4.0 | 2.5 | 2640 | $1,900 | $0.72 | 2d | 1 | 0.94mi |
| 13109 Lofton Cliff Dr Del Valle, TX | 3.0 | 2.0 | 1917 | $2,075 | $1.08 | 12d | 1 | 1.04mi |
| 12821 Stoney Ridge Bnd Del Valle, TX | 3.0 | 2.5 | 2281 | $2,250 | $0.99 | 17d | 1 | 1.04mi |
| 12316 Noel Bain Cv Del Valle, TX | 3.0 | 2.5 | 2281 | $2,100 | $0.92 | 3d | 1 | 1.09mi |
| 13229 Coomes Dr Del Valle, TX | 3.0 | 2.0 | 1703 | $1,995 | $1.17 | 12d | 1 | 1.13mi |
| 11800 Savanna Canyon Ct Del Valle, TX | 4.0 | 3.0 | 2322 | $2,050 | $0.88 | 4d | 1 | 1.21mi |
| 13400 Coomes Dr Del Valle, TX | 3.0 | 2.5 | 1625 | $1,895 | $1.17 | 3d | 1 | 1.22mi |
| 13400 Coomes Dr Del Valle, TX | 3.0 | 2.0 | 1625 | $1,895 | $1.17 | 4d | 1 | 1.22mi |
| 7100 Dancing Wind Ln Del Valle, TX | 3.0 | 2.5 | 1568 | $1,850 | $1.18 | 43d | 1 | 1.34mi |
| 5525 Victory Gallop Dr Del Valle, TX | 3.0 | 2.5 | 1788 | $1,850 | $1.03 | 43d | 1 | 1.37mi |
| 5521 Victory Gallop Dr Del Valle, TX | 3.0 | 2.5 | 1788 | $2,000 | $1.12 | 14d | 1 | 1.37mi |
| 5600 War Admiral Dr Del Valle, TX | 4.0 | 2.5 | 2101 | $2,200 | $1.05 | 3d | 1 | 1.39mi |
| 7224 Spotted Leaf Way Del Valle, TX | 3.0 | 2.0 | 1646 | $1,950 | $1.18 | 14d | 1 | 1.41mi |
| 7236 Dancing Wind Ln Del Valle, TX | 4.0 | 2.5 | 1566 | $1,750 | $1.12 | 43d | 1 | 1.44mi |
Listing history 14 events
-
2026-06-18days on market $142,995 Active 71 DOM
-
2026-06-17days on market $142,995 Active 70 DOM
-
2026-06-16days on market $142,995 Active 69 DOM
-
2026-06-15days on market $142,995 Active 68 DOM
-
2026-06-13days on market $142,995 Active 66 DOM
-
2026-06-09days on market $142,995 Active 62 DOM
-
2026-06-08days on market $142,995 Active 61 DOM
-
2026-06-07days on market $142,995 Active 60 DOM
-
2026-06-04days on market $142,995 Active 57 DOM
-
2026-06-03days on market $142,995 Active 56 DOM
-
2026-06-02days on market $142,995 Active 55 DOM
-
2026-06-01days on market $142,995 Active 54 DOM
-
2026-05-31days on market $142,995 Active 53 DOM
-
2026-04-08$142,995 Active 580-char remark
Show marketing remark (580 chars)
Indulge in the ultimate comfort and space with the El Sueno. This premium manufactured home offers an unparalleled living experience. With 2,016 square feet, four bedrooms, and two bathrooms, the El Sueno is perfect for families of all sizes. Designed with sophistication in mind, this home boasts a spacious layout and high-end finishes. Experience the epitome of modern living in the heart of Austin, combined with the eco-friendly benefits of Clayton's eBuilt system. This innovative technology incorporates over 25 sustainable features without compromising on luxury or style.
ⓘ Source: listings_history table (triggers on properties + properties_extension) + one-shot
backfill from property_details.listing_events for pre-trigger history.
Climate risk First Street
- Flood 1/10 Low FEMA zone X (unshaded) · 0% chance over 30 yrs
- Wildfire 5/10 Major
- Heat 8/10 Severe 7 d/yr ≥108°F today · 22 d/yr by 30 yrs out
- Wind 8/10 Severe 80% chance of damaging wind over 30 yrs
- Air quality 1/10 Low 0 unhealthy d/yr today · 0 by 30 yrs out
Nearby sold comps map
Loading sold comps map…
Walkable amenities ~0.75 mi
Loading nearby amenities…
Taxation est. · year 1
- Rental income
- $25,853
- − Mortgage interest
- −$8,010
- − Property taxes
- −$2,145
- − Insurance
- −$715
- − Repairs & maintenance
- −$2,068
- − Management
- −$2,068
- − Depreciation
- −$4,160
- Taxable income
- $6,687
- Est. tax owed @ 24.0%
- −$1,605
- After-tax cash flow
- $6,961/yr
For passive investors: Depreciation is non-cash, so a rental often shows a tax loss while cash-flowing — sheltering income. Rental losses are passive: they offset passive income freely, and up to $25,000/yr can offset ordinary (W-2) income if you actively participate and your MAGI is under $100k (phasing out to $0 by $150k); unused losses carry forward. On sale, claimed depreciation is recaptured at up to 25%, and gains may owe capital-gains tax (a 1031 exchange can defer both). Figures are a year-1 estimate at your 24.0% rate — not tax advice; consult a CPA.
Condition & rehab AI · 0 photos
This El Sueno manufactured home in Austin, TX, is in good condition with minor repairs and maintenance needed. It offers a spacious layout and high-end finishes, making it an excellent investment opportunity with high ROI potential.
Repairs flagged
- Minor Kitchen cabinets — Light wear and tear, minor touch-up needed.
- Minor Bathroom fixtures — Slight wear, minor replacement or touch-up needed.
- Minor Landscaping — Could benefit from some landscaping updates to enhance curb appeal.
Value-add opportunities
- Both Paint interior walls — Fresh paint enhances the home's appearance and can make it more appealing to potential buyers or renters.
- Both Replace worn-out fixtures in bathrooms — Upgrading dated fixtures can improve the home's functionality and aesthetic appeal.
- Both Landscaping improvements — Enhanced landscaping can significantly improve the home's curb appeal and overall aesthetic, making it more attractive to potential buyers or renters.
Renovation cost estimate screening
| Repair item | Severity | Est. cost |
|---|---|---|
| Kitchen cabinets · Light wear and tear, minor touch-up needed. | Minor | $500–3,000 |
| Bathroom fixtures · Slight wear, minor replacement or touch-up needed. | Minor | $500–3,000 |
| Landscaping · Could benefit from some landscaping updates to enhance curb appeal. | Minor | $500–3,000 |
| Total estimated repair cost · 3 items | $1,500–9,000 |
Value-add ROI direction
- Both Paint interior walls — Fresh paint enhances the home's appearance and can make it more appealing to potential buyers or renters. ↑
- Both Replace worn-out fixtures in bathrooms — Upgrading dated fixtures can improve the home's functionality and aesthetic appeal. ↑
- Both Landscaping improvements — Enhanced landscaping can significantly improve the home's curb appeal and overall aesthetic, making it more attractive to potential buyers or renters. ↑
ⓘ Cost ranges are severity-bucket heuristics (US national rule-of-thumb). Get contractor quotes + a written scope before underwriting a rehab budget.
Schools (NCES district)
- District
- Del Valle ISD
- NCES district ID
- 4816620
- Math proficiency
- 19% ▼ -13.00%
- Reading proficiency
- 26% ▼ -2.00%
- Median HH income
- $41,322
- Composite
- 19.13/100
- National rank
- #8830
- State rank
- #749 of 826 in TX
Livability — Austin
- Score
- 82/100
- State rank
- #16
- US rank
- #1208
Category grades
Schools grade is shown separately in the Schools card above.
Census & demographics
- Census place
- Austin, TX
- County
- Travis County · 1,299,254 people
- City population
- 1,066,854
- Metro
- Austin-Round Rock-Georgetown, TX
- Population (ZIP)
- 30,756
- Household income
- $71,640
- Rent vs Own
- Severe rent burden
- 681.0
Population outlook (Travis County) Hauer SSP2
- Today (2025)
- 1,545,133 people
- By 2030
- 1,729,269 · +11.9%
- By 2040
- 2,097,596 · +35.8%
- By 2050
- 2,463,890 · +59.5%
- By 2075
- 3,249,374 · +110.3%
- By 2100
- 3,801,868 · +146.1%
Race, ethnicity, and origin ACS 2023
- Neighborhood character
- Predominantly Hispanic (75%)
- Race & ethnicity
- Hispanic / Latino 75% Two or more races 33% White 16% Black 6% Asian 1%
- Hispanic origin (detail)
- Mexican 68% Puerto Rican 1%
- Common ancestry
- Romanian 1%
- Foreign-born
- 26% · Canada
- Languages at home
- 41% English-only · Spanish 57% Other Asian/Pacific 1%
Political lean MEDSL · Travis
- 2024 margin
- Solid D (+39.3) · D 68.8% · R 29.4% · Other 1.8%
- 2008→2024 swing
- +9.9pp toward D · 2008: 29.4pp · 2024: 39.3pp
- All cycles
- 2024: D+39.3 2020: D+45.0 2016: D+38.9 2012: D+23.9 2008: D+29.4
Not yet ingested
- Civics
- —
Market trends
- HPI YoY
- ▼ -3.24%
- Current HPI
- 192.3518
- Rent YoY
- ▼ -0.36%
- Metro
- Austin-Round Rock-Georgetown, TX
- State GDP YoY
- ▲ 3.95%
- F500 in state
- 110
Industry mix (Fortune 500 HQ in TX)
| Industry | F500 HQs | Revenue |
|---|---|---|
| Energy | 16 | $1,198B |
|
||
| Technology | 5 | $198B |
|
||
| Engineering / Construction | 4 | $72B |
|
||
| Energy Services | 3 | $60B |
|
||
| Utilities | 3 | $41B |
|
||
| Healthcare | 2 | $330B |
|
||
Price history
1 event — show timeline
- 2026-04-08 Listed $142,995 Zillow
Cash-flow waterfall
monthlySold comps — $/sqft
last 12 mo · ≤1 miLoading sold comps…