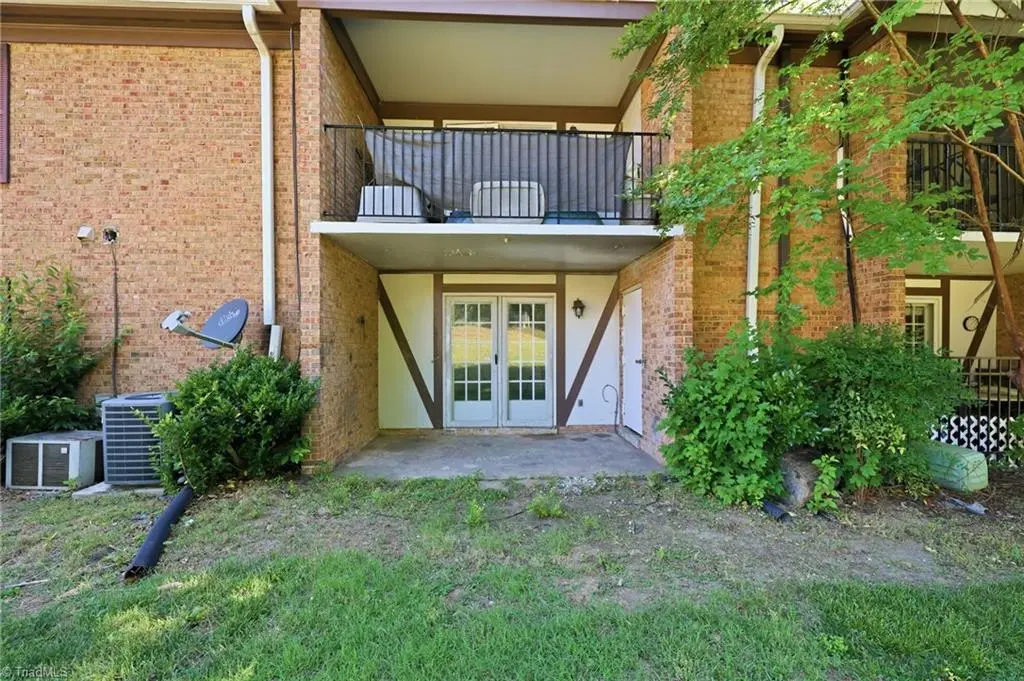
4610 Lawndale Dr Unit C · Greensboro, NC
Flood risk 1/10 · Minimal
- FEMA flood zone
- X (unshaded)
- Chance of flooding over 30 yrs
- 0.0%
- Est. flood insurance / yr
- $507 – $1,088
Fire risk 1/10 · Minimal
- Est. fire insurance / yr
- $906 – $1,684
Heat risk 6/10 · Moderate
- Hot days now (above 103°F)
- 7 days/yr
- Hot days in 30 yrs
- 19 days/yr
Wind risk 4/10 · Minor
- Chance of severe wind over 30 yrs
- 14.0%
Air-quality risk 2/10 · Minimal
- Unhealthy air days now
- 1 days/yr
- Unhealthy air days in 30 yrs
- 2 days/yr
Risk factors via First Street. Map © Google.
Why this score? — see what drove the C- grade
The composite is a weighted blend of 9 inputs, each scored 0–100. Each bar is that input's sub-score; the figure is the points it added to the 100-point composite (weight × sub-score).
- Cash flow +20.7/30.0
- ARV discount +7.5/15.0
- DSCR +6.6/10.0
- 1% rule +4.6/10.0
- Livability +4.0/5.0
- Schools +3.6/10.0
- Rent growth +2.9/5.0
- Condition / age +2.5/5.0
- Appreciation +0.0/10.0
$169,000
🖨 Deal sheet 📄 Offer letter ✓ Due diligence
Listing remarks MLS
EQUAL HOUSING OPPORTUNITY. Agents with active NAID#'s can submit offers and get contract at HUDHOMESTORE web. HUD-acquired properties are sold AS-IS w/out warranties, repairs, latent, structural, code, enviro issues, acr approx. HUD owned case #381-569218. FHA financing of the property condition is IN. FHA owner-occ borrowers may qualify for $100 down pymnt. See Oforireo web for forms, LBP, radon/mold notice addendums. Info believed accurate, buyer should verify.
Key facts
- Greensboro location
- Practical kitchen
- Built 1974
Tags
Property features AI
Finance
- Other: Building area total: 1,008 (unit value provided)
- HOA & community: Community: Battle Forest Condominiums; Association (Greensboro)
Exterior
- Parking: Deck (parking features listed as deck)
- Utilities: Public sewer; Water heater: unknown
- Home design: Residential condominium, stick/site built; One story; Built in 1974; Existing structure
- Construction: Brick construction; Slab foundation
- Exterior features: Public water service; Publicly maintained road; Small condominium lot (approximately 0.01 acre)
Interior
- Bedrooms: 1 room (main level)
- Bathrooms: 2 full bathrooms
- Heating & cooling: Central air conditioning; Forced air heating (no fuel specified)
- Interior features: Primary bedroom on the main level
Neighborhood map
What this means for you Summary
Snapshot
- This is a 3-bed/2.0-bath condo listed at $169k.
Deal economics
- At list price, monthly cash flow is $228 ($3k/yr) — positive.
- The deal already cash-flows at list — no discount required.
- To meet the 1% rule (rent ≥ 1% of price), the offer needs to be $162k (4.1% below list).
- Recommended offer: $162k (4.1% below list) — sets the bar for 1% rule.
- Cap rate 7.9% vs local median 3.8% in Greensboro — top-decile yield for the area; either an underpriced asset or a hidden risk that comps aren't pricing in. Stress-test before assuming the spread holds.
Location & tenants
- Location reads 81/100 on livability (#12 in NC, #1,335 nationally) — a professional / high-income tenant draw. Strengths: amenities A+, commute A+, cost of living A+; Watch: employment D, crime F.
- Guilford County Schools (urban): math 39% / reading 45% proficiency, ranked #99 of 178 in NC (top 56%) — families likely to look elsewhere, expect single-tenant / working-renter base with shorter leases.
- Market conditions: Rents rising (+1.7%/yr); 214 active listings in the ZIP; 21 comparable units currently listed for rent nearby; rentals at typical pace (median 21d on market — plan ~3-4 weeks tenant-placement turnaround); solid renter incomes; 3,843 units permitted in Guilford County in 2024 (2,397 in 5+ unit buildings).
Forward outlook
- Local home prices are declining (-3.0%/yr); year-one equity from $1k of loan paydown is wiped out by about $5k of value loss. Plan a longer hold.
- Guilford County population projected at +26% by 2050 — long-run rental-demand tailwind backs the buy-and-hold thesis.
Negotiation context
- Only 3 days on market — expect competitive offers; lowballing is unlikely to land.
- 2 sale attempts since 12y ago with the ask held roughly flat each time — persistent listings suggest the price (not the market) is what's stuck; bring a comps-based counter.
- Current owner paid $55k; list at $169k implies a 207% gain — meaningful room to come down on a strong offer.
Risks & watch-outs
- Climate carrying-cost: extreme-heat days projected 7→19/yr by 2055 (HVAC capex compounding) — expect insurance premiums to compound above CPI over the hold.
Questions for the listing agent
- Built in 1974 — when were the roof, HVAC, electrical panel, plumbing, and water heater last replaced?
- Any open or pending special assessments — roof, HVAC, plumbing, elevator, façade? What's the per-unit balance and payoff schedule, and is the seller paying it off at close or rolling it to the buyer?
- Is there a deadline driving the sale (1031 exchange, divorce, estate, relocation)? That informs how much negotiation room exists.
- Crime grade is F in this area — have there been break-ins, vandalism, or insurance claims at this property in the last 3 years? What carrier currently insures it and at what premium?
- What's the average days-on-market for RENTAL listings here right now (not sales)? A rising rental-DOM trend means longer vacancies and softer asking-rent achievability than the comps imply.
- What's the recent tenant-quality profile in this submarket — average credit score on applications, eviction rate, late-payment / NSF rate, and stable-employment percentage? A property-management company in the area should have these aggregated.
- How much new apartment / multifamily construction is in the pipeline within 1–3 miles? Heavy new supply (>2% of stock underway) typically softens rents 12–24 months out; light construction supports rent growth.
Investment metrics
- 1% rule
- 0.96% ✗
- Cap rate
- 7.91%
- Cash-on-cash
- 5.77%
- DSCR
- 1.26
- GRM
- 8.7
CMA / ARV
No comps found within radius.
Projected returns pro-forma
-3.0% appreciation · 1.72% rent growth · sell at horizon
- IRR
- -8.7%
- Equity multiple
- 0.68×
- Total profit
- $-14,994
- Equity at exit
- $25,198
- IRR
- -0.9%
- Equity multiple
- 0.94×
- Total profit
- $-2,817
- Equity at exit
- $14,612
Cash invested: $47,320 (down + closing). Projections, not guarantees.
Landlord ↔ Tenant lean methodology
- Overall (STATE)
- 85 Strongly Landlord-Friendly
- State North Carolina
- 85 Strongly Landlord-Friendly · R+3
- County
- — inherits STATE
- City
- — inherits STATE
ZIP-level market 27455
- Rents YoY
- 1.7%
- Active inventory
- 214
- Price-to-rent
- 8.7×
Monthly cashflow live
- Estimated rent
- $1,621 high interval (Pro) →
- Mortgage (P&I)
- −$886
- Tax from tax record
- −$96 /mo · $1,153/yr
- Insurance
- −$70
- HOA
- −$0
- Vacancy / Maint / Mgmt
- −$340
- Net cashflow
- $228
Break-even live
UW: 25.0% down · 7.5% · 30yr · 1.5% tax · 5.0% vac · 8.0% maint · 8.0% mgmt
Financing live
Cash to close
- Down payment
- $42,250
- Closing costs
- $5,070
- Reserves months
- —
- Total cash needed
- —
Loan-product check · same deal, 3 products live
Conventional
25% down · 7.5% · 30yr
- Down + closing
- —
- Monthly P&I
- —
- Monthly cashflow
- —
- DSCR
- —
- Eligible?
- —
Personal DTI + credit; lowest rate.
DSCR
20% down · 8.5% · 30yr
- Down + closing
- —
- Monthly P&I
- —
- Monthly cashflow
- —
- DSCR
- —
- Eligible?
- —
No personal income docs; deal must DSCR.
Hard money
10% down · 12.0% · 12mo
- Down + closing
- —
- Monthly P&I
- —
- Monthly cashflow
- —
- DSCR
- —
- Eligible?
- —
Short-term bridge; refi at stabilization.
Rent comps 21 comps
| Address | Beds | Baths | Sqft | Rent | $/sqft | DOM | Units | Dist |
|---|---|---|---|---|---|---|---|---|
| 4704 Lawndale Dr Unit 4704B Greensboro, NC | 2.0 | 1.5 | 1151 | $1,550 | $1.35 | 19d | 1 | 0.16mi |
| 3020 Cottage Pl Greensboro, NC | 1.0–2.0 | 1.0–2.0 | 900 | $1,399 | $1.55 | 14d | 10 | 0.17mi |
| 4635 Lawndale Dr Unit A Greensboro, NC | 3.0 | 2.5 | 1200 | $1,750 | $1.46 | 19d | 1 | 0.20mi |
| 4625 Lawndale Dr Greensboro, NC | 2.0 | 2.5 | 1138 | $1,600 | $1.41 | 23d | 1 | 0.21mi |
| 3211 Regents Park Ln Unit D Greensboro, NC | 2.0 | 1.5 | 1222 | $1,500 | $1.23 | 23d | 1 | 0.26mi |
| 4515 Lawndale Dr Greensboro, NC | 1.0–3.0 | 1.0–2.0 | 800 | $1,381 | $1.73 | 14d | 10 | 0.26mi |
| 2403 Lake Brandt Pl Greensboro, NC | 1.0–3.0 | 1.0–2.0 | 1025 | $1,810 | $1.76 | 14d | 11 | 0.83mi |
| 3701 Cotswold Ter Unit 7G Greensboro, NC | 2.0 | 2.0 | 994 | $1,299 | $1.31 | 21d | 1 | 0.99mi |
| 2921 Oaktop Cir Greensboro, NC | 2.0 | 2.0 | 1100 | $1,250 | $1.14 | 23d | 1 | 1.03mi |
| 2219 New Garden Rd Greensboro, NC | 2.0 | 2.0 | 1065 | $1,375 | $1.29 | 23d | 1 | 1.09mi |
| 2205 New Garden Rd Greensboro, NC | 1.0–2.0 | 1.0–2.0 | 808 | $1,405 | $1.74 | 14d | 29 | 1.12mi |
| 3803 Cotswold Ave Unit 3807P Greensboro, NC | 2.0 | 2.0 | 1060 | $1,350 | $1.27 | 14d | 1 | 1.16mi |
| 3803 Cotswold Ave Unit 3809L Greensboro, NC | 2.0 | 2.0 | 1060 | $1,350 | $1.27 | 23d | 1 | 1.16mi |
| 3803 Cotswold Ave Unit 3801G Greensboro, NC | 2.0 | 2.0 | 1008 | $1,215 | $1.21 | 23d | 1 | 1.16mi |
| 3803 Cotswold Ave Unit 3809G Greensboro, NC | 2.0 | 2.0 | 1008 | $1,325 | $1.31 | 23d | 1 | 1.16mi |
| 3517 Old Battleground Rd Greensboro, NC | 2.0 | 1.0 | 700 | $1,000 | $1.43 | 14d | 1 | 1.20mi |
| 3523 Old Battleground Rd Greensboro, NC | 2.0 | 1.0 | 700 | $1,000 | $1.43 | 23d | 1 | 1.21mi |
| 138 British Lake Dr Greensboro, NC | 2.0 | 2.0 | 1049 | $1,200 | $1.14 | 14d | 3 | 1.25mi |
| 515 Carowill Dr Greensboro, NC | 1.0–2.0 | 1.0–2.0 | 1028 | $1,700 | $1.65 | 14d | 9 | 1.28mi |
| 100 Tall Oaks Dr Unit 109-1A Greensboro, NC | 2.0 | 2.0 | 1003 | $4,440 | $4.43 | 23d | 1 | 1.31mi |
| 101 Shore Lake Dr Greensboro, NC | 1.0–3.0 | 1.0–2.0 | 1188 | $1,834 | $1.54 | 23d | 11 | 1.44mi |
HOA detail condo
- Monthly dues
- $0 · $0/yr
- Assessments
- None detected in remarks — confirm with the listing agent.
Listing history 4 events
-
2026-06-18days on market $169,000 Active 3 DOM
-
2026-06-17days on market $169,000 Active 2 DOM
-
2026-06-16remarks 687-char remark
-
2026-06-16$169,000 Active 1 DOM
ⓘ Source: listings_history table (triggers on properties + properties_extension) + one-shot
backfill from property_details.listing_events for pre-trigger history.
Tax reassessment forecast NC · Resets to sale price
- Current annual tax
- $1,153 · $96/mo
- Projected year-2 tax
- $1,386 · $115/mo
- Expected delta
- +$233/yr (+$19/mo · 20.2%)
ⓘ Screening estimate from a state-policy table — verify with the county assessor before closing.
Climate risk First Street
- Flood 1/10 Low FEMA zone X (unshaded) · 0% chance over 30 yrs
- Wildfire 1/10 Low
- Heat 6/10 Major 7 d/yr ≥103°F today · 19 d/yr by 30 yrs out
- Wind 4/10 Moderate 14% chance of damaging wind over 30 yrs
- Air quality 2/10 Low 1 unhealthy d/yr today · 2 by 30 yrs out
Nearby sold comps map
Loading sold comps map…
Walkable amenities ~0.75 mi
Loading nearby amenities…
Taxation est. · year 1
- Rental income
- $19,449
- − Mortgage interest
- −$9,467
- − Property taxes
- −$1,153
- − Insurance
- −$845
- − Repairs & maintenance
- −$1,556
- − Management
- −$1,556
- − Depreciation
- −$4,916
- Taxable loss
- −$44
- Est. tax savings @ 24.0%
- +$10
- After-tax cash flow
- $2,742/yr
For passive investors: Depreciation is non-cash, so a rental often shows a tax loss while cash-flowing — sheltering income. Rental losses are passive: they offset passive income freely, and up to $25,000/yr can offset ordinary (W-2) income if you actively participate and your MAGI is under $100k (phasing out to $0 by $150k); unused losses carry forward. On sale, claimed depreciation is recaptured at up to 25%, and gains may owe capital-gains tax (a 1031 exchange can defer both). Figures are a year-1 estimate at your 24.0% rate — not tax advice; consult a CPA.
Schools (NCES district)
- District
- Guilford County Schools
- NCES district ID
- 3701920
- Math proficiency
- 39% ▲ 1.00%
- Reading proficiency
- 45% ▲ 1.00%
- Median HH income
- $46,315
- Composite
- 35.78/100
- National rank
- #4842
- State rank
- #99 of 178 in NC
Livability — Greensboro
- Score
- 81/100
- State rank
- #12
- US rank
- #1335
Category grades
Schools grade is shown separately in the Schools card above.
Census & demographics
- Census place
- Greensboro, NC
- County
- Guilford County · 487,190 people
- City population
- 329,421
- Metro
- Greensboro-High Point, NC
- Population (ZIP)
- 29,302
- Household income
- $94,349
- Rent vs Own
- Severe rent burden
- 644.0
Population outlook (Guilford County) Hauer SSP2
- Today (2025)
- 584,596 people
- By 2030
- 616,851 · +5.5%
- By 2040
- 678,451 · +16.1%
- By 2050
- 734,788 · +25.7%
- By 2075
- 862,985 · +47.6%
- By 2100
- 948,704 · +62.3%
Race, ethnicity, and origin ACS 2023
- Neighborhood character
- Diverse neighborhood (Simpson 0.56)
- Race & ethnicity
- White 62% Black 23% Asian 5% Two or more races 4% Hispanic / Latino 4%
- Common ancestry
- Slovak 3% Italian 2% Serbian 2%
- Foreign-born
- 8% · Canada, China
- Languages at home
- 90% English-only · Spanish 3% Other Indo-European 2% Arabic 1%
Political lean MEDSL · Guilford
- 2024 margin
- Strong D (+21.8) · D 60.2% · R 38.4% · Other 1.4%
- 2008→2024 swing
- +3.5pp toward D · 2008: 18.4pp · 2024: 21.8pp
- All cycles
- 2024: D+21.8 2020: D+23.1 2016: D+20.0 2012: D+16.5 2008: D+18.4
Not yet ingested
- Civics
- —
Market trends
- HPI YoY
- ▼ -139.85%
- Current HPI
- 208.9563
- Rent YoY
- ▲ 1.72%
- Metro
- Greensboro-High Point, NC
- State GDP YoY
- ▲ 3.28%
- F500 in state
- 26
Industry mix (Fortune 500 HQ in NC)
| Industry | F500 HQs | Revenue |
|---|---|---|
| Financial Services | 2 | $213B |
|
||
| Retail | 2 | $95B |
|
||
| Industrial Conglomerate | 1 | $38B |
|
||
| Metals / Steel | 1 | $35B |
|
||
| Utilities | 1 | $30B |
|
||
| Industrial Machinery | 1 | $19B |
|
||
Price history
+344.7% since first listed7 events — show timeline
- 2026-06-15 Listed $169,000 Triad MLS
- 2017-08-15 Sold (Public Records) $55,000 Public Records
- 2014-04-29 Sold (MLS) $38,000 Triad MLS
- 2014-02-08 Listed $45,000 Triad MLS
- 1999-07-22 Sold (Public Records) $59,000 Public Records
- 1984-05-01 Sold (Public Records) $48,500 Public Records
- 1979-06-01 Sold (Public Records) $38,000 Public Records
Property tax history
+1.0%/yrLatest (2025): $1,153 · -1.0% YoY. Source: county tax records.
Cash-flow waterfall
monthlySold comps — $/sqft
last 12 mo · ≤1 miLoading sold comps…