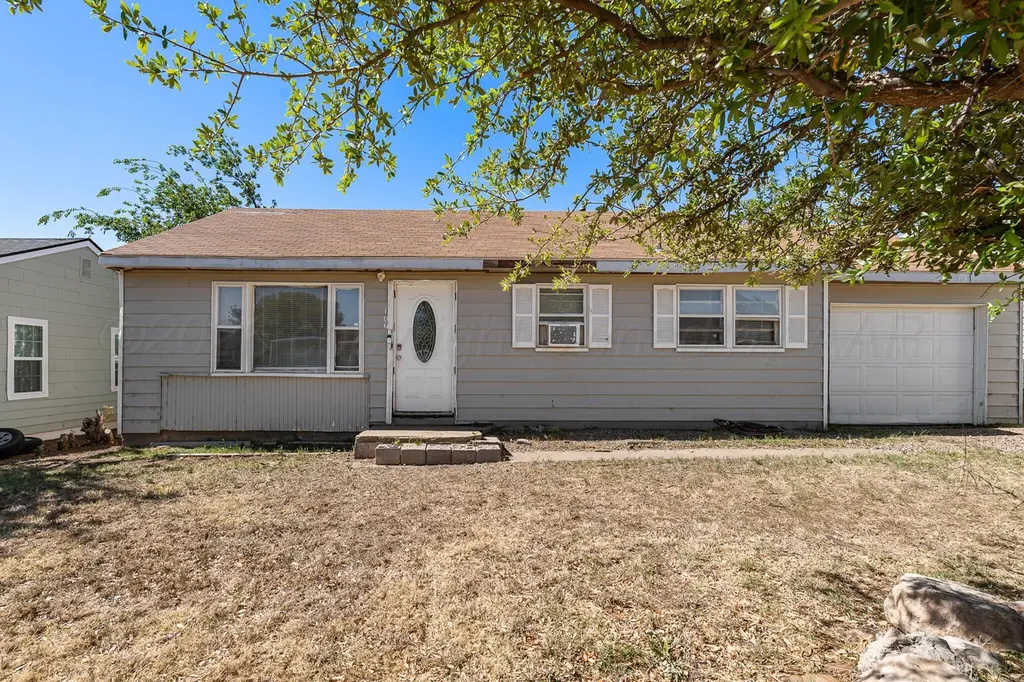
106 Peiffer St · Borger, TX
Flood risk 1/10 · Minimal
- FEMA flood zone
- —
- Chance of flooding over 30 yrs
- 0.0%
- Est. flood insurance / yr
- —
Fire risk 10/10 · Severe
- Est. fire insurance / yr
- $1,222 – $2,270
Heat risk 5/10 · Moderate
- Hot days now (above 100°F)
- 7 days/yr
- Hot days in 30 yrs
- 18 days/yr
Wind risk 2/10 · Minimal
- Chance of severe wind over 30 yrs
- —
Air-quality risk 2/10 · Minimal
- Unhealthy air days now
- 1 days/yr
- Unhealthy air days in 30 yrs
- 1 days/yr
Risk factors via First Street. Map © Google.
Why this score? — see what drove the B- grade
The composite is a weighted blend of 9 inputs, each scored 0–100. Each bar is that input's sub-score; the figure is the points it added to the 100-point composite (weight × sub-score).
- Cash flow +30.0/30.0
- 1% rule +10.0/10.0
- DSCR +10.0/10.0
- ARV discount +7.5/15.0
- Schools +3.6/10.0
- Livability +3.6/5.0
- Rent growth +2.5/5.0
- Condition / age +2.5/5.0
- Appreciation +0.0/10.0
$50,000
🖨 Deal sheet 📄 Offer letter ✓ Due diligence
Listing remarks
Cute little house in Keeler Heights neighborhood of Borger. Two bedrooms with a hall bathroom in between. Living room with bay window and a little dining room that is quaint and charming! Kitchen has some updates. Laundry hook-ups in the garage but still room for a small vehicle. Nice sized backyard with tons of possiblities! No central heat/air. Home comes with Achosa Home Warranty. Lots to love for this amazing price!
Key facts
- Nice sized backyard
- Bay window
- Updated kitchen
Tags
Property features AI
Finance
- Other: Zoning: 7000 series
Exterior
- Parking: Attached garage (1 car) with front-facing garage
- Utilities: Public water; Public sewer
- Home design: Single-family residence; One-level home; North-facing
- Construction: Pillar/post/pier foundation
- Exterior features: Chain link fencing
Interior
- Kitchen: Range (stove)
- Bathrooms: One full bathroom
- Heating & cooling: Electric cooling; Ceiling fan(s)
- Interior features: Ceiling fans; Range (stove)
- Laundry & utility: Laundry area in garage
Neighborhood map
What this means for you Summary
Snapshot
- This is a 2-bed/1.0-bath single-family listed at $50k.
Deal economics
- At list price, monthly cash flow is $390 ($5k/yr) — positive.
- The deal already cash-flows at list — no discount required.
- Meets the 1% rule at list price ($1k rent vs $50k).
- Recommended offer: $48k (3.0% below list) — sets the bar for market timing.
Location & tenants
- Location reads 72/100 on livability (#268 in TX) — a middle-class / working-renter tenant base. Strengths: cost of living A+, housing A+, health & safety A+; Watch: crime D+, employment D, commute F.
- Borger ISD (town): math 43% / reading 41% proficiency, ranked #348 of 826 in TX (top 42%) — families likely to look elsewhere, expect single-tenant / working-renter base with shorter leases.
- Zoned schools: Borger H S (math 27% / reading 49%, grade F, #880 of 1,632 statewide, top 54%, 761 students, 50% FRL).
- Market conditions: 88 active listings in the ZIP; 2 comparable units currently listed for rent nearby; 2 units permitted in Hutchinson County in 2024 (0 in 5+ unit buildings).
Forward outlook
- Local home prices are declining (-3.0%/yr); year-one equity from $346 of loan paydown is wiped out by about $2k of value loss. Plan a longer hold.
- At projected returns (-3.0% appreciation + 3.0% rent growth), your $14k cash investment doubles in ~4 years — after that, you're playing with house money.
Negotiation context
- It's been on market 51 days — a 3% lower offer ($48k) is reasonable based on typical stale-listing flexibility.
Risks & watch-outs
- Watch-outs: property tax is 3.8% of price; built in 1950 — expect roof / HVAC / electrical / plumbing capex.
- Climate carrying-cost: severe wildfire risk; extreme-heat days projected 7→18/yr by 2055 (HVAC capex compounding) — expect insurance premiums to compound above CPI over the hold.
Questions for the listing agent
- It's been on market 51 days. Have you received any prior offers? Is the seller open to a 3% concession, seller financing, or rate buy-down credit?
- Built in 1950 — when were the roof, HVAC, electrical panel, plumbing, and water heater last replaced?
- Property tax is high relative to price — has the assessment been appealed recently, and will the sale trigger a re-assessment?
- Is there a deadline driving the sale (1031 exchange, divorce, estate, relocation)? That informs how much negotiation room exists.
- Schools are D-rated, which usually means shorter tenancies and higher turnover. Who's the typical renter profile here, and what's been the actual vacancy rate?
- Crime grade is D in this area — have there been break-ins, vandalism, or insurance claims at this property in the last 3 years? What carrier currently insures it and at what premium?
- What's the average days-on-market for RENTAL listings here right now (not sales)? A rising rental-DOM trend means longer vacancies and softer asking-rent achievability than the comps imply.
- What's the recent tenant-quality profile in this submarket — average credit score on applications, eviction rate, late-payment / NSF rate, and stable-employment percentage? A property-management company in the area should have these aggregated.
- How much new for-sale + rental construction is in the pipeline within 1–3 miles? Heavy new supply typically softens prices + rents 12–24 months out; constrained supply supports both.
Investment metrics
- 1% rule
- 2.10% ✓
- Cap rate
- 15.64%
- Cash-on-cash
- 33.39%
- DSCR
- 2.49
- GRM
- 4.0
CMA / ARV
No comps found within radius.
Projected returns pro-forma
-3.0% appreciation · 3.0% rent growth · sell at horizon
- IRR
- 28.7%
- Equity multiple
- 2.20×
- Total profit
- $16,781
- Equity at exit
- $7,455
- IRR
- 36.2%
- Equity multiple
- 4.35×
- Total profit
- $46,861
- Equity at exit
- $4,323
Cash invested: $14,000 (down + closing). Projections, not guarantees.
Landlord ↔ Tenant lean methodology
- Overall (STATE)
- 87 Strongly Landlord-Friendly
- State Texas
- 87 Strongly Landlord-Friendly · R+5
- County
- — inherits STATE
- City
- — inherits STATE
ZIP-level market 79007
- Active inventory
- 88
- Price-to-rent
- 4.0×
Monthly cashflow live
- Estimated rent
- $1,051 medium interval (Pro) →
- Mortgage (P&I)
- −$262
- Tax from tax record
- −$158 /mo · $1,895/yr
- Insurance
- −$21
- HOA
- −$0
- Vacancy / Maint / Mgmt
- −$221
- Net cashflow
- $390
Break-even live
UW: 25.0% down · 7.5% · 30yr · 1.5% tax · 5.0% vac · 8.0% maint · 8.0% mgmt
Financing live
Cash to close
- Down payment
- $12,500
- Closing costs
- $1,500
- Reserves months
- —
- Total cash needed
- —
Loan-product check · same deal, 3 products live
Conventional
25% down · 7.5% · 30yr
- Down + closing
- —
- Monthly P&I
- —
- Monthly cashflow
- —
- DSCR
- —
- Eligible?
- —
Personal DTI + credit; lowest rate.
DSCR
20% down · 8.5% · 30yr
- Down + closing
- —
- Monthly P&I
- —
- Monthly cashflow
- —
- DSCR
- —
- Eligible?
- —
No personal income docs; deal must DSCR.
Hard money
10% down · 12.0% · 12mo
- Down + closing
- —
- Monthly P&I
- —
- Monthly cashflow
- —
- DSCR
- —
- Eligible?
- —
Short-term bridge; refi at stabilization.
Rent comps 2 comps
| Address | Beds | Baths | Sqft | Rent | $/sqft | DOM | Units | Dist |
|---|---|---|---|---|---|---|---|---|
| 607 W Wilson St Borger, TX | 2.0 | 1.0 | 850 | $1,200 | $1.41 | 43d | 1 | 1.22mi |
| 201 N McGee St Borger, TX | 1.0 | 1.0 | 600 | $800 | $1.33 | 13d | 1 | 1.46mi |
Listing history 18 events
-
2026-06-18days on market $50,000 Active 51 DOM
-
2026-06-17days on market $50,000 Active 50 DOM
-
2026-06-16days on market $50,000 Active 49 DOM
-
2026-06-15days on market $50,000 Active 48 DOM
-
2026-06-13days on market $50,000 Active 46 DOM
-
2026-06-12days on market $50,000 Active 45 DOM
-
2026-06-09days on market $50,000 Active 42 DOM
-
2026-06-08days on market $50,000 Active 41 DOM
-
2026-06-08pricedays on market $50,000 Active 40 DOM
-
2026-06-05days on market $52,000 Active 38 DOM
-
2026-06-03days on market $52,000 Active 36 DOM
-
2026-06-02days on market $52,000 Active 35 DOM
-
2026-06-01days on market $52,000 Active 34 DOM
-
2026-05-31days on market $52,000 Active 33 DOM
-
2026-04-28$52,000 Active 423-char remark
-
2025-08-23price $58,900
-
2024-04-24price $51,900
-
1998-03-06soldstatus
ⓘ Source: listings_history table (triggers on properties + properties_extension) + one-shot
backfill from property_details.listing_events for pre-trigger history.
Tax reassessment forecast TX · Resets to sale price
- Current annual tax
- $1,895 · $158/mo
- Projected year-2 tax
- $1,895 · $158/mo
- Expected delta
- $0/yr ($0/mo · 0.0%)
ⓘ Screening estimate from a state-policy table — verify with the county assessor before closing.
Climate risk First Street
- Flood 1/10 Low 0% chance over 30 yrs
- Wildfire 10/10 Extreme
- Heat 5/10 Major 7 d/yr ≥100°F today · 18 d/yr by 30 yrs out
- Wind 2/10 Low
- Air quality 2/10 Low 1 unhealthy d/yr today · 1 by 30 yrs out
Nearby sold comps map
Loading sold comps map…
Walkable amenities ~0.75 mi
Loading nearby amenities…
Taxation est. · year 1
- Rental income
- $12,614
- − Mortgage interest
- −$2,801
- − Property taxes
- −$1,895
- − Insurance
- −$250
- − Repairs & maintenance
- −$1,009
- − Management
- −$1,009
- − Depreciation
- −$1,455
- Taxable income
- $4,196
- Est. tax owed @ 24.0%
- −$1,007
- After-tax cash flow
- $3,667/yr
For passive investors: Depreciation is non-cash, so a rental often shows a tax loss while cash-flowing — sheltering income. Rental losses are passive: they offset passive income freely, and up to $25,000/yr can offset ordinary (W-2) income if you actively participate and your MAGI is under $100k (phasing out to $0 by $150k); unused losses carry forward. On sale, claimed depreciation is recaptured at up to 25%, and gains may owe capital-gains tax (a 1031 exchange can defer both). Figures are a year-1 estimate at your 24.0% rate — not tax advice; consult a CPA.
Schools (NCES district)
- District
- Borger ISD
- NCES district ID
- 4810890
- Math proficiency
- 43% ▼ -4.00%
- Reading proficiency
- 41% ▼ -1.00%
- Median HH income
- $44,714
- Composite
- 35.66/100
- National rank
- #4879
- State rank
- #348 of 826 in TX
Livability — Borger
- Score
- 72/100
- State rank
- #268
- US rank
- #6266
Category grades
Schools grade is shown separately in the Schools card above.
Census & demographics
- Census place
- Borger, TX
- Population (ZIP)
- 13,927
Population outlook (Hutchinson County) Hauer SSP2
- Today (2025)
- 21,274 people
- By 2030
- 21,089 · -0.9%
- By 2040
- 20,938 · -1.6%
- By 2050
- 20,999 · -1.3%
- By 2075
- 21,433 · +0.7%
- By 2100
- 21,243 · -0.1%
Race, ethnicity, and origin ACS 2023
- Neighborhood character
- Majority White (61%)
- Race & ethnicity
- White 61% Hispanic / Latino 32% Two or more races 19% Black 3% Native American 2%
- Hispanic origin (detail)
- Mexican 29%
- Common ancestry
- Slovak 2% Italian 1% Iranian 1%
- Foreign-born
- 7% · Canada
- Languages at home
- 79% English-only · Spanish 20%
Political lean MEDSL · Hutchinson
- 2024 margin
- Solid R (+77.2) · D 11.1% · R 88.2%
- 2008→2024 swing
- -8.2pp toward R · 2008: -68.9pp · 2024: -77.2pp
- All cycles
- 2024: R+77.2 2020: R+76.6 2016: R+76.1 2012: R+72.7 2008: R+68.9
Not yet ingested
- Civics
- —
Market trends
- HPI YoY
- ▼ -76.35%
- Current HPI
- 114.1111
- Rent YoY
- —
- Metro
- —
- State GDP YoY
- ▲ 3.95%
- F500 in state
- 110
Industry mix (Fortune 500 HQ in TX)
| Industry | F500 HQs | Revenue |
|---|---|---|
| Energy | 16 | $1,198B |
|
||
| Technology | 5 | $198B |
|
||
| Engineering / Construction | 4 | $72B |
|
||
| Energy Services | 3 | $60B |
|
||
| Utilities | 3 | $41B |
|
||
| Healthcare | 2 | $330B |
|
||
Price history
-3.7% since first listed5 events — show timeline
- 2026-06-07 Price Changed $50,000 AARMLS
- 2026-04-28 Listed $52,000 AARMLS
- 2025-08-23 Price Changed $58,900 AARMLS
- 2024-04-24 Price Changed $51,900 AARMLS
- 1998-03-06 Sold (Public Records) — Public Records
Property tax history
+6.7%/yrLatest (2025): $1,895 · +45.0% YoY. Source: county tax records.
Cash-flow waterfall
monthlySold comps — $/sqft
last 12 mo · ≤1 miLoading sold comps…