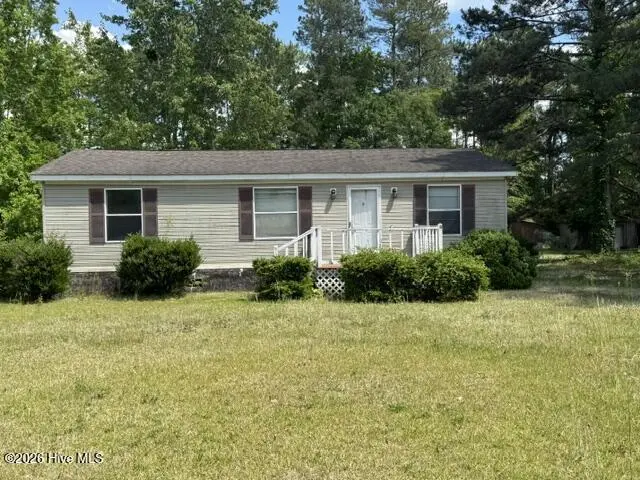
111 Dogwood Cir · Sandy Creek, NC
Flood risk 1/10 · Minimal
- FEMA flood zone
- X (unshaded)
- Chance of flooding over 30 yrs
- 0.0%
- Est. flood insurance / yr
- $507 – $1,088
Fire risk 7/10 · Major
- Est. fire insurance / yr
- $906 – $1,684
Heat risk 9/10 · Severe
- Hot days now (above 108°F)
- 7 days/yr
- Hot days in 30 yrs
- 18 days/yr
Wind risk 8/10 · Major
- Chance of severe wind over 30 yrs
- 97.0%
Air-quality risk 1/10 · Minimal
- Unhealthy air days now
- 0 days/yr
- Unhealthy air days in 30 yrs
- 0 days/yr
Risk factors via First Street. Map © Google.
Why this score? — see what drove the B- grade
The composite is a weighted blend of 9 inputs, each scored 0–100. Each bar is that input's sub-score; the figure is the points it added to the 100-point composite (weight × sub-score).
- Cash flow +30.0/30.0
- 1% rule +10.0/10.0
- DSCR +10.0/10.0
- ARV discount +7.5/15.0
- Schools +3.9/10.0
- Livability +3.1/5.0
- Rent growth +2.8/5.0
- Condition / age +2.2/5.0
- Appreciation +0.0/10.0
$99,000
🖨 Deal sheet (PDF) 📄 Offer letter ✓ Due diligence
Listing remarks MLS
Nice quiet country living within short drive from shopping, schools and parks on nice large lot
Key facts
- Storage shed
- Spacious lot
- Covered back porch
Tags
Property features AI
Exterior
- Parking: Unpaved off-street parking
- Utilities: Public water; Sewer available; Water available
- Home design: Manufactured home; Single-story (one level); Entry on main level
- Construction: Vinyl siding and frame construction; Shingle roof; Raised foundation; Built on a 0.72-acre lot (approx. 130 x 262 x 127 x 225)
- Exterior features: Covered porch
Interior
- Bedrooms: 5 total rooms (includes all living spaces)
- Bathrooms: 2 full bathrooms
- Heating & cooling: Central air conditioning; Electric heating with heat pump
- Interior features: No basement; Has a view
Neighborhood map
What this means for you Summary
Snapshot
- This is a 3-bed/2.0-bath single-family listed at $99k. Condition is rated fair.
Deal economics
- At list price, monthly cash flow is $741 ($9k/yr) — positive.
- The deal already cash-flows at list — no discount required.
- Meets the 1% rule at list price ($2k rent vs $99k).
- Recommended offer: $98k (1.5% below list) — sets the bar for market timing.
Location & tenants
- Location reads 61/100 on livability (#478 in NC) — a middle-class / working-renter tenant base. Strengths: cost of living A+, housing A; Watch: crime D, health & safety D, amenities F.
- Brunswick County Schools (rural): math 45% / reading 47% proficiency, ranked #82 of 178 in NC (top 46%) — families likely to look elsewhere, expect single-tenant / working-renter base with shorter leases.
- Zoned schools: Town Creek Elementary (math 50% / reading 53%, grade C-, #392 of 1,410 statewide, top 28%, 654 students, 100% FRL); Leland Middle (math 26% / reading 36%, grade F, #326 of 475 statewide, top 69%, 780 students, 100% FRL); North Brunswick High (math 57% / reading 49%, grade C-, #281 of 535 statewide, top 53%, 1,450 students, 100% FRL) — zoned schools average 100% FRL vs 53% district-wide (46 pts higher); higher-poverty schools than district average — tighter screening recommended.
- Market conditions: Rents rising (+1.2%/yr); 1213 active listings in the ZIP; 1 comparable units currently listed for rent nearby; solid renter incomes; 6,112 units permitted in Brunswick County in 2024 (990 in 5+ unit buildings).
Forward outlook
- Local home prices are declining (-3.0%/yr); year-one equity from $684 of loan paydown is wiped out by about $3k of value loss. Plan a longer hold.
- Brunswick County population projected at +36% by 2050 — long-run rental-demand tailwind backs the buy-and-hold thesis.
- At projected returns (-3.0% appreciation + 1.2% rent growth), your $28k cash investment doubles in ~4 years — after that, you're playing with house money.
Negotiation context
- It's been on market 22 days — a 2% lower offer ($98k) is reasonable based on typical stale-listing flexibility.
- 2 sale attempts since 7y ago with the ask held roughly flat each time — persistent listings suggest the price (not the market) is what's stuck; bring a comps-based counter.
Risks & watch-outs
- Climate carrying-cost: severe wind risk, 97% chance of damaging wind over 30y; major wildfire risk; extreme-heat days projected 7→18/yr by 2055 (HVAC capex compounding) — expect insurance premiums to compound above CPI over the hold.
Questions for the listing agent
- Have any recent inspections been done? Can we get a copy of the seller's disclosures and any deferred-maintenance estimates?
- Is there a deadline driving the sale (1031 exchange, divorce, estate, relocation)? That informs how much negotiation room exists.
- Schools are F-rated, which usually means shorter tenancies and higher turnover. Who's the typical renter profile here, and what's been the actual vacancy rate?
- Crime grade is D in this area — have there been break-ins, vandalism, or insurance claims at this property in the last 3 years? What carrier currently insures it and at what premium?
- What's the average days-on-market for RENTAL listings here right now (not sales)? A rising rental-DOM trend means longer vacancies and softer asking-rent achievability than the comps imply.
- What's the recent tenant-quality profile in this submarket — average credit score on applications, eviction rate, late-payment / NSF rate, and stable-employment percentage? A property-management company in the area should have these aggregated.
- How much new for-sale + rental construction is in the pipeline within 1–3 miles? Heavy new supply typically softens prices + rents 12–24 months out; constrained supply supports both.
Investment metrics
- 1% rule
- 1.82% ✓
- Cap rate
- 15.28%
- Cash-on-cash
- 32.09%
- DSCR
- 2.43
- GRM
- 4.6
CMA / ARV
- ARV (on-the-fly)
- $265,200
- Comps found
- 1
Show comp detail 1 sale within ~0.75 mi
| Address | Dist | Beds/Ba | Sqft | Sold | Price | $/sf | Match |
|---|---|---|---|---|---|---|---|
| 112 Dogwood Cir | 0.12mi | 3/2.0 | 1,151 (+11%) | 1mo | $293,000 | $255 | 76 |
Match score weights: distance 35% · size 25% · config 20% · recency 20%. Top-matched comps best support the ARV.
Projected returns pro-forma
-3.0% appreciation · 1.24% rent growth · sell at horizon
- IRR
- 25.1%
- Equity multiple
- 2.01×
- Total profit
- $28,052
- Equity at exit
- $14,761
- IRR
- 31.7%
- Equity multiple
- 3.63×
- Total profit
- $72,887
- Equity at exit
- $8,560
Cash invested: $27,720 (down + closing). Projections, not guarantees.
Landlord ↔ Tenant lean methodology
- Overall (STATE)
- 85 Strongly Landlord-Friendly
- State North Carolina
- 85 Strongly Landlord-Friendly · R+3
- County
- — inherits STATE
- City
- — inherits STATE
ZIP-level market 28451
- Rents YoY
- 1.2%
- Active inventory
- 1213
- Price-to-rent
- 4.6×
Monthly cashflow live
- Estimated rent
- $1,804 medium interval (Pro) →
- Mortgage (P&I)
- −$519
- Tax est. 1.5%
- −$124 /mo · $1,485/yr
- Insurance
- −$41
- HOA
- −$0
- Vacancy / Maint / Mgmt
- −$379
- Net cashflow
- $741
Break-even live
Sensitivity live
| Price | -10% $810 | -5% $775 | +0% $741 | +5% $707 | +10% $673 |
|---|---|---|---|---|---|
| Rent | -10% $599 | -5% $670 | +0% $741 | +5% $812 | +10% $884 |
| Rate | -1.0pp $791 | -0.5pp $766 | base $741 | +0.5pp $716 | +1.0pp $689 |
UW: 25.0% down · 7.5% · 30yr · 1.5% tax · 5.0% vac · 8.0% maint · 8.0% mgmt
Financing live
Cash to close
- Down payment
- $24,750
- Closing costs
- $2,970
- Reserves months
- —
- Total cash needed
- —
Loan-product check · same deal, 3 products live
Conventional
25% down · 7.5% · 30yr
- Down + closing
- —
- Monthly P&I
- —
- Monthly cashflow
- —
- DSCR
- —
- Eligible?
- —
Personal DTI + credit; lowest rate.
DSCR
20% down · 8.5% · 30yr
- Down + closing
- —
- Monthly P&I
- —
- Monthly cashflow
- —
- DSCR
- —
- Eligible?
- —
No personal income docs; deal must DSCR.
Hard money
10% down · 12.0% · 12mo
- Down + closing
- —
- Monthly P&I
- —
- Monthly cashflow
- —
- DSCR
- —
- Eligible?
- —
Short-term bridge; refi at stabilization.
Rent comps 1 comps
| Address | Beds | Baths | Sqft | Rent | $/sqft | DOM | Units | Dist |
|---|---|---|---|---|---|---|---|---|
| 3660 Old Maco Rd NE Leland, NC | 2.0 | 1.0 | 850 | $1,395 | $1.64 | 24d | 1 | 0.77mi |
Listing history 13 events
-
2026-06-10status $99,000 Pending 22 DOM
-
2026-06-09days on market $99,000 Active 22 DOM
-
2026-06-08days on market $99,000 Active 21 DOM
-
2026-06-07days on market $99,000 Active 20 DOM
-
2026-06-05days on market $99,000 Active 17 DOM
-
2026-06-03days on market $99,000 Active 16 DOM
-
2026-06-02days on market $99,000 Active 15 DOM
-
2026-06-01days on market $99,000 Active 14 DOM
-
2026-05-31days on market $99,000 Active 13 DOM
-
2026-05-30days on market $99,000 Active 12 DOM
-
2026-05-18$99,000 Active
-
2019-06-24soldstatus $94,600 95-char remark
Show marketing remark (95 chars)
Nice quiet country living within short drive from shopping, schools and parks on nice large lot
-
2019-01-15$88,000 95-char remark
Show marketing remark (95 chars)
Nice quiet country living within short drive from shopping, schools and parks on nice large lot
ⓘ Source: listings_history table (triggers on properties + properties_extension) + one-shot
backfill from property_details.listing_events for pre-trigger history.
Climate risk First Street
- Flood 1/10 Low FEMA zone X (unshaded) · 0% chance over 30 yrs
- Wildfire 7/10 Severe
- Heat 9/10 Extreme 7 d/yr ≥108°F today · 18 d/yr by 30 yrs out
- Wind 8/10 Severe 97% chance of damaging wind over 30 yrs
- Air quality 1/10 Low 0 unhealthy d/yr today · 0 by 30 yrs out
Nearby sold comps map
Loading sold comps map…
Walkable amenities ~0.75 mi
Loading nearby amenities…
Taxation est. · year 1
- Rental income
- $21,651
- − Mortgage interest
- −$5,546
- − Property taxes
- −$1,485
- − Insurance
- −$495
- − Repairs & maintenance
- −$1,732
- − Management
- −$1,732
- − Depreciation
- −$2,880
- Taxable income
- $7,781
- Est. tax owed @ 24.0%
- −$1,868
- After-tax cash flow
- $7,027/yr
For passive investors: Depreciation is non-cash, so a rental often shows a tax loss while cash-flowing — sheltering income. Rental losses are passive: they offset passive income freely, and up to $25,000/yr can offset ordinary (W-2) income if you actively participate and your MAGI is under $100k (phasing out to $0 by $150k); unused losses carry forward. On sale, claimed depreciation is recaptured at up to 25%, and gains may owe capital-gains tax (a 1031 exchange can defer both). Figures are a year-1 estimate at your 24.0% rate — not tax advice; consult a CPA.
Condition & rehab AI · 12 photos
This property requires moderate renovations, including painting, landscaping, and siding repair, to improve its curb appeal and increase its value.
Repairs flagged
- Major siding — Significant wear and tear
- Major paint — Peeling and dull
- Minor porch carpet — Worn but not damaged
Value-add opportunities
- Both painting — Enhances curb appeal and interior aesthetics
- Both landscaping — Improves curb appeal and enhances property value
- Both siding repair — Restores exterior appearance and increases property value
Renovation cost estimate screening
| Repair item | Severity | Est. cost |
|---|---|---|
| siding · Significant wear and tear | Major | $15,000–50,000 |
| paint · Peeling and dull | Major | $15,000–50,000 |
| porch carpet · Worn but not damaged | Minor | $500–3,000 |
| Total estimated repair cost · 3 items | $30,500–103,000 |
Value-add ROI direction
- Both painting — Enhances curb appeal and interior aesthetics ↑
- Both landscaping — Improves curb appeal and enhances property value ↑
- Both siding repair — Restores exterior appearance and increases property value ↑
ⓘ Cost ranges are severity-bucket heuristics (US national rule-of-thumb). Get contractor quotes + a written scope before underwriting a rehab budget.
Schools (NCES district)
- District
- Brunswick County Schools
- NCES district ID
- 3700420
- Math proficiency
- 45% ▲ 4.00%
- Reading proficiency
- 47% ▲ 4.00%
- Median HH income
- $47,494
- Composite
- 39.23/100
- National rank
- #4011
- State rank
- #82 of 178 in NC
Livability — Sandy Creek
- Score
- 61/100
- State rank
- #478
- US rank
- #17453
Category grades
Schools grade is shown separately in the Schools card above.
Census & demographics
- Census place
- Sandy Creek, NC
- County
- Brunswick County · 131,536 people
- Metro
- Myrtle Beach-Conway-North Myrtle Beach, SC-NC
- Population (ZIP)
- 46,933
- Household income
- $81,481
- Rent vs Own
- Severe rent burden
- 1049.0
Population outlook (Brunswick County) Hauer SSP2
- Today (2025)
- 152,111 people
- By 2030
- 165,705 · +8.9%
- By 2040
- 188,494 · +23.9%
- By 2050
- 206,228 · +35.6%
- By 2075
- 237,876 · +56.4%
- By 2100
- 251,451 · +65.3%
Race, ethnicity, and origin ACS 2023
- Neighborhood character
- Predominantly White (71%)
- Race & ethnicity
- White 71% Black 12% Hispanic / Latino 11% Two or more races 8%
- Hispanic origin (detail)
- Mexican 7% Puerto Rican 1%
- Common ancestry
- Slovak 2% Lithuanian 2% Romanian 2%
- Foreign-born
- 5% · Canada
- Languages at home
- 91% English-only · Spanish 7% Other Indo-European 1%
Political lean MEDSL · Brunswick
- 2024 margin
- Strong R (+24.9) · D 37.2% · R 62.0%
- 2008→2024 swing
- -6.9pp toward R · 2008: -17.9pp · 2024: -24.9pp
- All cycles
- 2024: R+24.9 2020: R+25.0 2016: R+28.7 2012: R+22.2 2008: R+17.9
Not yet ingested
- Civics
- —
Market trends
- HPI YoY
- ▼ -99.99%
- Current HPI
- 148.6217
- Rent YoY
- ▲ 1.24%
- Metro
- Myrtle Beach-Conway-North Myrtle Beach, SC-NC
- State GDP YoY
- ▲ 3.28%
- F500 in state
- 26
Industry mix (Fortune 500 HQ in NC)
| Industry | F500 HQs | Revenue |
|---|---|---|
| Financial Services | 2 | $213B |
|
||
| Retail | 2 | $95B |
|
||
| Industrial Conglomerate | 1 | $38B |
|
||
| Metals / Steel | 1 | $35B |
|
||
| Utilities | 1 | $30B |
|
||
| Industrial Machinery | 1 | $19B |
|
||
Price history
+12.5% since first listed3 events — show timeline
- 2026-05-18 Listed $99,000 Hive MLS
- 2019-06-24 Sold (MLS) $94,600 Hive MLS
- 2019-01-15 Listed $88,000 Hive MLS
Cash-flow waterfall
monthlySold comps — $/sqft
last 12 mo · ≤1 miLoading sold comps…