7850 Orient Rd · Miles, TX
Flood risk No data
- FEMA flood zone
- —
- Chance of flooding over 30 yrs
- —
- Est. flood insurance / yr
- —
Fire risk No data
- Est. fire insurance / yr
- —
Heat risk No data
- Hot days now (above threshold)
- —
- Hot days in 30 yrs
- —
Wind risk No data
- Chance of severe wind over 30 yrs
- —
Air-quality risk No data
- Unhealthy air days now
- —
- Unhealthy air days in 30 yrs
- —
Risk factors via First Street. Map © Google.
Why this score? — see what drove the B- grade
The composite is a weighted blend of 9 inputs, each scored 0–100. Each bar is that input's sub-score; the figure is the points it added to the 100-point composite (weight × sub-score).
- Cash flow +30.0/30.0
- DSCR +10.0/10.0
- 1% rule +8.4/10.0
- ARV discount +7.5/15.0
- Livability +3.4/5.0
- Rent growth +2.5/5.0
- Condition / age +2.5/5.0
- Schools +2.4/10.0
- Appreciation +0.0/10.0
$135,000
🖨 Deal sheet 📄 Offer letter ✓ Due diligence
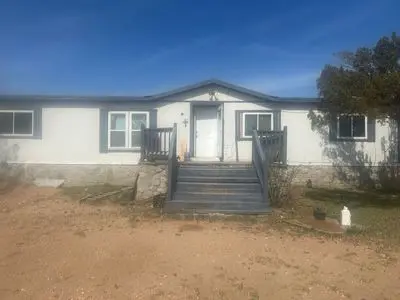
Listing remarks
Purchased house and land for my son back in September, 2023. I am in the process of remodeling and will be asking $150,000+ after the updates. Selling & quot; as is& quot; for $126,000. Needs new water supply tank and pump and various repairs. It has a non-functioning well that could be used for water source if repaired. Front two acres are functional with lots of parking/storage, back eight acres are not cleared off. Property was a horse ranch 20 years ago and still has the horse barn. View by Appointment only.
Key facts
- Built 1999
Neighborhood map
What this means for you Summary
Snapshot
- This is a 3-bed/2.0-bath manufactured listed at $135k.
Deal economics
- At list price, monthly cash flow is $627 ($8k/yr) — positive.
- The deal already cash-flows at list — no discount required.
- Meets the 1% rule at list price ($2k rent vs $135k).
Location & tenants
- Location reads 68/100 on livability (#510 in TX) — a middle-class / working-renter tenant base. Strengths: crime A+, cost of living A+, housing A+; Watch: health & safety C-, amenities F, commute F.
- Grape Creek ISD (rural): math 25% / reading 29% proficiency, ranked #675 of 826 in TX (top 82%) — low school quality limits family demand, transient renter base, plan for 1-2y turnover.
- Market conditions: 178 active listings in the ZIP; solid renter incomes; 233 units permitted in Tom Green County in 2024 (0 in 5+ unit buildings).
Forward outlook
- Local home prices are declining (-3.0%/yr); year-one equity from $933 of loan paydown is wiped out by about $4k of value loss. Plan a longer hold.
- Tom Green County population projected at +35% by 2050 — long-run rental-demand tailwind backs the buy-and-hold thesis.
- At projected returns (-3.0% appreciation + 3.0% rent growth), your $38k cash investment doubles in ~7 years — after that, you're playing with house money.
Negotiation context
- Only 0 days on market — expect competitive offers; lowballing is unlikely to land.
Questions for the listing agent
- Is there a deadline driving the sale (1031 exchange, divorce, estate, relocation)? That informs how much negotiation room exists.
- Schools are B-rated — typically a magnet for longer-tenancy family renters. What's the average tenant stay here, and is there a school-zone premium baked into asking?
- What's the average days-on-market for RENTAL listings here right now (not sales)? A rising rental-DOM trend means longer vacancies and softer asking-rent achievability than the comps imply.
- What's the recent tenant-quality profile in this submarket — average credit score on applications, eviction rate, late-payment / NSF rate, and stable-employment percentage? A property-management company in the area should have these aggregated.
- How much new for-sale + rental construction is in the pipeline within 1–3 miles? Heavy new supply typically softens prices + rents 12–24 months out; constrained supply supports both.
Investment metrics
- 1% rule
- 1.34% ✓
- Cap rate
- 11.87%
- Cash-on-cash
- 19.91%
- DSCR
- 1.89
- GRM
- 6.2
CMA / ARV
No comps found within radius.
Projected returns pro-forma
-3.0% appreciation · 3.0% rent growth · sell at horizon
- IRR
- 12.0%
- Equity multiple
- 1.48×
- Total profit
- $18,010
- Equity at exit
- $20,129
- IRR
- 20.9%
- Equity multiple
- 2.77×
- Total profit
- $66,898
- Equity at exit
- $11,672
Cash invested: $37,800 (down + closing). Projections, not guarantees.
Landlord ↔ Tenant lean methodology
- Overall (STATE)
- 87 Strongly Landlord-Friendly
- State Texas
- 87 Strongly Landlord-Friendly · R+5
- County
- — inherits STATE
- City
- — inherits STATE
ZIP-level market 76905
- Home prices YoY
- -32.1%
- Active inventory
- 178
- Price-to-rent
- 6.2×
Monthly cashflow live
- Estimated rent
- $1,812 medium interval (Pro) →
- Mortgage (P&I)
- −$708
- Tax from tax record
- −$40 /mo · $481/yr
- Insurance
- −$56
- HOA
- −$0
- Vacancy / Maint / Mgmt
- −$380
- Net cashflow
- $627
Break-even live
UW: 25.0% down · 7.5% · 30yr · 1.5% tax · 5.0% vac · 8.0% maint · 8.0% mgmt
Financing live
Cash to close
- Down payment
- $33,750
- Closing costs
- $4,050
- Reserves months
- —
- Total cash needed
- —
Loan-product check · same deal, 3 products live
Conventional
25% down · 7.5% · 30yr
- Down + closing
- —
- Monthly P&I
- —
- Monthly cashflow
- —
- DSCR
- —
- Eligible?
- —
Personal DTI + credit; lowest rate.
DSCR
20% down · 8.5% · 30yr
- Down + closing
- —
- Monthly P&I
- —
- Monthly cashflow
- —
- DSCR
- —
- Eligible?
- —
No personal income docs; deal must DSCR.
Hard money
10% down · 12.0% · 12mo
- Down + closing
- —
- Monthly P&I
- —
- Monthly cashflow
- —
- DSCR
- —
- Eligible?
- —
Short-term bridge; refi at stabilization.
Listing history 2 events
-
2026-05-26$135,000
-
2023-09-06soldstatus
ⓘ Source: listings_history table (triggers on properties + properties_extension) + one-shot
backfill from property_details.listing_events for pre-trigger history.
Tax reassessment forecast TX · Resets to sale price
- Current annual tax
- $481 · $40/mo
- Projected year-2 tax
- $2,470 · $206/mo
- Expected delta
- +$1,989/yr (+$166/mo · 413.3%)
ⓘ Screening estimate from a state-policy table — verify with the county assessor before closing.
Nearby sold comps map
Loading sold comps map…
Walkable amenities ~0.75 mi
Loading nearby amenities…
Taxation est. · year 1
- Rental income
- $21,742
- − Mortgage interest
- −$7,562
- − Property taxes
- −$481
- − Insurance
- −$675
- − Repairs & maintenance
- −$1,739
- − Management
- −$1,739
- − Depreciation
- −$3,927
- Taxable income
- $5,618
- Est. tax owed @ 24.0%
- −$1,348
- After-tax cash flow
- $6,176/yr
For passive investors: Depreciation is non-cash, so a rental often shows a tax loss while cash-flowing — sheltering income. Rental losses are passive: they offset passive income freely, and up to $25,000/yr can offset ordinary (W-2) income if you actively participate and your MAGI is under $100k (phasing out to $0 by $150k); unused losses carry forward. On sale, claimed depreciation is recaptured at up to 25%, and gains may owe capital-gains tax (a 1031 exchange can defer both). Figures are a year-1 estimate at your 24.0% rate — not tax advice; consult a CPA.
Schools (NCES district)
- District
- Grape Creek ISD
- NCES district ID
- 4821600
- Math proficiency
- 25% ▼ -12.00%
- Reading proficiency
- 29% ▲ 1.00%
- Median HH income
- $48,891
- Composite
- 23.6/100
- National rank
- #7849
- State rank
- #675 of 826 in TX
Livability — Miles
- Score
- 68/100
- State rank
- #510
- US rank
- #10092
Category grades
Schools grade is shown separately in the Schools card above.
Census & demographics
- County
- Tom Green County · 113,188 people
- Metro
- San Angelo, TX
- Population (ZIP)
- 14,456
- Household income
- $84,712
- Rent vs Own
- Severe rent burden
- 307.0
Population outlook (Tom Green County) Hauer SSP2
- Today (2025)
- 135,110 people
- By 2030
- 144,090 · +6.6%
- By 2040
- 162,561 · +20.3%
- By 2050
- 182,158 · +34.8%
- By 2075
- 232,274 · +71.9%
- By 2100
- 268,218 · +98.5%
Race, ethnicity, and origin ACS 2023
- Neighborhood character
- Diverse neighborhood (Simpson 0.57)
- Race & ethnicity
- White 52% Hispanic / Latino 40% Two or more races 17% Black 1% Asian 1%
- Hispanic origin (detail)
- Mexican 38%
- Common ancestry
- Slovak 2% Lithuanian 1% Italian 1%
- Foreign-born
- 5% · Canada
- Languages at home
- 79% English-only · Spanish 19% Korean 1%
Political lean MEDSL · Tom Green
- 2024 margin
- Solid R (+48.0) · D 25.5% · R 73.5% · Other 1.0%
- 2008→2024 swing
- -6.3pp toward R · 2008: -41.7pp · 2024: -48.0pp
- All cycles
- 2024: R+48.0 2020: R+44.4 2016: R+47.9 2012: R+47.9 2008: R+41.7
Not yet ingested
- Civics
- —
Market trends
- HPI YoY
- ▼ -96.60%
- Current HPI
- 203.9934
- Rent YoY
- —
- Metro
- San Angelo, TX
- State GDP YoY
- ▲ 3.95%
- F500 in state
- 110
Industry mix (Fortune 500 HQ in TX)
| Industry | F500 HQs | Revenue |
|---|---|---|
| Energy | 16 | $1,198B |
|
||
| Technology | 5 | $198B |
|
||
| Engineering / Construction | 4 | $72B |
|
||
| Energy Services | 3 | $60B |
|
||
| Utilities | 3 | $41B |
|
||
| Healthcare | 2 | $330B |
|
||
Price history
2 events — show timeline
- 2026-05-26 Listed $135,000 FSBO.com
- 2023-09-06 Sold (Public Records) — Public Records
Property tax history
-0.4%/yrLatest (2025): $481 · -68.9% YoY. Source: county tax records.
Cash-flow waterfall
monthlySold comps — $/sqft
last 12 mo · ≤1 miLoading sold comps…