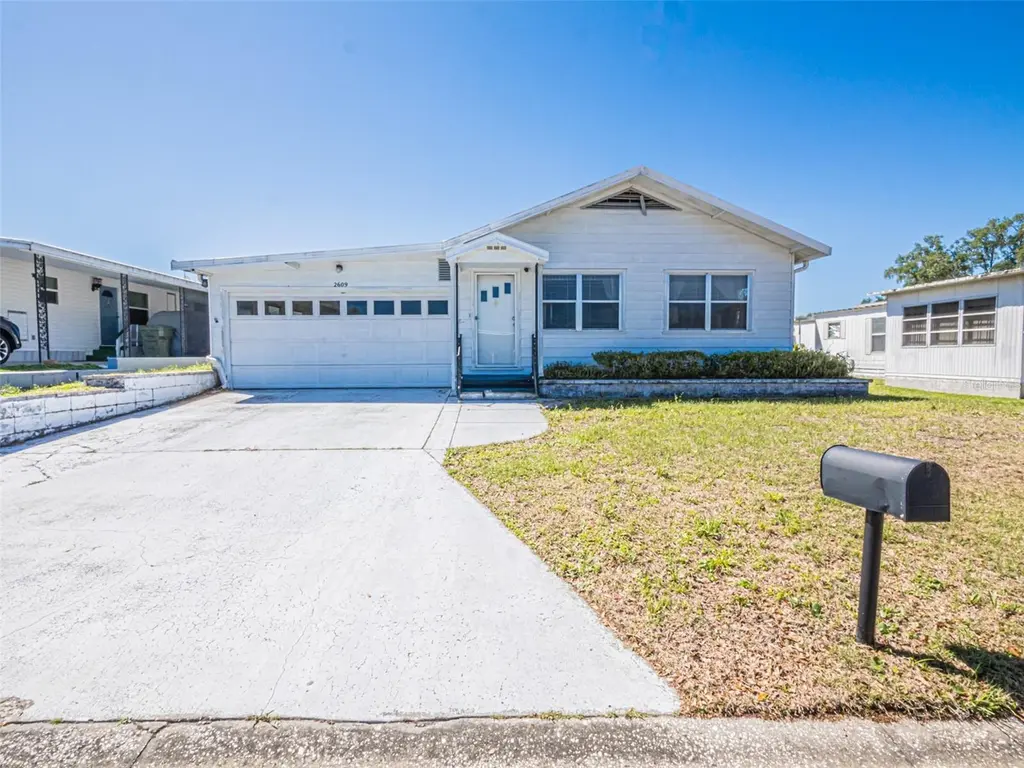
2609 Houston Pl · Leesburg, FL
Flood risk 1/10 · Minimal
- FEMA flood zone
- X (unshaded)
- Chance of flooding over 30 yrs
- 0.0%
- Est. flood insurance / yr
- $507 – $1,088
Fire risk 4/10 · Minor
- Est. fire insurance / yr
- $947 – $1,759
Heat risk 8/10 · Major
- Hot days now (above 108°F)
- 7 days/yr
- Hot days in 30 yrs
- 22 days/yr
Wind risk 9/10 · Severe
- Chance of severe wind over 30 yrs
- 99.0%
Air-quality risk 2/10 · Minimal
- Unhealthy air days now
- 1 days/yr
- Unhealthy air days in 30 yrs
- 1 days/yr
Risk factors via First Street. Map © Google.
Why this score? — see what drove the B- grade
The composite is a weighted blend of 9 inputs, each scored 0–100. Each bar is that input's sub-score; the figure is the points it added to the 100-point composite (weight × sub-score).
- Cash flow +30.0/30.0
- DSCR +10.0/10.0
- 1% rule +8.7/10.0
- ARV discount +7.5/15.0
- Schools +4.2/10.0
- Livability +3.1/5.0
- Condition / age +2.5/5.0
- Rent growth +2.3/5.0
- Appreciation +0.0/10.0
$125,000
🖨 Deal sheet 📄 Offer letter ✓ Due diligence
Listing remarks
Bring your vision and unlock the potential of this unique manufactured home in Coachwood Colony, a desirable 55+ community! This spacious 2-bedroom, 2-bath home offers a layout you don't often find, featuring an expansive living area perfect for entertaining or relaxing in comfort. One of the standout features is the attached 2-car garage, complete with a dedicated laundry room, workshop and separate office space - ideal for hobbies, storage or working from home. An added attic space provides even more room for storage, making this home as functional as it is versatile. Enjoy the Florida lifestyle from you lanai, offering a great space to unwind or host guests. While the home does need som
Key facts
- Workshop
- 5,040 sq ft lot
- 2 garage spots
Tags
Property features AI
Finance
- Other: Furnished; Total acreage: less than 1/4 acre (approximately 0.11 acre)
- HOA & community: HOA (Donna Parish) with optional annual fee of $616.80 ($51.40 monthly); Senior community; Clubhouse; Pool; Street lights; Pets allowed
Exterior
- Parking: Attached garage with 2 spaces
- Utilities: Public water; Public sewer; Cable available; Phone available; Sewer connected; Water connected; Fire hydrant nearby
- Home design: Residential mobile home; Double wide; One level; North-facing
- Construction: Metal siding; Metal roof; Crawlspace foundation; Pillar/post/pier foundation; Built on/recorded 1990s–2000s (double wide mobile home — year built not provided)
- Exterior features: Awning(s); Asphalt road
Interior
- Kitchen: Built-In Oven; Dishwasher; Range Hood; Refrigerator
- Bedrooms: 3 bedrooms
- Flooring: Carpet; Linoleum
- Bathrooms: 2 full bathrooms
- Heating & cooling: Natural gas heating; Central air conditioning
- Interior features: Thermostat; Attic; Den/Library/Office; Storage rooms
- Laundry & utility: Washer; Dryer; Gas water heater; Laundry in garage
Neighborhood map
What this means for you Summary
Snapshot
- This is a 3-bed/2.0-bath manufactured listed at $125k.
Deal economics
- At list price, monthly cash flow is $548 ($7k/yr) — positive.
- The deal already cash-flows at list — no discount required.
- Meets the 1% rule at list price ($2k rent vs $125k).
- Recommended offer: $118k (6.0% below list) — sets the bar for market timing.
- Cap rate 11.6% vs local median 4.5% in Leesburg — top-decile yield for the area; either an underpriced asset or a hidden risk that comps aren't pricing in. Stress-test before assuming the spread holds.
Location & tenants
- Location reads 62/100 on livability (#751 in FL) — a middle-class / working-renter tenant base. Strengths: cost of living A+, housing A+; Watch: schools D+, crime D, amenities F.
- Lake (suburban): math 49% / reading 50% proficiency, ranked #37 of 73 in FL (top 51%) — families likely to look elsewhere, expect single-tenant / working-renter base with shorter leases.
- Market conditions: Rents soft (-0.9%/yr); 783 active listings in the ZIP; 19 comparable units currently listed for rent nearby; rentals at typical pace (median 18d on market — plan ~3-4 weeks tenant-placement turnaround); 4,799 units permitted in Lake County in 2024 (814 in 5+ unit buildings).
- This rent runs 35% of the median local income ($58k/yr) — at the standard rent-burdened threshold; future hikes will face affordability resistance.
Forward outlook
- Local home prices are declining (-3.0%/yr); year-one equity from $864 of loan paydown is wiped out by about $4k of value loss. Plan a longer hold.
- Lake County population projected at +37% by 2050 — long-run rental-demand tailwind backs the buy-and-hold thesis.
- At projected returns (-3.0% appreciation + 0.0% rent growth), your $35k cash investment doubles in ~9 years — after that, you're playing with house money.
Negotiation context
- It's been on market 72 days — a 6% lower offer ($118k) is reasonable based on typical stale-listing flexibility.
- Current owner paid $55k; list at $125k implies a 127% gain — meaningful room to come down on a strong offer.
Risks & watch-outs
- Climate carrying-cost: severe wind risk, 99% chance of damaging wind over 30y; extreme-heat days projected 7→22/yr by 2055 (HVAC capex compounding) — expect insurance premiums to compound above CPI over the hold.
Questions for the listing agent
- It's been on market 72 days. Have you received any prior offers? Is the seller open to a 6% concession, seller financing, or rate buy-down credit?
- Built in 1972 — when were the roof, HVAC, electrical panel, plumbing, and water heater last replaced?
- What does the HOA fee cover, when was the last increase, and are there any pending special assessments or reserve-fund shortfalls?
- Why hasn't it sold? Are there any deal-killer items the seller is aware of (foundation, flood, title, zoning, code violations)?
- Is there a deadline driving the sale (1031 exchange, divorce, estate, relocation)? That informs how much negotiation room exists.
- Schools are D-rated, which usually means shorter tenancies and higher turnover. Who's the typical renter profile here, and what's been the actual vacancy rate?
- Crime grade is D in this area — have there been break-ins, vandalism, or insurance claims at this property in the last 3 years? What carrier currently insures it and at what premium?
- What's the average days-on-market for RENTAL listings here right now (not sales)? A rising rental-DOM trend means longer vacancies and softer asking-rent achievability than the comps imply.
- What's the recent tenant-quality profile in this submarket — average credit score on applications, eviction rate, late-payment / NSF rate, and stable-employment percentage? A property-management company in the area should have these aggregated.
- How much new for-sale + rental construction is in the pipeline within 1–3 miles? Heavy new supply typically softens prices + rents 12–24 months out; constrained supply supports both.
Investment metrics
- 1% rule
- 1.37% ✓
- Cap rate
- 11.56%
- Cash-on-cash
- 18.80%
- DSCR
- 1.84
- GRM
- 6.1
CMA / ARV
No comps found within radius.
Projected returns pro-forma
-3.0% appreciation · 0.0% rent growth · sell at horizon
- IRR
- 7.3%
- Equity multiple
- 1.28×
- Total profit
- $9,629
- Equity at exit
- $18,638
- IRR
- 13.9%
- Equity multiple
- 1.97×
- Total profit
- $33,893
- Equity at exit
- $10,808
Cash invested: $35,000 (down + closing). Projections, not guarantees.
Landlord ↔ Tenant lean methodology
- Overall (STATE)
- 87 Strongly Landlord-Friendly
- State Florida
- 87 Strongly Landlord-Friendly · R+3
- County
- — inherits STATE
- City
- — inherits STATE
ZIP-level market 34748
- Home prices YoY
- -25.3%
- Rents YoY
- -0.9%
- Active inventory
- 783
- Price-to-rent
- 6.1×
Monthly cashflow live
- Estimated rent
- $1,714 high interval (Pro) →
- Mortgage (P&I)
- −$656
- Tax from tax record
- −$48 /mo · $571/yr
- Insurance
- −$52
- HOA
- −$51
- Vacancy / Maint / Mgmt
- −$360
- Net cashflow
- $548
Break-even live
UW: 25.0% down · 7.5% · 30yr · 1.5% tax · 5.0% vac · 8.0% maint · 8.0% mgmt
Financing live
Cash to close
- Down payment
- $31,250
- Closing costs
- $3,750
- Reserves months
- —
- Total cash needed
- —
Loan-product check · same deal, 3 products live
Conventional
25% down · 7.5% · 30yr
- Down + closing
- —
- Monthly P&I
- —
- Monthly cashflow
- —
- DSCR
- —
- Eligible?
- —
Personal DTI + credit; lowest rate.
DSCR
20% down · 8.5% · 30yr
- Down + closing
- —
- Monthly P&I
- —
- Monthly cashflow
- —
- DSCR
- —
- Eligible?
- —
No personal income docs; deal must DSCR.
Hard money
10% down · 12.0% · 12mo
- Down + closing
- —
- Monthly P&I
- —
- Monthly cashflow
- —
- DSCR
- —
- Eligible?
- —
Short-term bridge; refi at stabilization.
Rent comps 19 comps
| Address | Beds | Baths | Sqft | Rent | $/sqft | DOM | Units | Dist |
|---|---|---|---|---|---|---|---|---|
| 2602 Houston Pl Leesburg, FL | 2.0 | 2.0 | 960 | $1,895 | $1.97 | 5d | 1 | 0.07mi |
| 513 Old Colony Rd Leesburg, FL | 3.0 | 2.0 | 1198 | $1,699 | $1.42 | 5d | 1 | 0.24mi |
| 502 Old Colony Rd Leesburg, FL | 3.0 | 2.0 | 1456 | $1,299 | $0.89 | 24d | 1 | 0.28mi |
| 1004 Royal Oak Blvd Unit 1004 Leesburg, FL | 2.0 | 2.5 | 1244 | $1,550 | $1.25 | 4d | 1 | 0.46mi |
| 2920 Pecan Ave Leesburg, FL | 2.0 | 2.5 | 1288 | $1,700 | $1.32 | 24d | 1 | 0.50mi |
| 822 S Lone Oak Dr Unit B Leesburg, FL | 2.0 | 1.0 | 900 | $1,195 | $1.33 | 24d | 1 | 0.52mi |
| 2940 Peach St Leesburg, FL | 2.0 | 2.5 | 1288 | $1,750 | $1.36 | 18d | 1 | 0.52mi |
| 3019 Walnut Ct Leesburg, FL | 3.0 | 2.0 | 1854 | $1,799 | $0.97 | 3d | 1 | 0.57mi |
| 3029 Walnut Ct Leesburg, FL | 3.0 | 2.0 | 1854 | $1,799 | $0.97 | 3d | 1 | 0.58mi |
| 3029 Walnut Ct Leesburg, FL | 3.0 | 2.0 | 1854 | $1,799 | $0.97 | 5d | 1 | 0.58mi |
| 210 N Lone Oak Dr Unit 1 Leesburg, FL | 2.0 | 1.0 | 912 | $1,250 | $1.37 | 15d | 1 | 0.85mi |
| 200 S Moss St Leesburg, FL | 3.0 | 2.0 | 968 | $1,500 | $1.55 | 24d | 1 | 1.03mi |
| 1604 Woodlyn Dr Leesburg, FL | 3.0 | 1.5 | 1088 | $1,500 | $1.38 | 24d | 1 | 1.04mi |
| 1321 Cambridge Dr Leesburg, FL | 4.0 | 2.0 | 912 | $1,800 | $1.97 | 18d | 1 | 1.06mi |
| 1317 Cambridge Dr Leesburg, FL | 3.0 | 1.5 | 1240 | $1,600 | $1.29 | 24d | 1 | 1.07mi |
| 1220 W Dixie Ave Leesburg, FL | 3.0 | 2.0 | 1304 | $1,600 | $1.23 | 5d | 1 | 1.35mi |
| 1013 Beecher St Unit 1 Leesburg, FL | 3.0 | 1.0 | 900 | $1,250 | $1.39 | 22d | 1 | 1.43mi |
| 1009 McCormack St Leesburg, FL | 2.0 | 1.0 | 1400 | $1,025 | $0.73 | 24d | 1 | 1.46mi |
| 1401 Floradel Ave Leesburg, FL | 2.0 | 1.0 | 1190 | $1,495 | $1.26 | 3d | 1 | 1.49mi |
HOA detail
- Monthly dues
- $51 · $612/yr
Listing history 15 events
-
2026-06-18days on market $125,000 Active 72 DOM
-
2026-06-17days on market $125,000 Active 71 DOM
-
2026-06-16days on market $125,000 Active 70 DOM
-
2026-06-15days on market $125,000 Active 69 DOM
-
2026-06-13days on market $125,000 Active 67 DOM
-
2026-06-09days on market $125,000 Active 63 DOM
-
2026-06-08days on market $125,000 Active 62 DOM
-
2026-06-07days on market $125,000 Active 61 DOM
-
2026-06-04days on market $125,000 Active 58 DOM
-
2026-06-03days on market $125,000 Active 57 DOM
-
2026-06-02days on market $125,000 Active 56 DOM
-
2026-06-01days on market $125,000 Active 55 DOM
-
2026-05-31days on market $125,000 Active 54 DOM
-
2026-04-07$125,000 Active
-
2000-11-22soldstatus $55,000
ⓘ Source: listings_history table (triggers on properties + properties_extension) + one-shot
backfill from property_details.listing_events for pre-trigger history.
Tax reassessment forecast FL · Resets to sale price
- Current annual tax
- $571 · $48/mo
- Projected year-2 tax
- $1,038 · $86/mo
- Expected delta
- +$467/yr (+$39/mo · 81.8%)
ⓘ Screening estimate from a state-policy table — verify with the county assessor before closing.
Climate risk First Street
- Flood 1/10 Low FEMA zone X (unshaded) · 0% chance over 30 yrs
- Wildfire 4/10 Moderate
- Heat 8/10 Severe 7 d/yr ≥108°F today · 22 d/yr by 30 yrs out
- Wind 9/10 Extreme 99% chance of damaging wind over 30 yrs
- Air quality 2/10 Low 1 unhealthy d/yr today · 1 by 30 yrs out
Nearby sold comps map
Loading sold comps map…
Walkable amenities ~0.75 mi
Loading nearby amenities…
Taxation est. · year 1
- Rental income
- $20,573
- − Mortgage interest
- −$7,002
- − Property taxes
- −$571
- − Insurance
- −$625
- − Repairs & maintenance
- −$1,646
- − Management
- −$1,646
- − HOA
- −$612
- − Depreciation
- −$3,636
- Taxable income
- $4,836
- Est. tax owed @ 24.0%
- −$1,161
- After-tax cash flow
- $5,419/yr
For passive investors: Depreciation is non-cash, so a rental often shows a tax loss while cash-flowing — sheltering income. Rental losses are passive: they offset passive income freely, and up to $25,000/yr can offset ordinary (W-2) income if you actively participate and your MAGI is under $100k (phasing out to $0 by $150k); unused losses carry forward. On sale, claimed depreciation is recaptured at up to 25%, and gains may owe capital-gains tax (a 1031 exchange can defer both). Figures are a year-1 estimate at your 24.0% rate — not tax advice; consult a CPA.
Schools (NCES district)
- District
- Lake
- NCES district ID
- 1201050
- Math proficiency
- 49% ▼ -7.00%
- Reading proficiency
- 50% ▼ -4.00%
- Median HH income
- $46,632
- Composite
- 42.05/100
- National rank
- #3327
- State rank
- #37 of 73 in FL
Livability — Leesburg
- Score
- 62/100
- State rank
- #751
- US rank
- #16429
Category grades
Schools grade is shown separately in the Schools card above.
Census & demographics
- Census place
- Leesburg, FL
- County
- Lake County · 364,602 people
- City population
- 70,232
- Metro
- Orlando-Kissimmee-Sanford, FL
- Population (ZIP)
- 48,095
- Household income
- $58,192
- Rent vs Own
- Severe rent burden
- 1745.0
Population outlook (Lake County) Hauer SSP2
- Today (2025)
- 386,640 people
- By 2030
- 417,107 · +7.9%
- By 2040
- 476,676 · +23.3%
- By 2050
- 531,296 · +37.4%
- By 2075
- 648,303 · +67.7%
- By 2100
- 698,530 · +80.7%
Race, ethnicity, and origin ACS 2023
- Neighborhood character
- Majority White (64%)
- Race & ethnicity
- White 64% Black 16% Hispanic / Latino 15% Two or more races 9% Asian 1%
- Hispanic origin (detail)
- Mexican 4% Puerto Rican 5% Cuban 3%
- Common ancestry
- Romanian 3% Lithuanian 3% Slovak 2%
- Foreign-born
- 9% · Canada, Vietnam, Jamaica
- Languages at home
- 88% English-only · Spanish 10% French/Haitian/Cajun 1%
Political lean MEDSL · Lake
- 2024 margin
- Strong R (+24.7) · D 37.3% · R 62.0%
- 2008→2024 swing
- -11.2pp toward R · 2008: -13.5pp · 2024: -24.7pp
- All cycles
- 2024: R+24.7 2020: R+20.0 2016: R+23.1 2012: R+17.1 2008: R+13.5
Not yet ingested
- Civics
- —
Market trends
- HPI YoY
- ▼ -88.97%
- Current HPI
- 262.1766
- Rent YoY
- ▼ -0.95%
- Metro
- Orlando-Kissimmee-Sanford, FL
- State GDP YoY
- ▲ 3.28%
- F500 in state
- 36
Industry mix (Fortune 500 HQ in FL)
| Industry | F500 HQs | Revenue |
|---|---|---|
| Industrial Technology | 2 | $29B |
|
||
| Insurance | 2 | $17B |
|
||
| Retail | 1 | $60B |
|
||
| Technology Distribution | 1 | $58B |
|
||
| Homebuilding | 1 | $35B |
|
||
| Technology Manufacturing | 1 | $35B |
|
||
Price history
+127.3% since first listed2 events — show timeline
- 2026-04-07 Listed $125,000 Stellar MLS as Distributed by MLS Grid
- 2000-11-22 Sold (Public Records) $55,000 Public Records
Property tax history
+6.0%/yrLatest (2025): $571 · +3.9% YoY. Source: county tax records.
Cash-flow waterfall
monthlySold comps — $/sqft
last 12 mo · ≤1 miLoading sold comps…