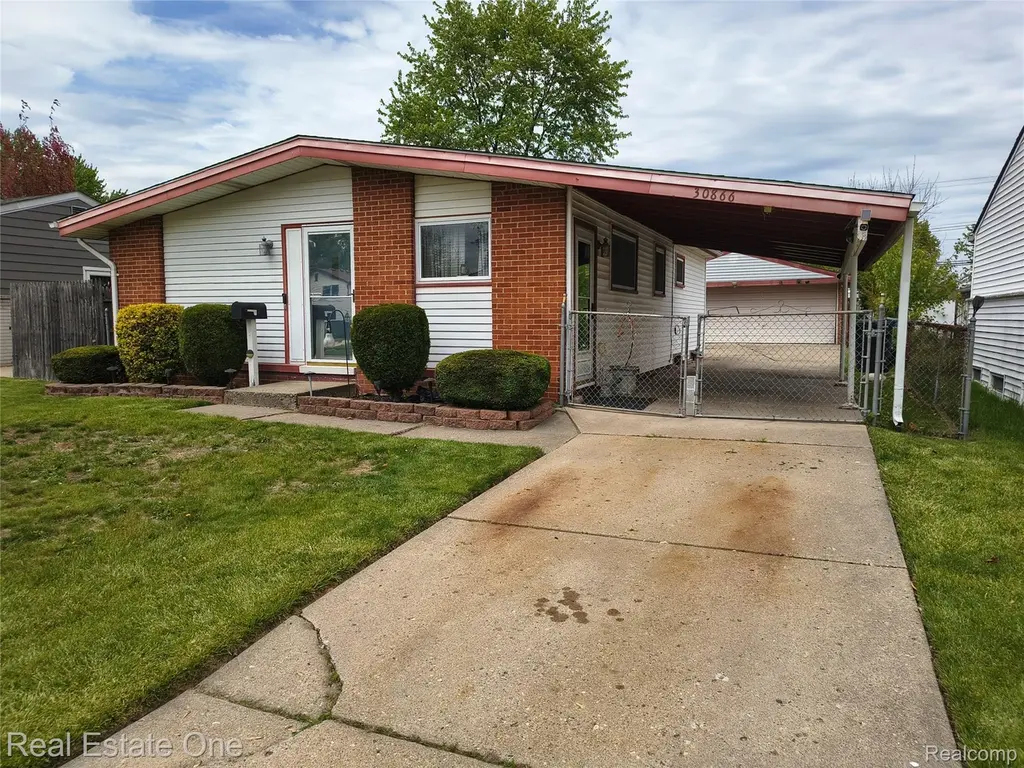
30866 Middlebury St · Westland, MI
Flood risk 3/10 · Minor
- FEMA flood zone
- X (unshaded)
- Chance of flooding over 30 yrs
- 0.2%
- Est. flood insurance / yr
- $473 – $860
Fire risk 1/10 · Minimal
- Est. fire insurance / yr
- $784 – $1,456
Heat risk 3/10 · Minor
- Hot days now (above 98°F)
- 7 days/yr
- Hot days in 30 yrs
- 15 days/yr
Wind risk 2/10 · Minimal
- Chance of severe wind over 30 yrs
- —
Air-quality risk 2/10 · Minimal
- Unhealthy air days now
- 1 days/yr
- Unhealthy air days in 30 yrs
- 2 days/yr
Risk factors via First Street. Map © Google.
Why this score? — see what drove the F grade
The composite is a weighted blend of 9 inputs, each scored 0–100. Each bar is that input's sub-score; the figure is the points it added to the 100-point composite (weight × sub-score).
- Cash flow +8.4/30.0
- Livability +3.9/5.0
- Rent growth +3.3/5.0
- Condition / age +2.5/5.0
- DSCR +2.3/10.0
- 1% rule +2.0/10.0
- Schools +1.6/10.0
- ARV discount +0.0/15.0
- Appreciation +0.0/10.0
$199,500
🖨 Deal sheet 📄 Offer letter ✓ Due diligence
Listing remarks MLS
Westlands Best Brick Ranch value!!! Move in for $6,995 or less total! Payments as low as $1699 per month! Home offers 3 bedrooms, 2 baths-one full, Large finished basement, huge 24 x 24 2.5 car garage. Nice spacious kitchen with the stove and fridge included in the sale. Washer and dryer included as well! Inviting living room with convenient doorwall for patio access. Possible 4th bedroom, office or more storage in the basement as well. Your choice!! Nice bath featuring a waterfall sink. Home also offers a great carport. See pics! Newer Furnace and Central air approx 3 years old. Attic fan in main hallway. Hardwood floors under carpet too! Immediate occupancy offered. Move in today!!
Key facts
- Newer furnace
- Spacious kitchen
- Carport
Tags
Property features AI
Exterior
- Parking: Detached garage; 2 garage spaces; Carport
- Utilities: Public water; Public sewer; Cable available
- Home design: Single family residence; One level; Ground-level entry; Brick construction
- Construction: Brick construction
- Exterior features: Patio; Porch; Fenced yard
Interior
- Kitchen: Dishwasher; Disposal; Free-standing electric range; Range hood; Free-standing refrigerator
- Bathrooms: 1 full bathroom; 1 half bathroom
- Heating & cooling: Forced air heating (natural gas); Central air; Attic fan
- Interior features: Finished basement; Lighting
- Laundry & utility: Washer; Dryer; Gas water heater
Neighborhood map
What this means for you Summary
Snapshot
- This is a 3-bed/1.0-bath single-family listed at $200k.
Deal economics
- At list price, monthly cash flow is $-181 ($-2k/yr) — negative.
- To cash-flow at today's rent, offer at most $168k (16.0% below list).
- To meet the 1% rule (rent ≥ 1% of price), the offer needs to be $139k (30.3% below list).
- Recommended offer: $139k (30.3% below list) — sets the bar for 1% rule.
Location & tenants
- Location reads 77/100 on livability (#124 in MI, #3,067 nationally) — a middle-class / working-renter tenant base. Strengths: commute A+, cost of living A+, housing A+; Watch: amenities C-, employment C-, crime D+.
- Wayne-Westland Community School District (suburban): math 11% / reading 27% proficiency, ranked #474 of 540 in MI (top 88%) — low school quality limits family demand, transient renter base, plan for 1-2y turnover.
- Market conditions: Rents rising (+3.3%/yr); 146 active listings in the ZIP; 18 comparable units currently listed for rent nearby; rentals at typical pace (median 24d on market — plan ~3-4 weeks tenant-placement turnaround); 2,639 units permitted in Wayne County in 2024 (1,216 in 5+ unit buildings).
Forward outlook
- Local home prices are declining (-3.0%/yr); year-one equity from $1k of loan paydown is wiped out by about $6k of value loss. Plan a longer hold.
- Wayne County population projected at -17% by 2050 — secular population decline; favor cash flow + early exit over multi-decade hold.
Negotiation context
- It's been on market 33 days — a 3% lower offer ($194k) is reasonable based on typical stale-listing flexibility.
- 3 sale attempts since 17y ago with the ask held roughly flat each time — persistent listings suggest the price (not the market) is what's stuck; bring a comps-based counter.
Questions for the listing agent
- What do current leases actually rent for vs. the listed asking? Can we see a recent rent roll and the last 12 months of T-12 income?
- It's been on market 33 days. Have you received any prior offers? Is the seller open to a 30% concession, seller financing, or rate buy-down credit?
- Built in 1961 — when were the roof, HVAC, electrical panel, plumbing, and water heater last replaced?
- Is there a deadline driving the sale (1031 exchange, divorce, estate, relocation)? That informs how much negotiation room exists.
- Schools are D-rated, which usually means shorter tenancies and higher turnover. Who's the typical renter profile here, and what's been the actual vacancy rate?
- Crime grade is D in this area — have there been break-ins, vandalism, or insurance claims at this property in the last 3 years? What carrier currently insures it and at what premium?
- The area grade is low — what's the realistic commute time and amenity access for the typical tenant pool here? Any planned neighborhood developments (good or bad) we should know about?
- What's the average days-on-market for RENTAL listings here right now (not sales)? A rising rental-DOM trend means longer vacancies and softer asking-rent achievability than the comps imply.
- What's the recent tenant-quality profile in this submarket — average credit score on applications, eviction rate, late-payment / NSF rate, and stable-employment percentage? A property-management company in the area should have these aggregated.
- How much new for-sale + rental construction is in the pipeline within 1–3 miles? Heavy new supply typically softens prices + rents 12–24 months out; constrained supply supports both.
Investment metrics
- 1% rule
- 0.70% ✗
- Cap rate
- 5.21%
- Cash-on-cash
- -3.88%
- DSCR
- 0.83
- GRM
- 12.0
CMA / ARV
- ARV (on-the-fly)
- $137,864
- Comps found
- 12
Show comp detail 12 sales within ~0.75 mi
| Address | Dist | Beds/Ba | Sqft | Sold | Price | $/sf | Match |
|---|---|---|---|---|---|---|---|
| 1255 Windham St | 0.17mi | 3/1.0 | 895 (-1%) | 5mo | $206,000 | $230 | 86 |
| 1728 Westchester St | 0.16mi | 3/1.5 | 998 (+10%) | 3mo | $225,000 | $225 | 71 |
| 32304 Hazelwood St | 0.61mi | 3/1.0 | 882 (-3%) | 1mo | $215,000 | $244 | 66 |
| 31905 Saginaw Ct | 0.52mi | 2/1.0 (-1) | 834 (-8%) | 0mo | $127,000 | $152 | 57 |
| 30270 Spring Arbor Dr | 0.42mi | 3/1.0 | 1,025 (+13%) | 5mo | $130,000 | $127 | 55 |
| 32004 Otsego St | 0.53mi | 2/1.0 (-1) | 974 (+7%) | 4mo | $135,500 | $139 | 55 |
| 30939 Hiveley St | 0.57mi | 2/1.5 (-1) | 955 (+5%) | 5mo | $115,000 | $120 | 53 |
| 31680 Birchwood St | 0.58mi | 3/1.0 | 1,001 (+10%) | 3mo | $130,000 | $130 | 53 |
| 32151 Grandview Ave | 0.65mi | 3/1.5 | 1,000 (+10%) | 3mo | $266,000 | $266 | 48 |
| 32330 Grandview Ave | 0.74mi | 3/1.0 | 999 (+10%) | 1mo | $190,000 | $190 | 48 |
| 32332 Kalamazoo Ct | 0.75mi | 2/1.0 (-1) | 834 (-8%) | 4mo | $119,000 | $143 | 43 |
| 29800 Oakwood St | 0.70mi | 3/1.0 | 1,040 (+15%) | 4mo | $90,000 | $87 | 40 |
Match score weights: distance 35% · size 25% · config 20% · recency 20%. Top-matched comps best support the ARV.
Projected returns pro-forma
-3.0% appreciation · 3.28% rent growth · sell at horizon
- IRR
- -22.6%
- Equity multiple
- 0.22×
- Total profit
- $-43,480
- Equity at exit
- $29,746
- IRR
- -16.3%
- Equity multiple
- 0.08×
- Total profit
- $-51,218
- Equity at exit
- $17,249
Cash invested: $55,860 (down + closing). Projections, not guarantees.
Landlord ↔ Tenant lean methodology
- Overall (STATE)
- 62 Landlord-Friendly
- State Michigan
- 62 Landlord-Friendly · EVEN
- County
- — inherits STATE
- City
- — inherits STATE
ZIP-level market 48186
- Rents YoY
- 3.3%
- Active inventory
- 146
- Price-to-rent
- 12.0×
Monthly cashflow live
- Estimated rent
- $1,391 high interval (Pro) →
- Mortgage (P&I)
- −$1,046
- Tax from tax record
- −$150 /mo · $1,802/yr
- Insurance
- −$83
- HOA
- −$0
- Vacancy / Maint / Mgmt
- −$292
- Net cashflow
- $-181
Break-even live
UW: 25.0% down · 7.5% · 30yr · 1.5% tax · 5.0% vac · 8.0% maint · 8.0% mgmt
Financing live
Cash to close
- Down payment
- $49,875
- Closing costs
- $5,985
- Reserves months
- —
- Total cash needed
- —
Loan-product check · same deal, 3 products live
Conventional
25% down · 7.5% · 30yr
- Down + closing
- —
- Monthly P&I
- —
- Monthly cashflow
- —
- DSCR
- —
- Eligible?
- —
Personal DTI + credit; lowest rate.
DSCR
20% down · 8.5% · 30yr
- Down + closing
- —
- Monthly P&I
- —
- Monthly cashflow
- —
- DSCR
- —
- Eligible?
- —
No personal income docs; deal must DSCR.
Hard money
10% down · 12.0% · 12mo
- Down + closing
- —
- Monthly P&I
- —
- Monthly cashflow
- —
- DSCR
- —
- Eligible?
- —
Short-term bridge; refi at stabilization.
Rent comps 18 comps
| Address | Beds | Baths | Sqft | Rent | $/sqft | DOM | Units | Dist |
|---|---|---|---|---|---|---|---|---|
| 31820 Bay Ct Westland, MI | 2.0 | 1.0 | 834 | $1,125 | $1.35 | 16d | 1 | 0.34mi |
| 30010 Hazelwood St Inkster, MI | 3.0 | 1.0 | 1044 | $1,300 | $1.25 | 43d | 1 | 0.54mi |
| 29971 Brooklane St Inkster, MI | 3.0 | 1.0 | 974 | $1,450 | $1.49 | 43d | 1 | 0.56mi |
| 30043 Grandview St Unit 1 Inkster, MI | 3.0 | 1.5 | 1004 | $1,275 | $1.27 | 43d | 1 | 0.60mi |
| 30520 Hiveley St Westland, MI | 3.0 | 1.0 | 1105 | $1,700 | $1.54 | 21d | 1 | 0.64mi |
| 29800 Oakwood St Inkster, MI | 3.0 | 1.0 | 1040 | $1,400 | $1.35 | 12d | 1 | 0.69mi |
| 130 E Tami Cir Westland, MI | 1.0–2.0 | 1.0–1.5 | 800 | $1,209 | $1.51 | 43d | 3 | 0.80mi |
| 31217 Cherry Hill Rd Westland, MI | 3.0 | 1.0 | 1100 | $1,800 | $1.64 | 4d | 1 | 0.80mi |
| 32448 Birchwood St Westland, MI | 3.0 | 1.0 | 963 | $1,675 | $1.74 | 16d | 1 | 0.84mi |
| 29203 Oakwood St Inkster, MI | 3.0 | 1.5 | 912 | $1,600 | $1.75 | 1d | 1 | 0.92mi |
| 110 Waterbury Ct Westland, MI | 2.0 | 1.0–2.0 | 581 | $1,350 | $2.32 | 1d | 7 | 1.04mi |
| 32860 Mecosta St Unit 1 Westland, MI | 2.0 | 1.0 | 900 | $1,200 | $1.33 | 43d | 1 | 1.06mi |
| 32860 Mecosta St Westland, MI | 2.0 | 1.0 | 1000 | $1,150 | $1.15 | 43d | 1 | 1.06mi |
| 2036 Alberta St Westland, MI | 3.0 | 1.0 | 936 | $1,325 | $1.42 | 43d | 1 | 1.09mi |
| 536 N Leona Ave Garden City, MI | 3.0 | 1.0 | 1000 | $1,440 | $1.44 | 12d | 1 | 1.19mi |
| 33000 Parkhill St Wayne, MI | 1.0–2.0 | 1.0–1.5 | 800 | $1,240 | $1.55 | 24d | 1 | 1.26mi |
| 33507 Berville Ct Westland, MI | 2.0 | 1.5 | 907 | $1,350 | $1.49 | 2d | 1 | 1.30mi |
| 1150 Magnolia Dr Inkster, MI | 3.0 | 1.0 | 900 | $1,300 | $1.44 | 24d | 1 | 1.40mi |
Listing history 18 events
-
2026-06-18days on market $199,500 Active 33 DOM
-
2026-06-17days on market $199,500 Active 32 DOM
-
2026-06-16days on market $199,500 Active 31 DOM
-
2026-06-15days on market $199,500 Active 30 DOM
-
2026-06-13days on market $199,500 Active 28 DOM
-
2026-06-13days on market $199,500 Active 27 DOM
-
2026-06-09days on market $199,500 Active 24 DOM
-
2026-06-08pricedays on market $199,500 Active 23 DOM
-
2026-06-07days on market $204,900 Active 22 DOM
-
2026-06-04days on market $204,900 Active 19 DOM
-
2026-06-03days on market $204,900 Active 18 DOM
-
2026-06-02days on market $204,900 Active 17 DOM
-
2026-06-01days on market $204,900 Active 16 DOM
-
2026-05-31days on market $204,900 Active 15 DOM
-
2026-05-16$209,900 Active
Show marketing remark (692 chars)
Westlands Best Brick Ranch value!!! Move in for $6,995 or less total! Payments as low as $1699 per month! Home offers 3 bedrooms, 2 baths-one full, Large finished basement, huge 24 x 24 2.5 car garage. Nice spacious kitchen with the stove and fridge included in the sale. Washer and dryer included as well! Inviting living room with convenient doorwall for patio access. Possible 4th bedroom, office or more storage in the basement as well. Your choice!! Nice bath featuring a waterfall sink. Home also offers a great carport. See pics! Newer Furnace and Central air approx 3 years old. Attic fan in main hallway. Hardwood floors under carpet too! Immediate occupancy offered. Move in today!!
-
2026-05-16$209,900 Active 692-char remark
Show marketing remark (692 chars)
Westlands Best Brick Ranch value!!! Move in for $6,995 or less total! Payments as low as $1699 per month! Home offers 3 bedrooms, 2 baths-one full, Large finished basement, huge 24 x 24 2.5 car garage. Nice spacious kitchen with the stove and fridge included in the sale. Washer and dryer included as well! Inviting living room with convenient doorwall for patio access. Possible 4th bedroom, office or more storage in the basement as well. Your choice!! Nice bath featuring a waterfall sink. Home also offers a great carport. See pics! Newer Furnace and Central air approx 3 years old. Attic fan in main hallway. Hardwood floors under carpet too! Immediate occupancy offered. Move in today!!
-
2009-02-17historical
-
2009-02-04$99,900
ⓘ Source: listings_history table (triggers on properties + properties_extension) + one-shot
backfill from property_details.listing_events for pre-trigger history.
Tax reassessment forecast MI · Partial reset (capped growth)
- Current annual tax
- $1,802 · $150/mo
- Projected year-2 tax
- $2,437 · $203/mo
- Expected delta
- +$635/yr (+$53/mo · 35.2%)
ⓘ Screening estimate from a state-policy table — verify with the county assessor before closing.
Climate risk First Street
- Flood 3/10 Moderate FEMA zone X (unshaded) · 20% chance over 30 yrs
- Wildfire 1/10 Low
- Heat 3/10 Moderate 7 d/yr ≥98°F today · 15 d/yr by 30 yrs out
- Wind 2/10 Low
- Air quality 2/10 Low 1 unhealthy d/yr today · 2 by 30 yrs out
Nearby sold comps map
Loading sold comps map…
Walkable amenities ~0.75 mi
Loading nearby amenities…
Taxation est. · year 1
- Rental income
- $16,692
- − Mortgage interest
- −$11,175
- − Property taxes
- −$1,802
- − Insurance
- −$998
- − Repairs & maintenance
- −$1,335
- − Management
- −$1,335
- − Depreciation
- −$5,804
- Taxable loss
- −$5,758
- Est. tax savings @ 24.0%
- +$1,382
- After-tax cash flow
- $-786/yr
For passive investors: Depreciation is non-cash, so a rental often shows a tax loss while cash-flowing — sheltering income. Rental losses are passive: they offset passive income freely, and up to $25,000/yr can offset ordinary (W-2) income if you actively participate and your MAGI is under $100k (phasing out to $0 by $150k); unused losses carry forward. On sale, claimed depreciation is recaptured at up to 25%, and gains may owe capital-gains tax (a 1031 exchange can defer both). Figures are a year-1 estimate at your 24.0% rate — not tax advice; consult a CPA.
Schools (NCES district)
- District
- Wayne-Westland Community School District
- NCES district ID
- 2600015
- Math proficiency
- 11% ▼ -6.00%
- Reading proficiency
- 27% ▼ -2.00%
- Median HH income
- $43,524
- Composite
- 16.4/100
- National rank
- #9195
- State rank
- #474 of 540 in MI
Livability — Westland
- Score
- 77/100
- State rank
- #124
- US rank
- #3067
Category grades
Schools grade is shown separately in the Schools card above.
Census & demographics
- Census place
- Westland, MI
- County
- Wayne County · 1,562,939 people
- City population
- 83,633
- Metro
- Detroit-Warren-Dearborn, MI
- Population (ZIP)
- 35,103
- Household income
- $65,187
- Rent vs Own
- Severe rent burden
- 980.0
Population outlook (Wayne County) Hauer SSP2
- Today (2025)
- 1,675,273 people
- By 2030
- 1,620,300 · -3.3%
- By 2040
- 1,502,341 · -10.3%
- By 2050
- 1,384,039 · -17.4%
- By 2075
- 1,124,592 · -32.9%
- By 2100
- 881,193 · -47.4%
Race, ethnicity, and origin ACS 2023
- Neighborhood character
- Diverse neighborhood (Simpson 0.57)
- Race & ethnicity
- White 61% Black 23% Two or more races 10% Hispanic / Latino 6% Asian 2%
- Hispanic origin (detail)
- Mexican 4%
- Common ancestry
- Romanian 8% Italian 3% Lithuanian 3%
- Foreign-born
- 7% · Canada, China
- Languages at home
- 88% English-only · Spanish 4% Other Indo-European 2% Arabic 1%
Political lean MEDSL · Wayne
- 2024 margin
- Strong D (+29.0) · D 62.7% · R 33.7% · Other 3.6%
- 2008→2024 swing
- -20.5pp toward R · 2008: 49.5pp · 2024: 29.0pp
- All cycles
- 2024: D+29.0 2020: D+38.1 2016: D+37.3 2012: D+46.9 2008: D+49.5
Not yet ingested
- Civics
- —
Market trends
- HPI YoY
- ▼ -262.09%
- Current HPI
- 237.6325
- Rent YoY
- ▲ 3.28%
- Metro
- Detroit-Warren-Dearborn, MI
- State GDP YoY
- ▲ 1.37%
- F500 in state
- 28
Industry mix (Fortune 500 HQ in MI)
| Industry | F500 HQs | Revenue |
|---|---|---|
| Automotive Parts | 3 | $48B |
|
||
| Automotive | 2 | $372B |
|
||
| Chemicals | 1 | $45B |
|
||
| Automotive Retail | 1 | $29B |
|
||
| Healthcare / Medical Devices | 1 | $23B |
|
||
| Automotive Technology | 1 | $20B |
|
||
Price history
+110.1% since first listed4 events — show timeline
- 2026-05-16 Listed $209,900 MiRealSource-MiMLS
- 2026-05-16 Listed $209,900 REALCOMP
- 2009-02-17 Listing Removed — REALCOMP
- 2009-02-04 Listed $99,900 REALCOMP
Property tax history
+0.6%/yrLatest (2025): $1,802 · -17.3% YoY. Source: county tax records.
Cash-flow waterfall
monthlySold comps — $/sqft
last 12 mo · ≤1 miLoading sold comps…