81 Kamberwood Ct · Inwood, WV
Flood risk 1/10 · Minimal
- FEMA flood zone
- X (unshaded)
- Chance of flooding over 30 yrs
- 0.0%
- Est. flood insurance / yr
- $473 – $860
Fire risk 5/10 · Moderate
- Est. fire insurance / yr
- $787 – $1,461
Heat risk 4/10 · Minor
- Hot days now (above 99°F)
- 7 days/yr
- Hot days in 30 yrs
- 16 days/yr
Wind risk 2/10 · Minimal
- Chance of severe wind over 30 yrs
- 1.0%
Air-quality risk 2/10 · Minimal
- Unhealthy air days now
- 0 days/yr
- Unhealthy air days in 30 yrs
- 1 days/yr
Risk factors via First Street. Map © Google.
Why this score? — see what drove the C- grade
The composite is a weighted blend of 9 inputs, each scored 0–100. Each bar is that input's sub-score; the figure is the points it added to the 100-point composite (weight × sub-score).
- Cash flow +16.5/30.0
- ARV discount +7.5/15.0
- Appreciation +6.6/10.0
- DSCR +5.1/10.0
- 1% rule +3.6/10.0
- Livability +3.2/5.0
- Schools +2.6/10.0
- Rent growth +2.5/5.0
- Condition / age +2.5/5.0
$200,000
🖨 Deal sheet 📄 Offer letter ✓ Due diligence
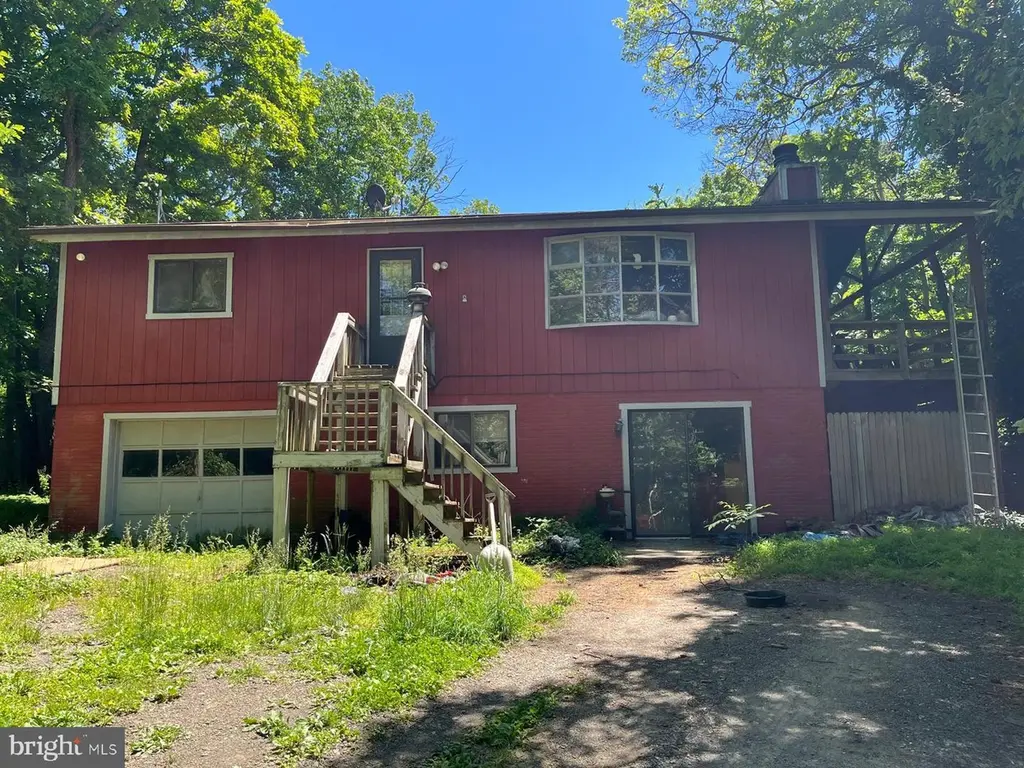
Listing remarks
3 bedroom / 2 bath home in the sought-after Deerwood subdivision. Home also has partial finished basement with additional 1/2 bath and bedroom/office area. Would be great for flipping or primary home for someone who is handy with making repairs. Home most likely will not go conventual financing. Cash or rehab financing only. No drive byes, please contact agent to schedule an appointment.
Key facts
- 1.01 acre lot
- Built 1983
- Listed 17 days
Property features AI
Finance
- HOA & community: HOA fee $38 monthly
Exterior
- Parking: Driveway
- Utilities: Public water; On-site septic
- Home design: Detached structure; Assessor-listed year built; Above-grade finished living area reported by assessor
- Construction: Wood siding; Wood foundation; Architectural shingle roof
- Exterior features: Outside city limits; Directions by GPS; No tidal water
Interior
- Bedrooms: 3 bedrooms on the main level
- Flooring: Carpet and wood flooring
- Bathrooms: 2 full bathrooms on the main level; 2 full bathrooms total
- Heating & cooling: Central heating (electric); Central air conditioning (electric); Electric hot water
- Interior features: Dry wall and paneled walls; Partially finished basement; Not in a federal flood zone; Level entry to main level
Neighborhood map
What this means for you Summary
Snapshot
- This is a 3-bed/2.0-bath single-family listed at $200k.
Deal economics
- At list price, monthly cash flow is $117 ($1k/yr) — positive.
- The deal already cash-flows at list — no discount required.
- To meet the 1% rule (rent ≥ 1% of price), the offer needs to be $172k (14.2% below list).
- Recommended offer: $172k (14.2% below list) — sets the bar for 1% rule.
- Cap rate 7.0% vs local median 3.7% in Inwood — top-decile yield for the area; either an underpriced asset or a hidden risk that comps aren't pricing in. Stress-test before assuming the spread holds.
Location & tenants
- Location reads 64/100 on livability (#143 in WV) — a middle-class / working-renter tenant base. Strengths: crime A+, housing A+; Watch: schools D-, amenities F, commute F.
- Berkeley County Schools (other): math 21% / reading 38% proficiency, ranked #24 of 55 in WV (top 44%) — low school quality limits family demand, transient renter base, plan for 1-2y turnover.
- Market conditions: 20 active listings in the ZIP; 1,460 units permitted in Berkeley County in 2024 (16 in 5+ unit buildings).
Forward outlook
- In year one you build about $8k of equity ($1k loan paydown + $6k appreciation (3.1% local appreciation)).
- Berkeley County population projected at +25% by 2050 — long-run rental-demand tailwind backs the buy-and-hold thesis.
- At projected returns (3.1% appreciation + 3.0% rent growth), your $56k cash investment doubles in ~6 years — after that, you're playing with house money.
- By year 5, paydown + projected appreciation supports a ~$33k cash-out refi (75% LTV) — recoverable capital for the next deal without selling this one.
Negotiation context
- It's been on market 17 days — a 2% lower offer ($197k) is reasonable based on typical stale-listing flexibility.
- 4 sale attempts since 24y ago with the ask held roughly flat each time — persistent listings suggest the price (not the market) is what's stuck; bring a comps-based counter.
- Current owner paid $64k; list at $200k implies a 212% gain — meaningful room to come down on a strong offer.
Risks & watch-outs
- Climate carrying-cost: moderate wildfire risk — expect insurance premiums to compound above CPI over the hold.
Questions for the listing agent
- What does the HOA fee cover, when was the last increase, and are there any pending special assessments or reserve-fund shortfalls?
- Is there a deadline driving the sale (1031 exchange, divorce, estate, relocation)? That informs how much negotiation room exists.
- Schools are D-rated, which usually means shorter tenancies and higher turnover. Who's the typical renter profile here, and what's been the actual vacancy rate?
- What's the average days-on-market for RENTAL listings here right now (not sales)? A rising rental-DOM trend means longer vacancies and softer asking-rent achievability than the comps imply.
- What's the recent tenant-quality profile in this submarket — average credit score on applications, eviction rate, late-payment / NSF rate, and stable-employment percentage? A property-management company in the area should have these aggregated.
- How much new for-sale + rental construction is in the pipeline within 1–3 miles? Heavy new supply typically softens prices + rents 12–24 months out; constrained supply supports both.
Investment metrics
- 1% rule
- 0.86% ✗
- Cap rate
- 7.00%
- Cash-on-cash
- 2.51%
- DSCR
- 1.11
- GRM
- 9.7
CMA / ARV
No comps found within radius.
Projected returns pro-forma
3.13% appreciation · 3.0% rent growth · sell at horizon
- IRR
- 10.2%
- Equity multiple
- 1.59×
- Total profit
- $32,848
- Equity at exit
- $91,365
- IRR
- 12.4%
- Equity multiple
- 2.87×
- Total profit
- $104,749
- Equity at exit
- $141,931
Cash invested: $56,000 (down + closing). Projections, not guarantees.
Landlord ↔ Tenant lean methodology
- Overall (STATE)
- 83 Strongly Landlord-Friendly
- State West Virginia
- 83 Strongly Landlord-Friendly · R+22
- County
- — inherits STATE
- City
- — inherits STATE
ZIP-level market 25420
- Home prices YoY
- 1.4%
- Active inventory
- 20
- Price-to-rent
- 9.7×
Monthly cashflow live
- Estimated rent
- $1,716 medium interval (Pro) →
- Mortgage (P&I)
- −$1,049
- Tax from tax record
- −$68 /mo · $818/yr
- Insurance
- −$83
- HOA
- −$38
- Vacancy / Maint / Mgmt
- −$360
- Net cashflow
- $117
Break-even live
UW: 25.0% down · 7.5% · 30yr · 1.5% tax · 5.0% vac · 8.0% maint · 8.0% mgmt
Financing live
Cash to close
- Down payment
- $50,000
- Closing costs
- $6,000
- Reserves months
- —
- Total cash needed
- —
Loan-product check · same deal, 3 products live
Conventional
25% down · 7.5% · 30yr
- Down + closing
- —
- Monthly P&I
- —
- Monthly cashflow
- —
- DSCR
- —
- Eligible?
- —
Personal DTI + credit; lowest rate.
DSCR
20% down · 8.5% · 30yr
- Down + closing
- —
- Monthly P&I
- —
- Monthly cashflow
- —
- DSCR
- —
- Eligible?
- —
No personal income docs; deal must DSCR.
Hard money
10% down · 12.0% · 12mo
- Down + closing
- —
- Monthly P&I
- —
- Monthly cashflow
- —
- DSCR
- —
- Eligible?
- —
Short-term bridge; refi at stabilization.
HOA detail
- Monthly dues
- $38 · $456/yr
Listing history 13 events
-
2026-06-18days on market $200,000 Active 17 DOM
-
2026-06-17days on market $200,000 Active 16 DOM
-
2026-06-16days on market $200,000 Active 15 DOM
-
2026-06-15days on market $200,000 Active 14 DOM
-
2026-06-14days on market $200,000 Active 12 DOM
-
2026-06-13days on market $200,000 Active 11 DOM
-
2026-06-10days on market $200,000 Active 9 DOM
-
2026-06-09days on market $200,000 Active 8 DOM
-
2026-06-09remarks 390-char remark
-
2026-06-08days on market $200,000 Active 7 DOM
-
2026-06-07days on market $200,000 Active 6 DOM
-
2026-06-01remarks 300-char remark
-
2026-06-01$200,000 Active 1 DOM
ⓘ Source: listings_history table (triggers on properties + properties_extension) + one-shot
backfill from property_details.listing_events for pre-trigger history.
Tax reassessment forecast WV · Resets to sale price
- Current annual tax
- $818 · $68/mo
- Projected year-2 tax
- $1,180 · $98/mo
- Expected delta
- +$362/yr (+$30/mo · 44.3%)
ⓘ Screening estimate from a state-policy table — verify with the county assessor before closing.
Climate risk First Street
- Flood 1/10 Low FEMA zone X (unshaded) · 0% chance over 30 yrs
- Wildfire 5/10 Major
- Heat 4/10 Moderate 7 d/yr ≥99°F today · 16 d/yr by 30 yrs out
- Wind 2/10 Low 100% chance of damaging wind over 30 yrs
- Air quality 2/10 Low 0 unhealthy d/yr today · 1 by 30 yrs out
Nearby sold comps map
Loading sold comps map…
Walkable amenities ~0.75 mi
Loading nearby amenities…
Taxation est. · year 1
- Rental income
- $20,590
- − Mortgage interest
- −$11,203
- − Property taxes
- −$818
- − Insurance
- −$1,000
- − Repairs & maintenance
- −$1,647
- − Management
- −$1,647
- − HOA
- −$456
- − Depreciation
- −$5,818
- Taxable loss
- −$1,999
- Est. tax savings @ 24.0%
- +$480
- After-tax cash flow
- $1,887/yr
For passive investors: Depreciation is non-cash, so a rental often shows a tax loss while cash-flowing — sheltering income. Rental losses are passive: they offset passive income freely, and up to $25,000/yr can offset ordinary (W-2) income if you actively participate and your MAGI is under $100k (phasing out to $0 by $150k); unused losses carry forward. On sale, claimed depreciation is recaptured at up to 25%, and gains may owe capital-gains tax (a 1031 exchange can defer both). Figures are a year-1 estimate at your 24.0% rate — not tax advice; consult a CPA.
Schools (NCES district)
- District
- Berkeley County Schools
- NCES district ID
- 5400060
- Math proficiency
- 21% ▼ -12.00%
- Reading proficiency
- 38% ▼ -6.00%
- Median HH income
- $54,599
- Composite
- 26.16/100
- National rank
- #7273
- State rank
- #24 of 55 in WV
Livability — Inwood
- Score
- 64/100
- State rank
- #143
- US rank
- #14358
Category grades
Schools grade is shown separately in the Schools card above.
Census & demographics
- Population (ZIP)
- 5,086
Population outlook (Berkeley County) Hauer SSP2
- Today (2025)
- 127,359 people
- By 2030
- 134,684 · +5.8%
- By 2040
- 148,219 · +16.4%
- By 2050
- 159,300 · +25.1%
- By 2075
- 179,920 · +41.3%
- By 2100
- 183,896 · +44.4%
Race, ethnicity, and origin ACS 2023
- Neighborhood character
- Predominantly White (91%)
- Race & ethnicity
- White 91% Two or more races 8% Hispanic / Latino 2%
- Common ancestry
- Slovak 5% Serbian 5% Lithuanian 3%
- Foreign-born
- 1%
Political lean MEDSL · Berkeley
- 2024 margin
- Solid R (+35.8) · D 31.2% · R 67.0% · Other 1.8%
- 2008→2024 swing
- -22.8pp toward R · 2008: -13.0pp · 2024: -35.8pp
- All cycles
- 2024: R+35.8 2020: R+31.2 2016: R+37.2 2012: R+21.3 2008: R+13.0
Not yet ingested
- Civics
- —
Market trends
- HPI YoY
- ▲ 3.13%
- Current HPI
- 224.7069
- Rent YoY
- —
- Metro
- —
- State GDP YoY
- —
- F500 in state
- 0
Price history
+212.1% since first listed9 events — show timeline
- 2026-06-01 Listed $200,000 BRIGHT MLS
- 2009-02-25 Delisted — MRIS
- 2008-07-28 Price Changed — MRIS
- 2008-07-28 Relisted — MRIS
- 2008-07-11 Delisted — MRIS
- 2007-12-10 Listed — MRIS
- 2003-07-25 Sold (Public Records) $64,090 Public Records
- 2003-01-13 Delisted — MRIS
- 2002-08-17 Listed — MRIS
Property tax history
-1.3%/yrLatest (2025): $818 · +0.2% YoY. Source: county tax records.
Cash-flow waterfall
monthlySold comps — $/sqft
last 12 mo · ≤1 miLoading sold comps…