 Multi-family
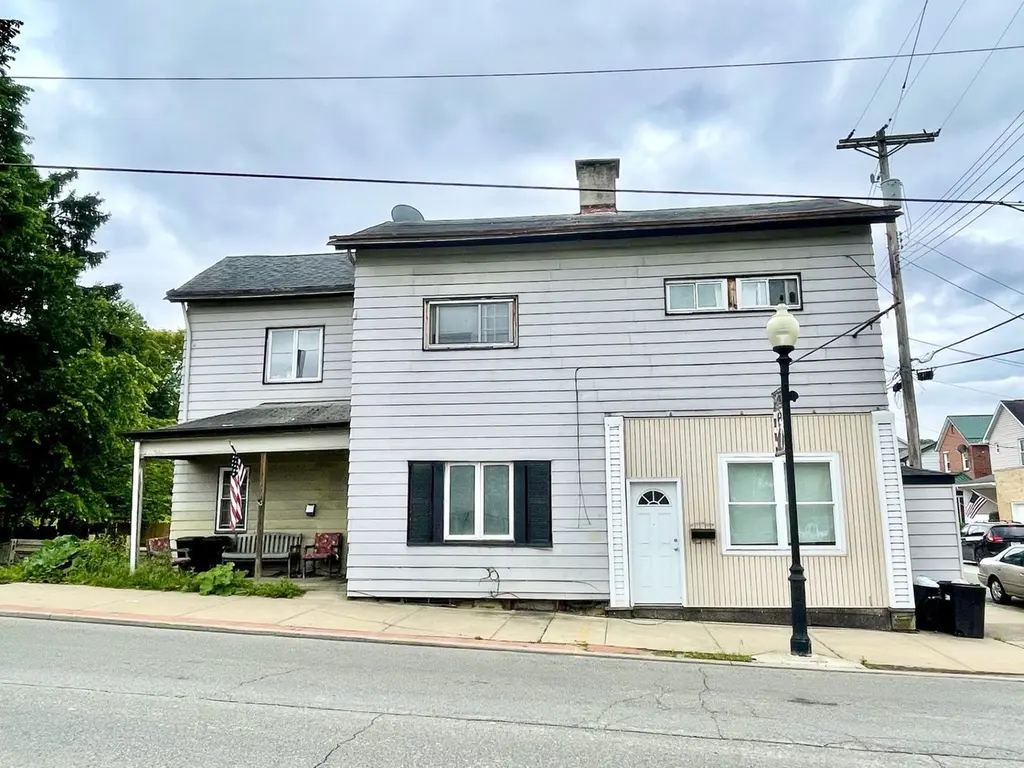
301 1st Ave · Carnegie, PA
Flood risk No data
- FEMA flood zone
- —
- Chance of flooding over 30 yrs
- —
- Est. flood insurance / yr
- —
Fire risk No data
- Est. fire insurance / yr
- —
Heat risk No data
- Hot days now (above threshold)
- —
- Hot days in 30 yrs
- —
Wind risk No data
- Chance of severe wind over 30 yrs
- —
Air-quality risk No data
- Unhealthy air days now
- —
- Unhealthy air days in 30 yrs
- —
Risk factors via First Street. Map © Google.
Why this score? — see what drove the B grade
The composite is a weighted blend of 9 inputs, each scored 0–100. Each bar is that input's sub-score; the figure is the points it added to the 100-point composite (weight × sub-score).
- Cash flow +30.0/30.0
- 1% rule +10.0/10.0
- DSCR +10.0/10.0
- ARV discount +7.5/15.0
- Livability +4.3/5.0
- Rent growth +3.9/5.0
- Schools +3.4/10.0
- Condition / age +2.5/5.0
- Appreciation +0.0/10.0
$240,000
🖨 Deal sheet 📄 Offer letter ✓ Due diligence
Multi-family units
County records classify this as Multi-Family (2-4 Unit). Listing-text estimate: 1 unit. estimate disagrees with records
Listing remarks MLS
Great opportunity in Carnegie! Three unit property all with tenants! Repairs to soffit, gutters, siding and roof done in March of 2024. Unit 15 3rd Unit B - 2 bed / 1 bath, Unit 301 1st St - 3 bed (all captive) / 1 bath, Unit 15 3rd Unit A - 1 bed / 1 bath. Great location close to local shopping and dining. Easy access to I-376, quick commute to downtown, Robinson Town Centre, and Airport! Cap Rate 9.87%
Key facts
- Updated units
- Stable occupancy
- Convenient location
Tags
Property features AI
Finance
- HOA & community: Public transportation nearby
Exterior
- Utilities: Electricity available; Natural gas available; Public water available; Public sewer available
- Home design: Multifamily building with three units
- Construction: Asphalt roof
- Exterior features: Commercially zoned lot
Interior
- Bedrooms: One-bedroom unit; Two-bedroom unit; Three-bedroom unit
- Bathrooms: One full bathroom in the one-bedroom unit; One full bathroom in the two-bedroom unit; One full bathroom in the three-bedroom unit
- Interior features: Basement
Neighborhood map
What this means for you Summary
Snapshot
- This is a 6-bed/3.0-bath multifamily listed at $240k.
Deal economics
- At list price, monthly cash flow is $1k ($17k/yr) — positive.
- The deal already cash-flows at list — no discount required.
- Meets the 1% rule at list price ($4k rent vs $240k).
- Recommended offer: $236k (1.5% below list) — sets the bar for market timing.
- Cap rate 13.5% vs local median 5.1% in Carnegie — top-decile yield for the area; either an underpriced asset or a hidden risk that comps aren't pricing in. Stress-test before assuming the spread holds.
Location & tenants
- Location reads 86/100 on livability (#55 in PA, #344 nationally) — a professional / high-income tenant draw. Strengths: crime A+, commute A+, cost of living A+; Watch: amenities D.
- Carlynton SD (suburban): math 29% / reading 52% proficiency, ranked #352 of 539 in PA (top 65%) — families likely to look elsewhere, expect single-tenant / working-renter base with shorter leases.
- Market conditions: Rents rising fast (+5.5%/yr); 67 active listings in the ZIP; solid renter incomes; 2,996 units permitted in Allegheny County in 2024 (1,588 in 5+ unit buildings).
- At $3,923/mo this rent would consume 61% of the median local household income ($77k/yr) (locally 410% of renters already pay >50% of income on rent) — very limited rent-growth headroom before tenants either downsize or default.
Forward outlook
- Local home prices are declining (-3.0%/yr); year-one equity from $2k of loan paydown is wiped out by about $7k of value loss. Plan a longer hold.
- At projected returns (-3.0% appreciation + 5.5% rent growth), your $67k cash investment doubles in ~5 years — after that, you're playing with house money.
Negotiation context
- It's been on market 18 days — a 2% lower offer ($236k) is reasonable based on typical stale-listing flexibility.
- 5 sale attempts since 13y ago with the ask held roughly flat each time — persistent listings suggest the price (not the market) is what's stuck; bring a comps-based counter.
- Current owner paid $175k; 37% above their basis — modest negotiation headroom, anchor on the comps not their cost.
Questions for the listing agent
- Is there a deadline driving the sale (1031 exchange, divorce, estate, relocation)? That informs how much negotiation room exists.
- What's the average days-on-market for RENTAL listings here right now (not sales)? A rising rental-DOM trend means longer vacancies and softer asking-rent achievability than the comps imply.
- What's the recent tenant-quality profile in this submarket — average credit score on applications, eviction rate, late-payment / NSF rate, and stable-employment percentage? A property-management company in the area should have these aggregated.
- How much new apartment / multifamily construction is in the pipeline within 1–3 miles? Heavy new supply (>2% of stock underway) typically softens rents 12–24 months out; light construction supports rent growth.
Investment metrics
- 1% rule
- 1.63% ✓
- Cap rate
- 13.50%
- Cash-on-cash
- 25.72%
- DSCR
- 2.14
- GRM
- 5.1
CMA / ARV
No comps found within radius.
Show comp detail 10 sales within ~0.75 mi
| Address | Dist | Beds/Ba | Sqft | Sold | Price | $/sf | Match |
|---|---|---|---|---|---|---|---|
| 301 1st Ave | 0.00mi | 6/3.0 | — | 7mo | $175,000 | — | 82 |
| 306 5th Ave | 0.30mi | 5/3.0 (-1) | — | 7mo | $300,000 | — | 63 |
| 613-615 W Main St | 0.30mi | 7/3.0 (+1) | — | 8mo | $320,000 | — | 62 |
| 500-502 Cubbage St | 0.35mi | 6/4.0 | — | 11mo | $275,000 | — | 58 |
| 100-102 Lee St | 0.22mi | 5/2.0 (-1) | — | 14mo | $222,000 | — | 57 |
| 618 Beechwood Ave | 0.21mi | 5/2.0 (-1) | — | 18mo | $237,000 | — | 54 |
| 111 Ramsey Ave | 0.51mi | 5/3.0 (-1) | — | 7mo | $268,500 | — | 53 |
| 351 & 353 Academy St | 0.58mi | 6/2.0 | — | 15mo | $200,000 | — | 44 |
| 893 Chartiers Ave | 0.59mi | 6/2.0 | — | 15mo | $37,500 | — | 44 |
| 401 Franklin Ave | 0.43mi | 5/7.0 (-1) | — | 15mo | $549,000 | — | 35 |
Match score weights: distance 35% · size 25% · config 20% · recency 20%. Top-matched comps best support the ARV.
Projected returns pro-forma
-3.0% appreciation · 5.45% rent growth · sell at horizon
- IRR
- 22.1%
- Equity multiple
- 1.93×
- Total profit
- $62,827
- Equity at exit
- $35,785
- IRR
- 31.7%
- Equity multiple
- 4.21×
- Total profit
- $215,841
- Equity at exit
- $20,751
Cash invested: $67,200 (down + closing). Projections, not guarantees.
Landlord ↔ Tenant lean methodology
- Overall (STATE)
- 62 Landlord-Friendly
- State Pennsylvania
- 62 Landlord-Friendly · EVEN
- County
- — inherits STATE
- City
- — inherits STATE
ZIP-level market 15106
- Home prices YoY
- -31.9%
- Rents YoY
- 5.5%
- Active inventory
- 67
- Price-to-rent
- 16.1×
Monthly cashflow live
- Estimated rent
- $3,923 high interval (Pro) →
- Mortgage (P&I)
- −$1,259
- Tax est. 1.5%
- −$300 /mo · $3,600/yr
- Insurance
- −$100
- HOA
- −$0
- Vacancy / Maint / Mgmt
- −$824
- Net cashflow
- $1,441
Break-even live
3-unit breakdown (identical units grouped — click to expand)
| Units | Beds | Baths | Est. rent |
|---|---|---|---|
| 1× unit | 2 | 1 | $1,244 |
| 1× unit | 3 | 1 | $1,562 |
| 1× unit | 1 | 1 | $1,117 |
| Total (3 units) | $3,923 | ||
UW: 25.0% down · 7.5% · 30yr · 1.5% tax · 5.0% vac · 8.0% maint · 8.0% mgmt
Financing live
Cash to close
- Down payment
- $60,000
- Closing costs
- $7,200
- Reserves months
- —
- Total cash needed
- —
Loan-product check · same deal, 3 products live
Conventional
25% down · 7.5% · 30yr
- Down + closing
- —
- Monthly P&I
- —
- Monthly cashflow
- —
- DSCR
- —
- Eligible?
- —
Personal DTI + credit; lowest rate.
DSCR
20% down · 8.5% · 30yr
- Down + closing
- —
- Monthly P&I
- —
- Monthly cashflow
- —
- DSCR
- —
- Eligible?
- —
No personal income docs; deal must DSCR.
Hard money
10% down · 12.0% · 12mo
- Down + closing
- —
- Monthly P&I
- —
- Monthly cashflow
- —
- DSCR
- —
- Eligible?
- —
Short-term bridge; refi at stabilization.
Listing history 13 events
-
2026-06-18days on market $240,000 Active 18 DOM
-
2026-06-17days on market $240,000 Active 17 DOM
-
2026-06-16days on market $240,000 Active 16 DOM
-
2026-06-15days on market $240,000 Active 15 DOM
-
2026-06-13days on market $240,000 Active 13 DOM
-
2026-06-09days on market $240,000 Active 9 DOM
-
2026-06-08days on market $240,000 Active 8 DOM
-
2026-06-07days on market $240,000 Active 7 DOM
-
2026-06-05days on market $240,000 Active 4 DOM
-
2026-06-03days on market $240,000 Active 3 DOM
-
2026-06-02days on market $240,000 Active 2 DOM
-
2026-06-01remarks 699-char remark
-
2026-06-01$240,000 Active 1 DOM
ⓘ Source: listings_history table (triggers on properties + properties_extension) + one-shot
backfill from property_details.listing_events for pre-trigger history.
Nearby sold comps map
Loading sold comps map…
Walkable amenities ~0.75 mi
Loading nearby amenities…
Taxation est. · year 1
- Rental income
- $47,076
- − Mortgage interest
- −$13,444
- − Property taxes
- −$3,600
- − Insurance
- −$1,200
- − Repairs & maintenance
- −$3,766
- − Management
- −$3,766
- − Depreciation
- −$6,982
- Taxable income
- $14,318
- Est. tax owed @ 24.0%
- −$3,436
- After-tax cash flow
- $13,851/yr
For passive investors: Depreciation is non-cash, so a rental often shows a tax loss while cash-flowing — sheltering income. Rental losses are passive: they offset passive income freely, and up to $25,000/yr can offset ordinary (W-2) income if you actively participate and your MAGI is under $100k (phasing out to $0 by $150k); unused losses carry forward. On sale, claimed depreciation is recaptured at up to 25%, and gains may owe capital-gains tax (a 1031 exchange can defer both). Figures are a year-1 estimate at your 24.0% rate — not tax advice; consult a CPA.
Schools (NCES district)
- District
- Carlynton SD
- NCES district ID
- 4205040
- Math proficiency
- 29% ▼ -15.00%
- Reading proficiency
- 52% ▼ -11.00%
- Median HH income
- $46,249
- Composite
- 34.46/100
- National rank
- #5192
- State rank
- #352 of 539 in PA
Livability — Carnegie
- Score
- 86/100
- State rank
- #55
- US rank
- #344
Category grades
Schools grade is shown separately in the Schools card above.
Census & demographics
- Census place
- Carnegie, PA
- County
- Allegheny County · 1,022,028 people
- City population
- 19,244
- Metro
- Pittsburgh, PA
- Population (ZIP)
- 19,244
- Household income
- $77,247
- Rent vs Own
- Severe rent burden
- 410.0
Population outlook (Allegheny County) Hauer SSP2
- Today (2025)
- 1,250,282 people
- By 2030
- 1,256,482 · +0.5%
- By 2040
- 1,256,318 · +0.5%
- By 2050
- 1,244,169 · -0.5%
- By 2075
- 1,197,693 · -4.2%
- By 2100
- 1,093,187 · -12.6%
Race, ethnicity, and origin ACS 2023
- Neighborhood character
- Predominantly White (82%)
- Race & ethnicity
- White 82% Black 8% Two or more races 6% Asian 2% Hispanic / Latino 2%
- Common ancestry
- Romanian 11% Lithuanian 2% Subsaharan African 2%
- Foreign-born
- 5%
- Languages at home
- 94% English-only · Other Indo-European 2% Arabic 1% Russian/Polish/Slavic 1%
Political lean MEDSL · Allegheny
- 2024 margin
- Strong D (+20.3) · D 59.7% · R 39.4%
- 2008→2024 swing
- +4.8pp toward D · 2008: 15.5pp · 2024: 20.3pp
- All cycles
- 2024: D+20.3 2020: D+20.4 2016: D+16.4 2012: D+14.4 2008: D+15.5
Not yet ingested
- Civics
- —
Market trends
- HPI YoY
- ▼ -119.52%
- Current HPI
- 255.0295
- Rent YoY
- ▲ 5.45%
- Metro
- Pittsburgh, PA
- State GDP YoY
- ▲ 1.68%
- F500 in state
- 34
Industry mix (Fortune 500 HQ in PA)
| Industry | F500 HQs | Revenue |
|---|---|---|
| Healthcare | 2 | $309B |
|
||
| Insurance | 2 | $27B |
|
||
| Telecommunications / Media | 1 | $124B |
|
||
| Industrial Distribution | 1 | $22B |
|
||
| Financial Services | 1 | $20B |
|
||
| Chemicals / Materials | 1 | $18B |
|
||
Price history
+118.4% since first listed14 events — show timeline
- 2026-05-29 Listed $240,000 West Penn MLS
- 2025-11-25 Sold (MLS) $175,000 West Penn MLS
- 2025-11-10 Pending — West Penn MLS
- 2025-09-22 Contingent — West Penn MLS
- 2025-05-01 Rental Removed $1,100 RENT.
- 2025-04-13 Listed for Rent $1,100 RENT.
- 2025-02-19 Price Changed $225,000 West Penn MLS
- 2025-02-19 Price Changed $225,000 West Penn MLS
- 2024-12-20 Listed $235,000 West Penn MLS
- 2024-12-18 Listed $235,000 West Penn MLS
- 2014-01-15 Price Changed $88,500 West Penn MLS
- 2014-01-14 Sold (MLS) $88,500 West Penn MLS
- 2014-01-14 Price Changed $109,900 West Penn MLS
- 2013-05-16 Listed $109,900 West Penn MLS
Cash-flow waterfall
monthlySold comps — $/sqft
last 12 mo · ≤1 miLoading sold comps…