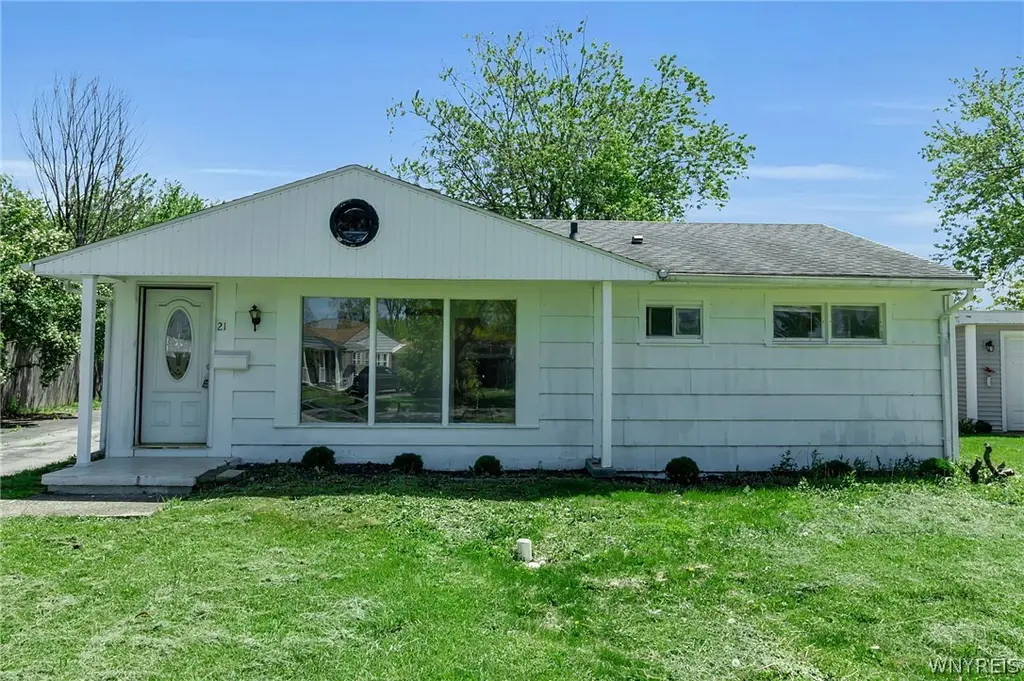
21 Mapleview Dr · Eggertsville, NY
Flood risk 1/10 · Minimal
- FEMA flood zone
- X (unshaded)
- Chance of flooding over 30 yrs
- 0.0%
- Est. flood insurance / yr
- $507 – $1,088
Fire risk 1/10 · Minimal
- Est. fire insurance / yr
- $691 – $1,283
Heat risk 3/10 · Minor
- Hot days now (above 92°F)
- 7 days/yr
- Hot days in 30 yrs
- 15 days/yr
Wind risk 1/10 · Minimal
- Chance of severe wind over 30 yrs
- —
Air-quality risk 3/10 · Minor
- Unhealthy air days now
- 2 days/yr
- Unhealthy air days in 30 yrs
- 3 days/yr
Risk factors via First Street. Map © Google.
Why this score? — see what drove the D+ grade
The composite is a weighted blend of 9 inputs, each scored 0–100. Each bar is that input's sub-score; the figure is the points it added to the 100-point composite (weight × sub-score).
- ARV discount +15.0/15.0
- Cash flow +9.4/30.0
- Schools +5.3/10.0
- Rent growth +4.8/5.0
- 1% rule +4.2/10.0
- Livability +4.2/5.0
- DSCR +2.7/10.0
- Condition / age +2.5/5.0
- Appreciation +0.0/10.0
$219,900
🖨 Deal sheet 📄 Offer letter ✓ Due diligence
Listing remarks MLS
THIS 3+ BDRM 2 BATH STORYBOOK RANCH IN THE TOWN OF AMHERST IS AN INCREDIBLE VALUE! SPACIOUS ROOMS, OPEN LIVING SPACE, 1ST FLOOR LAUNDRY AND VERSATILITY! THE LARGE BEDROOM IN BACK IS NEWLY RENOVATED, AS WELL AS THE FULL BATH; POSSIBLE IN-LAW SUITE THAT HAS ITS OWN EXTERIOR ACCESS. OTHER ROOM IS LAUNDRY ROOM * ALL APPLIANCES INCLUDED, NEW ROOF IN 2012, LARGE BACK DECK FOR ENTERTAINING. THIS GREAT HOME WILL NOT BE AVAILABLE FOR LONG!
Key facts
- Large deck
- Open floor plan
- Walk-in closet
Tags
Property features AI
Exterior
- Parking: Attached garage; Approximately 1.5 garage spaces
- Utilities: Public water connected; Sewer connected
- Home design: Single-story (1 story); Resale property; Shake siding
- Construction: Shake siding construction
- Exterior features: Blacktop driveway; Rectangular residential lot (approx. 50 x 168)
Interior
- Kitchen: Appliances negotiable; Gas water heater
- Bedrooms: Three bedrooms on the main level
- Flooring: Ceramic tile; Laminate; Varied flooring
- Bathrooms: Two full bathrooms on the main level
- Heating & cooling: Gas forced-air heating
- Interior features: Separate/formal dining room; Bedroom on main level; Main-level primary suite
- Laundry & utility: Crawl space
Neighborhood map
What this means for you Summary
Snapshot
- This is a 3-bed/2.0-bath single-family listed at $220k.
Deal economics
- At list price, monthly cash flow is $-155 ($-2k/yr) — negative.
- To cash-flow at today's rent, offer at most $192k (12.5% below list).
- To meet the 1% rule (rent ≥ 1% of price), the offer needs to be $203k (7.5% below list).
- Recommended offer: $192k (12.5% below list) — sets the bar for cash-flow.
Location & tenants
- Location reads 85/100 on livability (#34 in NY, #534 nationally) — a professional / high-income tenant draw. Strengths: commute A+, housing A+, health & safety A+; Watch: crime C-, amenities C-.
- Amherst Central School District (suburban): math 53% / reading 68% proficiency, ranked #209 of 590 in NY (top 35%) — acceptable for families but not a draw, mixed tenant base, ~2y average lease.
- Market conditions: Rents rising fast (+9.0%/yr); 143 active listings in the ZIP; 16 comparable units currently listed for rent nearby; rentals at typical pace (median 24d on market — plan ~3-4 weeks tenant-placement turnaround); solid renter incomes; 1,244 units permitted in Erie County in 2024 (563 in 5+ unit buildings).
Forward outlook
- Local home prices are declining (-3.0%/yr); year-one equity from $2k of loan paydown is wiped out by about $7k of value loss. Plan a longer hold.
Negotiation context
- It's been on market 20 days — a 2% lower offer ($217k) is reasonable based on typical stale-listing flexibility.
- 3 sale attempts since 15y ago with the ask held roughly flat each time — persistent listings suggest the price (not the market) is what's stuck; bring a comps-based counter.
- Current owner paid $122k; list at $220k implies a 80% gain — meaningful room to come down on a strong offer.
Risks & watch-outs
- Watch-outs: property tax is 2.8% of price; built in 1952 — expect roof / HVAC / electrical / plumbing capex.
Questions for the listing agent
- What do current leases actually rent for vs. the listed asking? Can we see a recent rent roll and the last 12 months of T-12 income?
- Built in 1952 — when were the roof, HVAC, electrical panel, plumbing, and water heater last replaced?
- Property tax is high relative to price — has the assessment been appealed recently, and will the sale trigger a re-assessment?
- Is there a deadline driving the sale (1031 exchange, divorce, estate, relocation)? That informs how much negotiation room exists.
- Schools are B-rated — typically a magnet for longer-tenancy family renters. What's the average tenant stay here, and is there a school-zone premium baked into asking?
- The area grade is low — what's the realistic commute time and amenity access for the typical tenant pool here? Any planned neighborhood developments (good or bad) we should know about?
- What's the average days-on-market for RENTAL listings here right now (not sales)? A rising rental-DOM trend means longer vacancies and softer asking-rent achievability than the comps imply.
- What's the recent tenant-quality profile in this submarket — average credit score on applications, eviction rate, late-payment / NSF rate, and stable-employment percentage? A property-management company in the area should have these aggregated.
- How much new for-sale + rental construction is in the pipeline within 1–3 miles? Heavy new supply typically softens prices + rents 12–24 months out; constrained supply supports both.
Investment metrics
- 1% rule
- 0.92% ✗
- Cap rate
- 5.45%
- Cash-on-cash
- -3.02%
- DSCR
- 0.87
- GRM
- 9.0
CMA / ARV
- ARV (on-the-fly)
- $313,272
- Comps found
- 12
Show comp detail 12 sales within ~0.75 mi
| Address | Dist | Beds/Ba | Sqft | Sold | Price | $/sf | Match |
|---|---|---|---|---|---|---|---|
| 329 Springville Ave | 0.08mi | 3/2.0 | 1,306 (-5%) | 0mo | $322,040 | $247 | 88 |
| 12 Delta Rd | 0.37mi | 3/1.5 | 1,374 (0%) | 4mo | $260,000 | $189 | 78 |
| 62 Conant Dr | 0.55mi | 3/1.5 | 1,404 (+2%) | 1mo | $215,000 | $153 | 68 |
| 130 Stevenson Blvd | 0.30mi | 3/1.5 | 1,232 (-10%) | 1mo | $347,000 | $282 | 66 |
| 1436 Eggert Rd | 0.66mi | 3/1.5 | 1,380 (+0%) | 2mo | $265,000 | $192 | 65 |
| 133 Allenhurst Rd | 0.61mi | 3/1.5 | 1,410 (+3%) | 1mo | $332,800 | $236 | 65 |
| 511 Capen Blvd | 0.25mi | 4/1.0 (+1) | 1,260 (-8%) | 1mo | $260,504 | $207 | 64 |
| 50 Fairchild Dr | 0.59mi | 4/1.5 (+1) | 1,398 (+2%) | 3mo | $340,000 | $243 | 60 |
| 1789 Eggert Rd | 0.71mi | 3/1.0 | 1,368 (-0%) | 4mo | $235,000 | $172 | 59 |
| 1425 Eggert Rd | 0.69mi | 3/1.0 | 1,196 (-13%) | 0mo | $165,000 | $138 | 42 |
| 206 Lamont Dr | 0.55mi | 4/1.5 (+1) | 1,188 (-14%) | 4mo | $300,000 | $253 | 42 |
| 204 Lyndale Ave | 0.56mi | 4/1.0 (+1) | 1,176 (-14%) | 1mo | $268,204 | $228 | 40 |
Match score weights: distance 35% · size 25% · config 20% · recency 20%. Top-matched comps best support the ARV.
Projected returns pro-forma
-3.0% appreciation · 8.0% rent growth · sell at horizon
- IRR
- -14.9%
- Equity multiple
- 0.44×
- Total profit
- $-34,587
- Equity at exit
- $32,788
- IRR
- 1.3%
- Equity multiple
- 1.11×
- Total profit
- $6,799
- Equity at exit
- $19,013
Cash invested: $61,572 (down + closing). Projections, not guarantees.
Landlord ↔ Tenant lean methodology
- Overall (STATE)
- 15 Strongly Tenant-Friendly
- State New York
- 15 Strongly Tenant-Friendly · D+10
- County
- — inherits STATE
- City
- — inherits STATE
ZIP-level market 14226
- Rents YoY
- 9.0%
- Active inventory
- 143
- Price-to-rent
- 9.0×
Monthly cashflow live
- Estimated rent
- $2,033 high interval (Pro) →
- Mortgage (P&I)
- −$1,153
- Tax from tax record
- −$517 /mo · $6,200/yr
- Insurance
- −$92
- HOA
- −$0
- Vacancy / Maint / Mgmt
- −$427
- Net cashflow
- $-155
Break-even live
UW: 25.0% down · 7.5% · 30yr · 1.5% tax · 5.0% vac · 8.0% maint · 8.0% mgmt
Financing live
Cash to close
- Down payment
- $54,975
- Closing costs
- $6,597
- Reserves months
- —
- Total cash needed
- —
Loan-product check · same deal, 3 products live
Conventional
25% down · 7.5% · 30yr
- Down + closing
- —
- Monthly P&I
- —
- Monthly cashflow
- —
- DSCR
- —
- Eligible?
- —
Personal DTI + credit; lowest rate.
DSCR
20% down · 8.5% · 30yr
- Down + closing
- —
- Monthly P&I
- —
- Monthly cashflow
- —
- DSCR
- —
- Eligible?
- —
No personal income docs; deal must DSCR.
Hard money
10% down · 12.0% · 12mo
- Down + closing
- —
- Monthly P&I
- —
- Monthly cashflow
- —
- DSCR
- —
- Eligible?
- —
Short-term bridge; refi at stabilization.
Rent comps 16 comps
| Address | Beds | Baths | Sqft | Rent | $/sqft | DOM | Units | Dist |
|---|---|---|---|---|---|---|---|---|
| 348 Capen Blvd Buffalo, NY | 3.0 | 1.5 | 1424 | $2,200 | $1.54 | 1d | 1 | 0.25mi |
| 91 Springville Ave Buffalo, NY | 4.0 | 2.0 | 1660 | $2,350 | $1.42 | 23d | 1 | 0.47mi |
| 524 University Ave Buffalo, NY | 3.0 | 1.0 | 1840 | $1,600 | $0.87 | 1d | 1 | 0.59mi |
| 60 Englewood Ave Buffalo, NY | 4.0 | 1.0 | 1400 | $1,650 | $1.18 | 1d | 1 | 1.08mi |
| 212 Dellwood Rd Buffalo, NY | 4.0 | 4.0 | 1209 | $3,400 | $2.81 | 1d | 2 | 1.09mi |
| 151 Lamson Rd Buffalo, NY | 4.0 | 2.0 | 1382 | $2,350 | $1.70 | 17d | 1 | 1.11mi |
| 33 Tillotson Pl Buffalo, NY | 3.0 | 1.0 | 1143 | $2,095 | $1.83 | 14d | 1 | 1.11mi |
| 4765 N Bailey Ave Buffalo, NY | 2.0 | 1.0 | 900 | $2,100 | $2.33 | 43d | 1 | 1.18mi |
| 182 Woodcrest Dr Amherst, NY | 3.0 | 1.5 | 1380 | $2,300 | $1.67 | 19d | 1 | 1.30mi |
| 26 Custer St Buffalo, NY | 2.0 | 1.0 | 1000 | $1,300 | $1.30 | 43d | 1 | 1.37mi |
| 627 Kenmore Ave Buffalo, NY | 2.0 | 1.0 | 1000 | $1,250 | $1.25 | 23d | 1 | 1.38mi |
| 222 Lisbon Ave Buffalo, NY | 4.0 | 1.0 | 1300 | $1,400 | $1.08 | 23d | 1 | 1.41mi |
| 222 Lisbon Ave Unit Upper Buffalo, NY | 3.0 | 1.0 | 1400 | $1,400 | $1.00 | 43d | 1 | 1.41mi |
| 40 Lisbon Ave Unit Upper Buffalo, NY | 2.0 | 1.0 | 1057 | $1,500 | $1.42 | 11d | 1 | 1.43mi |
| 79 Rosemont Dr Buffalo, NY | 2.0 | 1.0 | 1071 | $2,200 | $2.05 | 43d | 1 | 1.43mi |
| 265 Lisbon Ave Unit 2 Buffalo, NY | 3.0 | 1.0 | 1200 | $1,400 | $1.17 | 43d | 1 | 1.44mi |
Listing history 15 events
-
2026-06-18days on market $219,900 Active 20 DOM
-
2026-06-17days on market $219,900 Active 19 DOM
-
2026-06-16days on market $219,900 Active 18 DOM
-
2026-06-15days on market $219,900 Active 17 DOM
-
2026-06-13days on market $219,900 Active 15 DOM
-
2026-06-13days on market $219,900 Active 14 DOM
-
2026-06-10days on market $219,900 Active 12 DOM
-
2026-06-09days on market $219,900 Active 11 DOM
-
2026-06-08days on market $219,900 Active 10 DOM
-
2026-06-07days on market $219,900 Active 9 DOM
-
2026-06-05days on market $219,900 Active 6 DOM
-
2026-06-03days on market $219,900 Active 5 DOM
-
2026-06-02days on market $219,900 Active 4 DOM
-
2026-06-01days on market $219,900 Active 3 DOM
-
2026-05-31days on market $219,900 Active 2 DOM
ⓘ Source: listings_history table (triggers on properties + properties_extension) + one-shot
backfill from property_details.listing_events for pre-trigger history.
Tax reassessment forecast NY · Partial reset (capped growth)
- Current annual tax
- $6,200 · $517/mo
- Projected year-2 tax
- $6,200 · $517/mo
- Expected delta
- $0/yr ($0/mo · 0.0%)
ⓘ Screening estimate from a state-policy table — verify with the county assessor before closing.
Climate risk First Street
- Flood 1/10 Low FEMA zone X (unshaded) · 0% chance over 30 yrs
- Wildfire 1/10 Low
- Heat 3/10 Moderate 7 d/yr ≥92°F today · 15 d/yr by 30 yrs out
- Wind 1/10 Low
- Air quality 3/10 Moderate 2 unhealthy d/yr today · 3 by 30 yrs out
Nearby sold comps map
Loading sold comps map…
Walkable amenities ~0.75 mi
Loading nearby amenities…
Taxation est. · year 1
- Rental income
- $24,401
- − Mortgage interest
- −$12,318
- − Property taxes
- −$6,200
- − Insurance
- −$1,100
- − Repairs & maintenance
- −$1,952
- − Management
- −$1,952
- − Depreciation
- −$6,397
- Taxable loss
- −$5,518
- Est. tax savings @ 24.0%
- +$1,324
- After-tax cash flow
- $-537/yr
For passive investors: Depreciation is non-cash, so a rental often shows a tax loss while cash-flowing — sheltering income. Rental losses are passive: they offset passive income freely, and up to $25,000/yr can offset ordinary (W-2) income if you actively participate and your MAGI is under $100k (phasing out to $0 by $150k); unused losses carry forward. On sale, claimed depreciation is recaptured at up to 25%, and gains may owe capital-gains tax (a 1031 exchange can defer both). Figures are a year-1 estimate at your 24.0% rate — not tax advice; consult a CPA.
Schools (NCES district)
- District
- Amherst Central School District
- NCES district ID
- 3602920
- Math proficiency
- 53% ▼ -16.00%
- Reading proficiency
- 68% ▲ 4.00%
- Median HH income
- $68,551
- Composite
- 53.21/100
- National rank
- #1502
- State rank
- #209 of 590 in NY
Livability — Eggertsville
- Score
- 85/100
- State rank
- #34
- US rank
- #534
Category grades
Schools grade is shown separately in the Schools card above.
Census & demographics
- Census place
- Eggertsville, NY
- County
- Erie County · 714,559 people
- City population
- 29,482
- Metro
- Buffalo-Cheektowaga, NY
- Population (ZIP)
- 29,159
- Household income
- $84,325
- Rent vs Own
- Severe rent burden
- 856.0
Population outlook (Erie County) Hauer SSP2
- Today (2025)
- 933,037 people
- By 2030
- 935,181 · +0.2%
- By 2040
- 928,531 · -0.5%
- By 2050
- 905,725 · -2.9%
- By 2075
- 834,037 · -10.6%
- By 2100
- 708,033 · -24.1%
Race, ethnicity, and origin ACS 2023
- Neighborhood character
- Predominantly White (74%)
- Race & ethnicity
- White 74% Black 10% Asian 7% Two or more races 6% Hispanic / Latino 5%
- Common ancestry
- Romanian 7% Lithuanian 2% Slovak 1%
- Foreign-born
- 13% · Canada, China, India
- Languages at home
- 87% English-only · Other Indo-European 4% Spanish 2% Arabic 1%
Political lean MEDSL · Erie
- 2024 margin
- Lean D (+9.7) · D 54.8% · R 45.2%
- 2008→2024 swing
- -7.9pp toward R · 2008: 17.5pp · 2024: 9.7pp
- All cycles
- 2024: D+9.7 2020: D+14.7 2016: D+4.8 2012: D+15.6 2008: D+17.5
Not yet ingested
- Civics
- —
Market trends
- HPI YoY
- ▼ -270.71%
- Current HPI
- 331.1929
- Rent YoY
- ▲ 9.01%
- Metro
- Buffalo-Cheektowaga, NY
- State GDP YoY
- ▲ 2.60%
- F500 in state
- 92
Industry mix (Fortune 500 HQ in NY)
| Industry | F500 HQs | Revenue |
|---|---|---|
| Financial Services | 10 | $950B |
|
||
| Consumer Goods | 9 | $162B |
|
||
| Insurance | 4 | $225B |
|
||
| Telecommunications | 2 | $144B |
|
||
| Pharmaceuticals | 2 | $112B |
|
||
| Media / Entertainment | 2 | $69B |
|
||
Price history
+213.7% since first listed9 events — show timeline
- 2026-05-29 Listed $219,900 WNYREIS
- 2015-10-08 Sold (Public Records) $122,000 Public Records
- 2015-10-07 Sold (MLS) $122,000 WNYREIS
- 2015-09-01 Pending — WNYREIS
- 2015-07-20 Listed $124,900 WNYREIS
- 2012-05-09 Sold (Public Records) $98,580 Public Records
- 2012-05-09 Sold (MLS) $98,580 WNYREIS
- 2011-09-26 Listed $100,000 WNYREIS
- 2004-10-29 Sold (Public Records) $70,103 Public Records
Property tax history
+6.1%/yrLatest (2025): $6,200 · +9.1% YoY. Source: county tax records.
Cash-flow waterfall
monthlySold comps — $/sqft
last 12 mo · ≤1 miLoading sold comps…