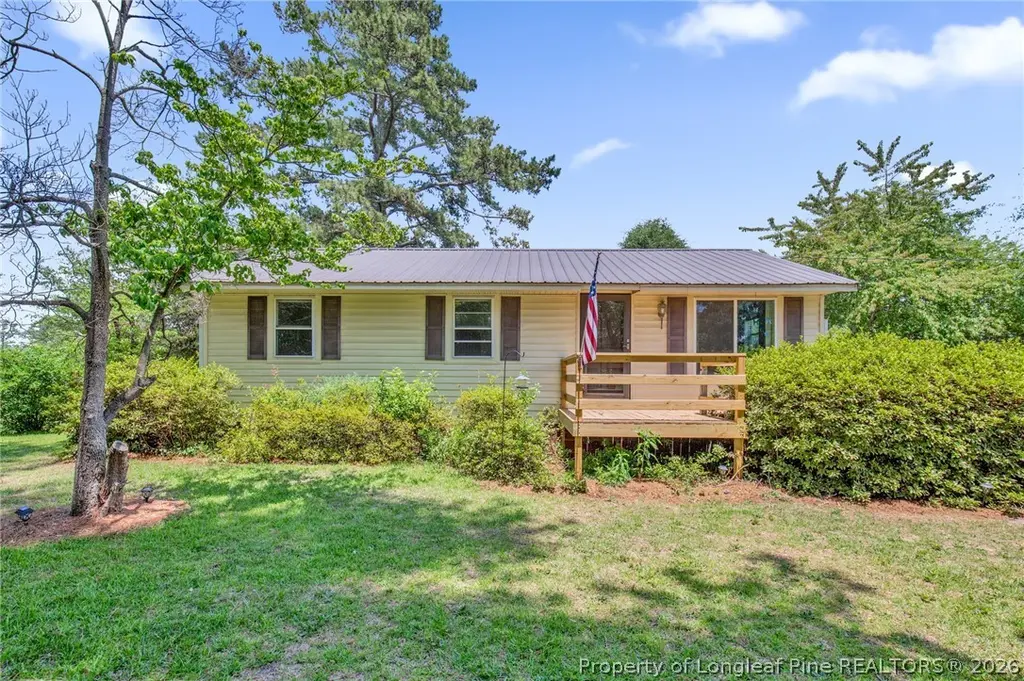
219 E Clinton St · Autryville, NC
Flood risk 1/10 · Minimal
- FEMA flood zone
- X (unshaded)
- Chance of flooding over 30 yrs
- 0.0%
- Est. flood insurance / yr
- $507 – $1,088
Fire risk 6/10 · Moderate
- Est. fire insurance / yr
- $906 – $1,684
Heat risk 8/10 · Major
- Hot days now (above 106°F)
- 7 days/yr
- Hot days in 30 yrs
- 17 days/yr
Wind risk 8/10 · Major
- Chance of severe wind over 30 yrs
- 80.0%
Air-quality risk 1/10 · Minimal
- Unhealthy air days now
- 0 days/yr
- Unhealthy air days in 30 yrs
- 0 days/yr
Risk factors via First Street. Map © Google.
Why this score? — see what drove the C- grade
The composite is a weighted blend of 9 inputs, each scored 0–100. Each bar is that input's sub-score; the figure is the points it added to the 100-point composite (weight × sub-score).
- Cash flow +18.3/30.0
- ARV discount +7.5/15.0
- Appreciation +6.1/10.0
- DSCR +5.8/10.0
- 1% rule +3.6/10.0
- Schools +3.4/10.0
- Livability +2.9/5.0
- Rent growth +2.5/5.0
- Condition / age +2.5/5.0
$185,000
🖨 Deal sheet 📄 Offer letter ✓ Due diligence
Listing remarks
Small town charm meets peaceful country living! This adorable 2 bed, 2 full bath home is full of character and sits on approximately . 73 acres with plenty of room to enjoy the outdoors. Inside, you’ll find hardwood and laminate flooring throughout, a spacious kitchen featuring tile countertops, abundant cabinet space, and a cozy eat in dining area. Both bathrooms offer their own unique style, one featuring a beautiful stand-alone soaking tub and the other a tile shower with convenient linen storage in each. Enjoy your morning coffee on the front deck or unwind in the evenings on the back deck overlooking the property. Outside, this property offers even more flexibility with a d
Key facts
- Hardwood flooring
- Laminate flooring
- Tile countertops
Tags
Property features AI
Exterior
- Parking: Detached carport; 1 covered parking space; 1 carport space
- Utilities: Public water; Holding tank and septic sewer
- Home design: Single family residence; Residential zoning
- Construction: Vinyl siding; Crawl space foundation
- Exterior features: Deck; Storm door(s)
Interior
- Kitchen: Microwave; Range
- Bedrooms: Total rooms: 5
- Flooring: Hardwood flooring; Laminate flooring
- Bathrooms: 2 full bathrooms
- Heating & cooling: Heat pump heating; Central electric air conditioning; Ceiling fans
- Interior features: Ceiling fans; Eat-in kitchen; Storage
Neighborhood map
What this means for you Summary
Snapshot
- This is a 2-bed/1.0-bath manufactured listed at $185k.
Deal economics
- At list price, monthly cash flow is $171 ($2k/yr) — positive.
- The deal already cash-flows at list — no discount required.
- To meet the 1% rule (rent ≥ 1% of price), the offer needs to be $160k (13.5% below list).
- Recommended offer: $160k (13.5% below list) — sets the bar for 1% rule.
Location & tenants
- Location reads 57/100 on livability (#592 in NC) — a working-class tenant base; expect higher turnover. Strengths: cost of living A+, housing B; Watch: crime F, amenities F, commute F.
- Sampson County Schools (rural): math 40% / reading 41% proficiency, ranked #114 of 178 in NC (top 64%) — families likely to look elsewhere, expect single-tenant / working-renter base with shorter leases; 74% free/reduced lunch — lower-income household profile, screen leases tightly.
- Zoned schools: Roseboro-Salemburg Middle (math 24% / reading 32%, grade F, #360 of 475 statewide, top 77%, 406 students, 99% FRL); Lakewood High (math 72% / reading 42%, grade C, #248 of 535 statewide, top 48%, 479 students, 99% FRL) — zoned schools average 99% FRL vs 74% district-wide (26 pts higher); higher-poverty schools than district average — tighter screening recommended.
- Market conditions: 43 active listings in the ZIP; 1 comparable units currently listed for rent nearby; 189 units permitted in Sampson County in 2024 (0 in 5+ unit buildings).
Forward outlook
- In year one you build about $5k of equity ($1k loan paydown + $4k appreciation (2.2% local appreciation)).
- Sampson County population projected to shrink 5% by 2050 — rents likely to lag national; underwrite the cash flow, not the appreciation.
- At projected returns (2.2% appreciation + 3.0% rent growth), your $52k cash investment doubles in ~6 years — after that, you're playing with house money.
- By year 7, paydown + projected appreciation supports a ~$34k cash-out refi (75% LTV) — recoverable capital for the next deal without selling this one.
Negotiation context
- It's been on market 15 days — a 2% lower offer ($182k) is reasonable based on typical stale-listing flexibility.
- 2 sale attempts with the ask held roughly flat each time — persistent listings suggest the price (not the market) is what's stuck; bring a comps-based counter.
- Current owner paid $30k; list at $185k implies a 517% gain — meaningful room to come down on a strong offer.
Risks & watch-outs
- Climate carrying-cost: severe wind risk, 80% chance of damaging wind over 30y; major wildfire risk; extreme-heat days projected 7→17/yr by 2055 (HVAC capex compounding) — expect insurance premiums to compound above CPI over the hold.
Questions for the listing agent
- Built in 1969 — when were the roof, HVAC, electrical panel, plumbing, and water heater last replaced?
- Is there a deadline driving the sale (1031 exchange, divorce, estate, relocation)? That informs how much negotiation room exists.
- Crime grade is F in this area — have there been break-ins, vandalism, or insurance claims at this property in the last 3 years? What carrier currently insures it and at what premium?
- What's the average days-on-market for RENTAL listings here right now (not sales)? A rising rental-DOM trend means longer vacancies and softer asking-rent achievability than the comps imply.
- What's the recent tenant-quality profile in this submarket — average credit score on applications, eviction rate, late-payment / NSF rate, and stable-employment percentage? A property-management company in the area should have these aggregated.
- How much new for-sale + rental construction is in the pipeline within 1–3 miles? Heavy new supply typically softens prices + rents 12–24 months out; constrained supply supports both.
Investment metrics
- 1% rule
- 0.86% ✗
- Cap rate
- 7.40%
- Cash-on-cash
- 3.96%
- DSCR
- 1.18
- GRM
- 9.6
CMA / ARV
No comps found within radius.
Projected returns pro-forma
2.21% appreciation · 3.0% rent growth · sell at horizon
- IRR
- 9.0%
- Equity multiple
- 1.49×
- Total profit
- $25,441
- Equity at exit
- $75,061
- IRR
- 11.9%
- Equity multiple
- 2.64×
- Total profit
- $85,039
- Equity at exit
- $109,720
Cash invested: $51,800 (down + closing). Projections, not guarantees.
Landlord ↔ Tenant lean methodology
- Overall (STATE)
- 85 Strongly Landlord-Friendly
- State North Carolina
- 85 Strongly Landlord-Friendly · R+3
- County
- — inherits STATE
- City
- — inherits STATE
ZIP-level market 28318
- Home prices YoY
- 0.8%
- Active inventory
- 43
- Price-to-rent
- 9.6×
Monthly cashflow live
- Estimated rent
- $1,600 medium interval (Pro) →
- Mortgage (P&I)
- −$970
- Tax from tax record
- −$46 /mo · $551/yr
- Insurance
- −$77
- HOA
- −$0
- Vacancy / Maint / Mgmt
- −$336
- Net cashflow
- $171
Break-even live
UW: 25.0% down · 7.5% · 30yr · 1.5% tax · 5.0% vac · 8.0% maint · 8.0% mgmt
Financing live
Cash to close
- Down payment
- $46,250
- Closing costs
- $5,550
- Reserves months
- —
- Total cash needed
- —
Loan-product check · same deal, 3 products live
Conventional
25% down · 7.5% · 30yr
- Down + closing
- —
- Monthly P&I
- —
- Monthly cashflow
- —
- DSCR
- —
- Eligible?
- —
Personal DTI + credit; lowest rate.
DSCR
20% down · 8.5% · 30yr
- Down + closing
- —
- Monthly P&I
- —
- Monthly cashflow
- —
- DSCR
- —
- Eligible?
- —
No personal income docs; deal must DSCR.
Hard money
10% down · 12.0% · 12mo
- Down + closing
- —
- Monthly P&I
- —
- Monthly cashflow
- —
- DSCR
- —
- Eligible?
- —
Short-term bridge; refi at stabilization.
Rent comps 1 comps
| Address | Beds | Baths | Sqft | Rent | $/sqft | DOM | Units | Dist |
|---|---|---|---|---|---|---|---|---|
| 48 Fox Run Ln Unit 2 Autryville, NC | 2.0 | 2.0 | 925 | $1,600 | $1.73 | 14d | 1 | 0.60mi |
Listing history 13 events
-
2026-06-18days on market $185,000 Active 15 DOM
-
2026-06-17price $185,000 Active 14 DOM
-
2026-06-17days on market $190,000 Active 14 DOM
-
2026-06-16days on market $190,000 Active 13 DOM
-
2026-06-15days on market $190,000 Active 12 DOM
-
2026-06-14days on market $190,000 Active 10 DOM
-
2026-06-13days on market $190,000 Active 9 DOM
-
2026-06-10days on market $190,000 Active 7 DOM
-
2026-06-09days on market $190,000 Active 6 DOM
-
2026-06-08days on market $190,000 Active 5 DOM
-
2026-06-07days on market $190,000 Active 4 DOM
-
2026-06-03remarks 693-char remark
-
2026-06-03$190,000 Active 1 DOM
ⓘ Source: listings_history table (triggers on properties + properties_extension) + one-shot
backfill from property_details.listing_events for pre-trigger history.
Tax reassessment forecast NC · Resets to sale price
- Current annual tax
- $551 · $46/mo
- Projected year-2 tax
- $1,517 · $126/mo
- Expected delta
- +$966/yr (+$80/mo · 175.3%)
ⓘ Screening estimate from a state-policy table — verify with the county assessor before closing.
Climate risk First Street
- Flood 1/10 Low FEMA zone X (unshaded) · 0% chance over 30 yrs
- Wildfire 6/10 Major
- Heat 8/10 Severe 7 d/yr ≥106°F today · 17 d/yr by 30 yrs out
- Wind 8/10 Severe 80% chance of damaging wind over 30 yrs
- Air quality 1/10 Low 0 unhealthy d/yr today · 0 by 30 yrs out
Nearby sold comps map
Loading sold comps map…
Walkable amenities ~0.75 mi
Loading nearby amenities…
Taxation est. · year 1
- Rental income
- $19,200
- − Mortgage interest
- −$10,363
- − Property taxes
- −$551
- − Insurance
- −$925
- − Repairs & maintenance
- −$1,536
- − Management
- −$1,536
- − Depreciation
- −$5,382
- Taxable loss
- −$1,093
- Est. tax savings @ 24.0%
- +$262
- After-tax cash flow
- $2,312/yr
For passive investors: Depreciation is non-cash, so a rental often shows a tax loss while cash-flowing — sheltering income. Rental losses are passive: they offset passive income freely, and up to $25,000/yr can offset ordinary (W-2) income if you actively participate and your MAGI is under $100k (phasing out to $0 by $150k); unused losses carry forward. On sale, claimed depreciation is recaptured at up to 25%, and gains may owe capital-gains tax (a 1031 exchange can defer both). Figures are a year-1 estimate at your 24.0% rate — not tax advice; consult a CPA.
Schools (NCES district)
- District
- Sampson County Schools
- NCES district ID
- 3704140
- Math proficiency
- 40% ▼ -6.00%
- Reading proficiency
- 41% ▼ -6.00%
- Median HH income
- $37,391
- Composite
- 33.71/100
- National rank
- #5379
- State rank
- #114 of 178 in NC
Livability — Autryville
- Score
- 57/100
- State rank
- #592
- US rank
- #21630
Category grades
Schools grade is shown separately in the Schools card above.
Census & demographics
- Census place
- Autryville, NC
- Population (ZIP)
- 4,303
Population outlook (Sampson County) Hauer SSP2
- Today (2025)
- 63,499 people
- By 2030
- 62,970 · -0.8%
- By 2040
- 61,609 · -3.0%
- By 2050
- 60,462 · -4.8%
- By 2075
- 60,108 · -5.3%
- By 2100
- 62,120 · -2.2%
Race, ethnicity, and origin ACS 2023
- Neighborhood character
- Predominantly White (69%)
- Race & ethnicity
- White 69% Black 12% Hispanic / Latino 12% Two or more races 2% Asian 2% Native American 1%
- Hispanic origin (detail)
- Mexican 9%
- Common ancestry
- Slovak 2% Serbian 1% Italian 1%
- Foreign-born
- 4% · Canada, China
- Languages at home
- 92% English-only · Spanish 5% Korean 2% Chinese 1%
Political lean MEDSL · Sampson
- 2024 margin
- Strong R (+29.8) · D 34.8% · R 64.6%
- 2008→2024 swing
- -21.3pp toward R · 2008: -8.4pp · 2024: -29.8pp
- All cycles
- 2024: R+29.8 2020: R+22.5 2016: R+16.7 2012: R+11.0 2008: R+8.4
Not yet ingested
- Civics
- —
Market trends
- HPI YoY
- ▲ 2.21%
- Current HPI
- 263.6889
- Rent YoY
- —
- Metro
- —
- State GDP YoY
- ▲ 3.28%
- F500 in state
- 26
Industry mix (Fortune 500 HQ in NC)
| Industry | F500 HQs | Revenue |
|---|---|---|
| Financial Services | 2 | $213B |
|
||
| Retail | 2 | $95B |
|
||
| Industrial Conglomerate | 1 | $38B |
|
||
| Metals / Steel | 1 | $35B |
|
||
| Utilities | 1 | $30B |
|
||
| Industrial Machinery | 1 | $19B |
|
||
Price history
+533.3% since first listed4 events — show timeline
- 2026-06-03 Listed $190,000 LPRMLS
- 2026-05-04 Rental Removed $1,400 TMLS
- 2026-04-08 Listed for Rent $1,400 TMLS
- 2019-10-30 Sold (Public Records) $30,000 Public Records
Property tax history
+15.9%/yrLatest (2025): $551 · +5.5% YoY. Source: county tax records.
Cash-flow waterfall
monthlySold comps — $/sqft
last 12 mo · ≤1 miLoading sold comps…