385 Vengeance Creek Rd · Marble, NC
Flood risk 1/10 · Minimal
- FEMA flood zone
- X (unshaded)
- Chance of flooding over 30 yrs
- 0.0%
- Est. flood insurance / yr
- $507 – $1,088
Fire risk 5/10 · Moderate
- Est. fire insurance / yr
- $906 – $1,684
Heat risk 4/10 · Minor
- Hot days now (above 96°F)
- 7 days/yr
- Hot days in 30 yrs
- 19 days/yr
Wind risk 2/10 · Minimal
- Chance of severe wind over 30 yrs
- —
Air-quality risk 4/10 · Minor
- Unhealthy air days now
- 5 days/yr
- Unhealthy air days in 30 yrs
- 5 days/yr
Risk factors via First Street. Map © Google.
Why this score? — see what drove the D grade
The composite is a weighted blend of 9 inputs, each scored 0–100. Each bar is that input's sub-score; the figure is the points it added to the 100-point composite (weight × sub-score).
- Cash flow +14.1/30.0
- ARV discount +7.5/15.0
- DSCR +4.3/10.0
- Schools +3.7/10.0
- Livability +3.0/5.0
- 1% rule +2.6/10.0
- Rent growth +2.5/5.0
- Condition / age +2.5/5.0
- Appreciation +0.0/10.0
$189,000
🖨 Deal sheet 📄 Offer letter ✓ Due diligence
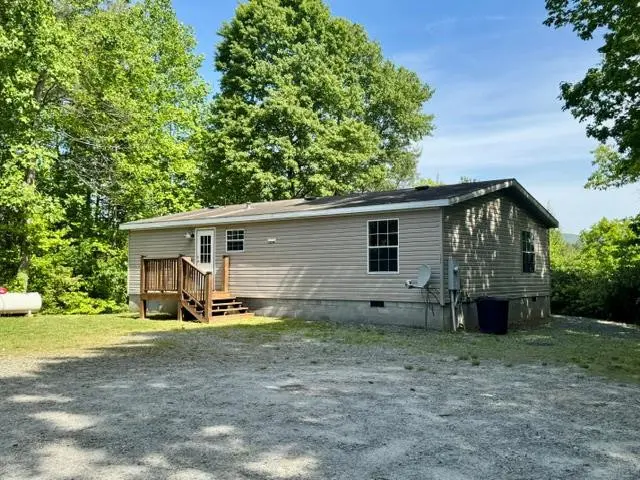
Listing remarks
Looking for affordable mountain living without sacrificing everyday comfort? This 2 bedroom, 2 bath manufactured home offers 1,080 sqft on 0.9 acres, giving you room to spread out, garden, relax, or create the outdoor space you have been wanting. Inside, wood laminate flooring through the living room, kitchen, and common areas keeps maintenance simple. The bathrooms feature custom tile touches. Located in Marble, you are positioned between Murphy and Andrews with convenient access to mountain recreation, local dining, shopping, Harrah's Cherokee Valley River Casino, the Nantahala National Forest, fishing, boating, hiking, and whitewater adventures. A practical full-time home, weekend getawa
Key facts
- Boating
- Convenient access
- Fishing
Tags
Property features AI
Exterior
- Parking: No garage
- Security: Smoke detector(s)
- Utilities: Well water; Septic tank
- Home design: Residential property; One level
- Construction: Vinyl siding construction; Permanent foundation
- Exterior features: Composition roof; Approximately 0.9-acre lot; Vinyl siding
Interior
- Kitchen: Refrigerator; Electric water heater
- Bedrooms: 6 total rooms (bedroom count not specified)
- Flooring: Carpet; Tile; Vinyl
- Bathrooms: 2 full bathrooms
- Heating & cooling: Propane heating; Wall/window cooling units
- Interior features: Ceiling fan(s); Smoke detector(s)
- Laundry & utility: Washer; Dryer; Washer hookup
Neighborhood map
What this means for you Summary
Snapshot
- This is a 2-bed/2.0-bath single-family listed at $189k.
Deal economics
- At list price, monthly cash flow is $29 ($343/yr) — positive.
- The deal already cash-flows at list — no discount required.
- To meet the 1% rule (rent ≥ 1% of price), the offer needs to be $143k (24.2% below list).
- Recommended offer: $143k (24.2% below list) — sets the bar for 1% rule.
- Cap rate 6.5% vs local median 2.4% in Marble — top-decile yield for the area; either an underpriced asset or a hidden risk that comps aren't pricing in. Stress-test before assuming the spread holds.
Location & tenants
- Location reads 60/100 on livability (#509 in NC) — a middle-class / working-renter tenant base. Strengths: cost of living A+, housing A+; Watch: health & safety C-, crime F, amenities F.
- Cherokee County Schools (rural): math 42% / reading 47% proficiency, ranked #90 of 178 in NC (top 51%) — families likely to look elsewhere, expect single-tenant / working-renter base with shorter leases.
- Zoned schools: Andrews Middle (math 39% / reading 41%, grade F, #222 of 475 statewide, top 49%, 187 students, 70% FRL); Andrews High (math 50% / reading 64%, grade C, #248 of 535 statewide, top 48%, 225 students, 63% FRL).
- Market conditions: 1119 active listings in the ZIP; 232 units permitted in Cherokee County in 2024 (0 in 5+ unit buildings).
Forward outlook
- Local home prices are declining (-3.0%/yr); year-one equity from $1k of loan paydown is wiped out by about $6k of value loss. Plan a longer hold.
- Cherokee County population projected at -24% by 2050 — secular population decline; favor cash flow + early exit over multi-decade hold.
Negotiation context
- Only 2 days on market — expect competitive offers; lowballing is unlikely to land.
- Current owner paid $72k; list at $189k implies a 162% gain — meaningful room to come down on a strong offer.
Risks & watch-outs
- Climate carrying-cost: moderate wildfire risk — expect insurance premiums to compound above CPI over the hold.
Questions for the listing agent
- Is there a deadline driving the sale (1031 exchange, divorce, estate, relocation)? That informs how much negotiation room exists.
- Schools are F-rated, which usually means shorter tenancies and higher turnover. Who's the typical renter profile here, and what's been the actual vacancy rate?
- Crime grade is F in this area — have there been break-ins, vandalism, or insurance claims at this property in the last 3 years? What carrier currently insures it and at what premium?
- The area grade is low — what's the realistic commute time and amenity access for the typical tenant pool here? Any planned neighborhood developments (good or bad) we should know about?
- What's the average days-on-market for RENTAL listings here right now (not sales)? A rising rental-DOM trend means longer vacancies and softer asking-rent achievability than the comps imply.
- What's the recent tenant-quality profile in this submarket — average credit score on applications, eviction rate, late-payment / NSF rate, and stable-employment percentage? A property-management company in the area should have these aggregated.
- How much new for-sale + rental construction is in the pipeline within 1–3 miles? Heavy new supply typically softens prices + rents 12–24 months out; constrained supply supports both.
Investment metrics
- 1% rule
- 0.76% ✗
- Cap rate
- 6.47%
- Cash-on-cash
- 0.65%
- DSCR
- 1.03
- GRM
- 11.0
CMA / ARV
No comps found within radius.
Projected returns pro-forma
-3.0% appreciation · 3.0% rent growth · sell at horizon
- IRR
- -15.3%
- Equity multiple
- 0.45×
- Total profit
- $-28,907
- Equity at exit
- $28,181
- IRR
- -6.9%
- Equity multiple
- 0.56×
- Total profit
- $-23,245
- Equity at exit
- $16,341
Cash invested: $52,920 (down + closing). Projections, not guarantees.
Landlord ↔ Tenant lean methodology
- Overall (STATE)
- 85 Strongly Landlord-Friendly
- State North Carolina
- 85 Strongly Landlord-Friendly · R+3
- County
- — inherits STATE
- City
- — inherits STATE
ZIP-level market 28906
- Home prices YoY
- -18.3%
- Active inventory
- 1119
- Price-to-rent
- 11.0×
Monthly cashflow live
- Estimated rent
- $1,433 medium interval (Pro) →
- Mortgage (P&I)
- −$991
- Tax from tax record
- −$33 /mo · $399/yr
- Insurance
- −$79
- HOA
- −$0
- Vacancy / Maint / Mgmt
- −$301
- Net cashflow
- $29
Break-even live
UW: 25.0% down · 7.5% · 30yr · 1.5% tax · 5.0% vac · 8.0% maint · 8.0% mgmt
Financing live
Cash to close
- Down payment
- $47,250
- Closing costs
- $5,670
- Reserves months
- —
- Total cash needed
- —
Loan-product check · same deal, 3 products live
Conventional
25% down · 7.5% · 30yr
- Down + closing
- —
- Monthly P&I
- —
- Monthly cashflow
- —
- DSCR
- —
- Eligible?
- —
Personal DTI + credit; lowest rate.
DSCR
20% down · 8.5% · 30yr
- Down + closing
- —
- Monthly P&I
- —
- Monthly cashflow
- —
- DSCR
- —
- Eligible?
- —
No personal income docs; deal must DSCR.
Hard money
10% down · 12.0% · 12mo
- Down + closing
- —
- Monthly P&I
- —
- Monthly cashflow
- —
- DSCR
- —
- Eligible?
- —
Short-term bridge; refi at stabilization.
Listing history 2 events
-
2026-06-09remarks 699-char remark
-
2026-06-09$189,000 Pending 2 DOM
ⓘ Source: listings_history table (triggers on properties + properties_extension) + one-shot
backfill from property_details.listing_events for pre-trigger history.
Tax reassessment forecast NC · Resets to sale price
- Current annual tax
- $399 · $33/mo
- Projected year-2 tax
- $1,550 · $129/mo
- Expected delta
- +$1,150/yr (+$96/mo · 288.0%)
ⓘ Screening estimate from a state-policy table — verify with the county assessor before closing.
Climate risk First Street
- Flood 1/10 Low FEMA zone X (unshaded) · 0% chance over 30 yrs
- Wildfire 5/10 Major
- Heat 4/10 Moderate 7 d/yr ≥96°F today · 19 d/yr by 30 yrs out
- Wind 2/10 Low
- Air quality 4/10 Moderate 5 unhealthy d/yr today · 5 by 30 yrs out
Nearby sold comps map
Loading sold comps map…
Walkable amenities ~0.75 mi
Loading nearby amenities…
Taxation est. · year 1
- Rental income
- $17,192
- − Mortgage interest
- −$10,587
- − Property taxes
- −$399
- − Insurance
- −$945
- − Repairs & maintenance
- −$1,375
- − Management
- −$1,375
- − Depreciation
- −$5,498
- Taxable loss
- −$2,989
- Est. tax savings @ 24.0%
- +$717
- After-tax cash flow
- $1,061/yr
For passive investors: Depreciation is non-cash, so a rental often shows a tax loss while cash-flowing — sheltering income. Rental losses are passive: they offset passive income freely, and up to $25,000/yr can offset ordinary (W-2) income if you actively participate and your MAGI is under $100k (phasing out to $0 by $150k); unused losses carry forward. On sale, claimed depreciation is recaptured at up to 25%, and gains may owe capital-gains tax (a 1031 exchange can defer both). Figures are a year-1 estimate at your 24.0% rate — not tax advice; consult a CPA.
Schools (NCES district)
- District
- Cherokee County Schools
- NCES district ID
- 3700780
- Math proficiency
- 42% ▲ 1.00%
- Reading proficiency
- 47% ▼ -2.00%
- Median HH income
- $36,424
- Composite
- 36.91/100
- National rank
- #4542
- State rank
- #90 of 178 in NC
Livability — Marble
- Score
- 60/100
- State rank
- #509
- US rank
- #18665
Category grades
Schools grade is shown separately in the Schools card above.
Census & demographics
- Population (ZIP)
- 19,712
Population outlook (Cherokee County) Hauer SSP2
- Today (2025)
- 25,672 people
- By 2030
- 24,504 · -4.5%
- By 2040
- 21,955 · -14.5%
- By 2050
- 19,592 · -23.7%
- By 2075
- 15,128 · -41.1%
- By 2100
- 11,203 · -56.4%
Race, ethnicity, and origin ACS 2023
- Neighborhood character
- Predominantly White (91%)
- Race & ethnicity
- White 91% Two or more races 4% Hispanic / Latino 4% Black 1%
- Common ancestry
- Slovak 4% Serbian 3% Lithuanian 2%
- Foreign-born
- 2% · Canada
- Languages at home
- 98% English-only · Spanish 2% Other Indo-European 1%
Political lean MEDSL · Cherokee
- 2024 margin
- Solid R (+57.5) · D 20.8% · R 78.2% · Other 1.0%
- 2008→2024 swing
- -18.9pp toward R · 2008: -38.6pp · 2024: -57.5pp
- All cycles
- 2024: R+57.5 2020: R+55.1 2016: R+57.0 2012: R+46.2 2008: R+38.6
Not yet ingested
- Civics
- —
Market trends
- HPI YoY
- ▼ -47.19%
- Current HPI
- 211.1795
- Rent YoY
- —
- Metro
- —
- State GDP YoY
- ▲ 3.28%
- F500 in state
- 26
Industry mix (Fortune 500 HQ in NC)
| Industry | F500 HQs | Revenue |
|---|---|---|
| Financial Services | 2 | $213B |
|
||
| Retail | 2 | $95B |
|
||
| Industrial Conglomerate | 1 | $38B |
|
||
| Metals / Steel | 1 | $35B |
|
||
| Utilities | 1 | $30B |
|
||
| Industrial Machinery | 1 | $19B |
|
||
Price history
+162.5% since first listed3 events — show timeline
- 2026-06-03 Pending — Hive MLS
- 2026-05-04 Listed $189,000 Hive MLS
- 2003-09-16 Sold (Public Records) $72,000 Public Records
Property tax history
-0.5%/yrLatest (2025): $399 · +0.0% YoY. Source: county tax records.
Cash-flow waterfall
monthlySold comps — $/sqft
last 12 mo · ≤1 miLoading sold comps…