 Triplex
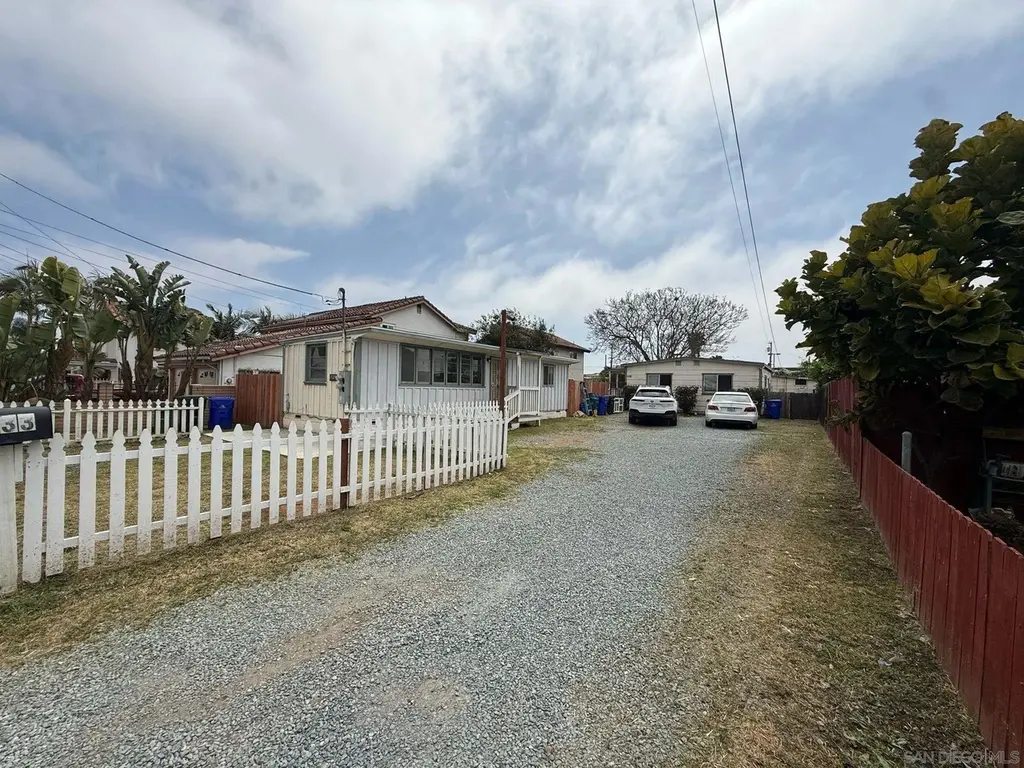
1729-33 Dahlia Ave · San Diego, CA
Flood risk 1/10 · Minimal
- FEMA flood zone
- X (unshaded)
- Chance of flooding over 30 yrs
- 0.0%
- Est. flood insurance / yr
- $507 – $1,088
Fire risk 2/10 · Minimal
- Est. fire insurance / yr
- $659 – $1,223
Heat risk 4/10 · Minor
- Hot days now (above 86°F)
- 7 days/yr
- Hot days in 30 yrs
- 19 days/yr
Wind risk 1/10 · Minimal
- Chance of severe wind over 30 yrs
- —
Air-quality risk 1/10 · Minimal
- Unhealthy air days now
- 0 days/yr
- Unhealthy air days in 30 yrs
- 0 days/yr
Risk factors via First Street. Map © Google.
Why this score? — see what drove the C+ grade
The composite is a weighted blend of 9 inputs, each scored 0–100. Each bar is that input's sub-score; the figure is the points it added to the 100-point composite (weight × sub-score).
- Cash flow +24.4/30.0
- DSCR +7.9/10.0
- ARV discount +7.5/15.0
- 1% rule +6.3/10.0
- Condition / age +4.0/5.0
- Schools +3.9/10.0
- Livability +3.8/5.0
- Rent growth +2.4/5.0
- Appreciation +0.0/10.0
$949,000
🖨 Deal sheet 📄 Offer letter ✓ Due diligence
Multi-family units
County records classify this as Multi-Family (5+ Unit). Listing-text estimate: 3 units. estimate disagrees with records
5+ unit building — per-unit beds/baths from public records are typically unavailable; the breakdown below (if shown) is an estimate from the listing text.
Listing remarks
Motivated Seller! Rare opportunity to own a high income producing investment property with strong cap rate potential. The property consists of two legal units and one additional unit with unknown permit status, for a total of three units. The front unit is a 2 bedroom 1 bathroom approximately 600 square feet. The main unit is a 2 bedroom 2 bathroom approximately 700 square feet and has just been fully remodeled. It is currently vacant and ready for a new tenant at market rent. The rear unit is a 1 bedroom 1 bathroom approximately 300 square feet with permit status unknown. Two units are currently occupied, providing immediate rental income, while the vacant unit offers upside potential for
Key facts
- Fully remodeled
- Two legal units
- 8,278 sq ft lot
Tags
Property features AI
Finance
- Other: Pets allowed; Zoning: R-2 (minor)
- Financial info:
- HOA & community:
Exterior
- Parking:
- Security:
- Utilities: Irrigation source: N/K
- Home design: Residential income (multi-family); 2–4 unit property; Single-story
- Construction: Stucco construction
- Exterior features: Partial fencing; Composition roof
Interior
- Kitchen:
- Bedrooms: Multi-family residential unit(s)
- Flooring:
- Bathrooms: 4 full bathrooms
- Heating & cooling: Natural gas heating; Wall/window air conditioning units
- Interior features: Partial fencing
- Laundry & utility:
Neighborhood map
What this means for you Summary
Snapshot
- This is a 3 × 5-bed/4.0-bath units multifamily listed at $949k. Condition is rated good.
Deal economics
- At list price, monthly cash flow is $2k ($23k/yr) — positive. Per door: $645/mo.
- The deal already cash-flows at list — no discount required.
- Meets the 1% rule at list price ($11k rent vs $949k).
- Recommended offer: $892k (6.0% below list) — sets the bar for market timing.
- Cap rate 8.7% vs local median 2.0% in San Diego — top-decile yield for the area; either an underpriced asset or a hidden risk that comps aren't pricing in. Stress-test before assuming the spread holds.
Location & tenants
- Location reads 75/100 on livability (#123 in CA, #4,206 nationally) — a middle-class / working-renter tenant base. Strengths: amenities A+, commute A+, employment A+; Watch: health & safety C-, crime D+, cost of living F.
- Sweetwater Union High (suburban): math 36% / reading 52% proficiency, ranked #187 of 517 in CA (top 36%) — families likely to look elsewhere, expect single-tenant / working-renter base with shorter leases.
- Market conditions: Rents soft (-0.5%/yr); 210 active listings in the ZIP; solid renter incomes; 11,759 units permitted in San Diego County in 2024 (7,244 in 5+ unit buildings).
- At $10,750/mo this rent would consume 136% of the median local household income ($95k/yr) (locally 2959% of renters already pay >50% of income on rent) — very limited rent-growth headroom before tenants either downsize or default.
Forward outlook
- Local home prices are declining (-3.0%/yr); year-one equity from $7k of loan paydown is wiped out by about $28k of value loss. Plan a longer hold.
- San Diego County population projected at +20% by 2050 — long-run rental-demand tailwind backs the buy-and-hold thesis.
Negotiation context
- It's been on market 84 days — a 6% lower offer ($892k) is reasonable based on typical stale-listing flexibility.
- 5 sale attempts with the ask held roughly flat each time — persistent listings suggest the price (not the market) is what's stuck; bring a comps-based counter.
Risks & watch-outs
- Watch-outs: built in 1943 — expect roof / HVAC / electrical / plumbing capex.
Questions for the listing agent
- It's been on market 84 days. Have you received any prior offers? Is the seller open to a 6% concession, seller financing, or rate buy-down credit?
- Can we see the unit-by-unit rent roll, current vacancy, and any below-market leases? What's the average tenancy length?
- What capital expenditures (roof, boiler, parking lot, exteriors) have been made in the last 5 years, and what's planned in the next 2?
- Built in 1943 — when were the roof, HVAC, electrical panel, plumbing, and water heater last replaced?
- Why hasn't it sold? Are there any deal-killer items the seller is aware of (foundation, flood, title, zoning, code violations)?
- Is there a deadline driving the sale (1031 exchange, divorce, estate, relocation)? That informs how much negotiation room exists.
- Schools are B-rated — typically a magnet for longer-tenancy family renters. What's the average tenant stay here, and is there a school-zone premium baked into asking?
- Crime grade is D in this area — have there been break-ins, vandalism, or insurance claims at this property in the last 3 years? What carrier currently insures it and at what premium?
- What's the average days-on-market for RENTAL listings here right now (not sales)? A rising rental-DOM trend means longer vacancies and softer asking-rent achievability than the comps imply.
- What's the recent tenant-quality profile in this submarket — average credit score on applications, eviction rate, late-payment / NSF rate, and stable-employment percentage? A property-management company in the area should have these aggregated.
- How much new apartment / multifamily construction is in the pipeline within 1–3 miles? Heavy new supply (>2% of stock underway) typically softens rents 12–24 months out; light construction supports rent growth.
Investment metrics
- 1% rule
- 1.13% ✓
- Cap rate
- 8.74%
- Cash-on-cash
- 8.73%
- DSCR
- 1.39
- GRM
- 7.4
CMA / ARV
No comps found within radius.
Projected returns pro-forma
-3.0% appreciation · 0.0% rent growth · sell at horizon
- IRR
- -6.5%
- Equity multiple
- 0.77×
- Total profit
- $-61,932
- Equity at exit
- $141,499
- IRR
- -1.0%
- Equity multiple
- 0.94×
- Total profit
- $-16,396
- Equity at exit
- $82,052
Cash invested: $265,720 (down + closing). Projections, not guarantees.
Landlord ↔ Tenant lean methodology
- Overall (STATE)
- 18 Strongly Tenant-Friendly
- State California
- 18 Strongly Tenant-Friendly · D+13
- County
- — inherits STATE
- City
- — inherits STATE
ZIP-level market 92154
- Rents YoY
- -0.5%
- Active inventory
- 210
- Price-to-rent
- 22.1×
Monthly cashflow live
- Estimated rent
- $10,750 medium interval (Pro) →
- Mortgage (P&I)
- −$4,977
- Tax est. 1.5%
- −$1,186 /mo · $14,235/yr
- Insurance
- −$395
- HOA
- −$0
- Vacancy / Maint / Mgmt
- −$2,258
- Net cashflow
- $1,934
Break-even live
3-unit breakdown (identical units grouped — click to expand)
| Units | Beds | Baths | Est. rent |
|---|---|---|---|
| 3× units | 5 | 4 | $10,749 |
| #1 | 5 | 4 | $3,583 |
| #2 | 5 | 4 | $3,583 |
| #3 | 5 | 4 | $3,583 |
| Total (3 units) | $10,750 | ||
UW: 25.0% down · 7.5% · 30yr · 1.5% tax · 5.0% vac · 8.0% maint · 8.0% mgmt
Financing live
Cash to close
- Down payment
- $237,250
- Closing costs
- $28,470
- Reserves months
- —
- Total cash needed
- —
Loan-product check · same deal, 3 products live
Conventional
25% down · 7.5% · 30yr
- Down + closing
- —
- Monthly P&I
- —
- Monthly cashflow
- —
- DSCR
- —
- Eligible?
- —
Personal DTI + credit; lowest rate.
DSCR
20% down · 8.5% · 30yr
- Down + closing
- —
- Monthly P&I
- —
- Monthly cashflow
- —
- DSCR
- —
- Eligible?
- —
No personal income docs; deal must DSCR.
Hard money
10% down · 12.0% · 12mo
- Down + closing
- —
- Monthly P&I
- —
- Monthly cashflow
- —
- DSCR
- —
- Eligible?
- —
Short-term bridge; refi at stabilization.
Listing history 25 events
-
2026-06-17days on market $949,000 Active 84 DOM
-
2026-06-16days on market $949,000 Active 83 DOM
-
2026-06-15days on market $949,000 Active 82 DOM
-
2026-06-13days on market $949,000 Active 80 DOM
-
2026-06-13days on market $949,000 Active 79 DOM
-
2026-06-09days on market $949,000 Active 76 DOM
-
2026-06-08days on market $949,000 Active 75 DOM
-
2026-06-07days on market $949,000 Active 74 DOM
-
2026-06-04days on market $949,000 Active 71 DOM
-
2026-06-03days on market $949,000 Active 70 DOM
-
2026-06-02days on market $949,000 Active 69 DOM
-
2026-06-01days on market $949,000 Active 68 DOM
-
2026-05-31days on market $949,000 Active 67 DOM
-
2026-04-16price $949,000
-
2026-04-14historical $2,550
-
2026-04-01price $2,550
-
2026-03-25price $2,700
-
2026-03-25$995,000 Active
-
2026-01-13$2,900
-
2025-07-22historical $2,890
-
2025-07-02$2,890
-
2025-06-26historical $2,890
-
2025-06-09historical
-
2025-05-07$1,150,000 Active
-
2025-04-17$2,890
ⓘ Source: listings_history table (triggers on properties + properties_extension) + one-shot
backfill from property_details.listing_events for pre-trigger history.
Climate risk First Street
- Flood 1/10 Low FEMA zone X (unshaded) · 0% chance over 30 yrs
- Wildfire 2/10 Low
- Heat 4/10 Moderate 7 d/yr ≥86°F today · 19 d/yr by 30 yrs out
- Wind 1/10 Low
- Air quality 1/10 Low 0 unhealthy d/yr today · 0 by 30 yrs out
Nearby sold comps map
Loading sold comps map…
Walkable amenities ~0.75 mi
Loading nearby amenities…
Taxation est. · year 1
- Rental income
- $129,000
- − Mortgage interest
- −$53,159
- − Property taxes
- −$14,235
- − Insurance
- −$4,745
- − Repairs & maintenance
- −$10,320
- − Management
- −$10,320
- − Depreciation
- −$27,607
- Taxable income
- $8,614
- Est. tax owed @ 24.0%
- −$2,067
- After-tax cash flow
- $21,143/yr
For passive investors: Depreciation is non-cash, so a rental often shows a tax loss while cash-flowing — sheltering income. Rental losses are passive: they offset passive income freely, and up to $25,000/yr can offset ordinary (W-2) income if you actively participate and your MAGI is under $100k (phasing out to $0 by $150k); unused losses carry forward. On sale, claimed depreciation is recaptured at up to 25%, and gains may owe capital-gains tax (a 1031 exchange can defer both). Figures are a year-1 estimate at your 24.0% rate — not tax advice; consult a CPA.
Condition & rehab AI · 13 photos
This multi-family property is in good condition with recent renovations, offering a good investment opportunity with strong rental potential.
Value-add opportunities
- Both Paint exterior — Enhances curb appeal and value
- Both Landscaping improvements — Improves curb appeal and value
- Both Add smart home features — Enhances convenience and marketability
Renovation cost estimate screening
Value-add ROI direction
- Both Paint exterior — Enhances curb appeal and value ↑
- Both Landscaping improvements — Improves curb appeal and value ↑
- Both Add smart home features — Enhances convenience and marketability ↑
ⓘ Cost ranges are severity-bucket heuristics (US national rule-of-thumb). Get contractor quotes + a written scope before underwriting a rehab budget.
Schools (NCES district)
- District
- Sweetwater Union High
- NCES district ID
- 0638640
- Math proficiency
- 36% ▲ 3.00%
- Reading proficiency
- 52% ▼ -2.00%
- Median HH income
- $59,051
- Composite
- 38.61/100
- National rank
- #4158
- State rank
- #187 of 517 in CA
Livability — San Diego
- Score
- 75/100
- State rank
- #123
- US rank
- #4206
Category grades
Schools grade is shown separately in the Schools card above.
Census & demographics
- Census place
- San Diego, CA
- County
- San Diego County · 3,178,799 people
- City population
- 1,397,612
- Metro
- San Diego-Chula Vista-Carlsbad, CA
- Population (ZIP)
- 80,445
- Household income
- $94,901
- Rent vs Own
- Severe rent burden
- 2959.0
Population outlook (San Diego County) Hauer SSP2
- Today (2025)
- 3,678,185 people
- By 2030
- 3,856,546 · +4.8%
- By 2040
- 4,171,407 · +13.4%
- By 2050
- 4,421,607 · +20.2%
- By 2075
- 4,831,599 · +31.4%
- By 2100
- 4,832,502 · +31.4%
Race, ethnicity, and origin ACS 2023
- Neighborhood character
- Predominantly Hispanic (68%)
- Race & ethnicity
- Hispanic / Latino 68% Two or more races 30% White 12% Asian 12% Black 5% Native American 1%
- Hispanic origin (detail)
- Mexican 65%
- Foreign-born
- 32% · Canada, China
- Languages at home
- 35% English-only · Spanish 56% Tagalog/Filipino 7% Chinese 1%
Political lean MEDSL · San Diego
- 2024 margin
- D (+16.8) · D 56.9% · R 40.1% · Other 2.9%
- 2008→2024 swing
- +6.6pp toward D · 2008: 10.2pp · 2024: 16.8pp
- All cycles
- 2024: D+16.8 2020: D+22.8 2016: D+17.8 2012: D+5.1 2008: D+10.2
Not yet ingested
- Civics
- —
Market trends
- HPI YoY
- ▼ -568.62%
- Current HPI
- 393.1836
- Rent YoY
- ▼ -0.52%
- Metro
- San Diego-Chula Vista-Carlsbad, CA
- State GDP YoY
- ▲ 3.21%
- F500 in state
- 116
Industry mix (Fortune 500 HQ in CA)
| Industry | F500 HQs | Revenue |
|---|---|---|
| Technology | 27 | $1,492B |
|
||
| Financial Services | 3 | $174B |
|
||
| Retail | 3 | $44B |
|
||
| Insurance | 3 | $26B |
|
||
| Media / Entertainment | 2 | $115B |
|
||
| Pharmaceuticals / Biotech | 2 | $62B |
|
||
Price history
+32737.4% since first listed12 events — show timeline
- 2026-04-16 Price Changed $949,000 SDMLS
- 2026-04-14 Rental Removed $2,550 SDMLS
- 2026-04-01 Price Changed $2,550 SDMLS
- 2026-03-25 Price Changed $2,700 SDMLS
- 2026-03-25 Listed $995,000 SDMLS
- 2026-01-13 Listed for Rent $2,900 SDMLS
- 2025-07-22 Rental Removed $2,890 SDMLS
- 2025-07-02 Listed for Rent $2,890 SDMLS
- 2025-06-26 Rental Removed $2,890 SDMLS
- 2025-06-09 Listing Removed — SDMLS
- 2025-05-07 Listed $1,150,000 SDMLS
- 2025-04-17 Listed for Rent $2,890 SDMLS
Cash-flow waterfall
monthlySold comps — $/sqft
last 12 mo · ≤1 miLoading sold comps…